
U ARE A BASIC TO MD LEVEL PROFESSOR FOR CVS IN DETAIL FROM EMBRYO TO THE MASTER LEVEL ACCORDING TO CURRICULUM ASK ME IF U HAVE ANY QUESTIONS
Where should we start today's session? · How should I deliver each topic? · Should homoeopathic correlation be woven into each topic or kept separate (as Day 7 in your plan)?
development of the heart embryology cardiac tube looping stages
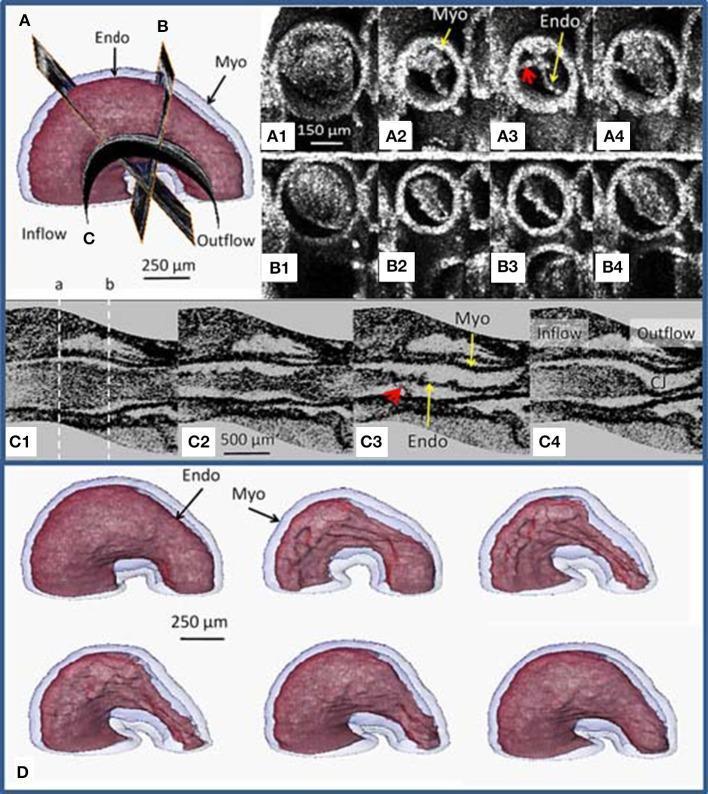
This composite image presents Optical Coherence Tomography (OCT) imaging and 3D surface renderings of a stage 13 embryonic avian heart (quail model), illustrating early cardiac looping and structural dynamics. The visual content is organized into four sections. Section A/B shows a 3D model with cross-sectional planes and corresponding time-sequence OCT slices (A1-A4 and B1-B4) that demonstrate the heart tube's eccentric deformation during the cardiac cycle; red arrows highlight tether-like connections between the myocardium (Myo) and endocardium (Endo). Section C1-C4 displays curved longitudinal OCT slices through the center of the heart tube, revealing non-uniform tissue morphology, scalloped endocardial cushions, and the spatial relationship between the inflow and outflow tracts. Section D features segmented 3D surface renderings of the myocardium (blue) and endocardium (red) at different stages of contraction, showing the endocardium folding into longitudinal ridges. This content is designed for developmental cardiology and embryology education, focusing on the mechanical relationship between tissue layers and cardiac jelly redistribution during early heart development.
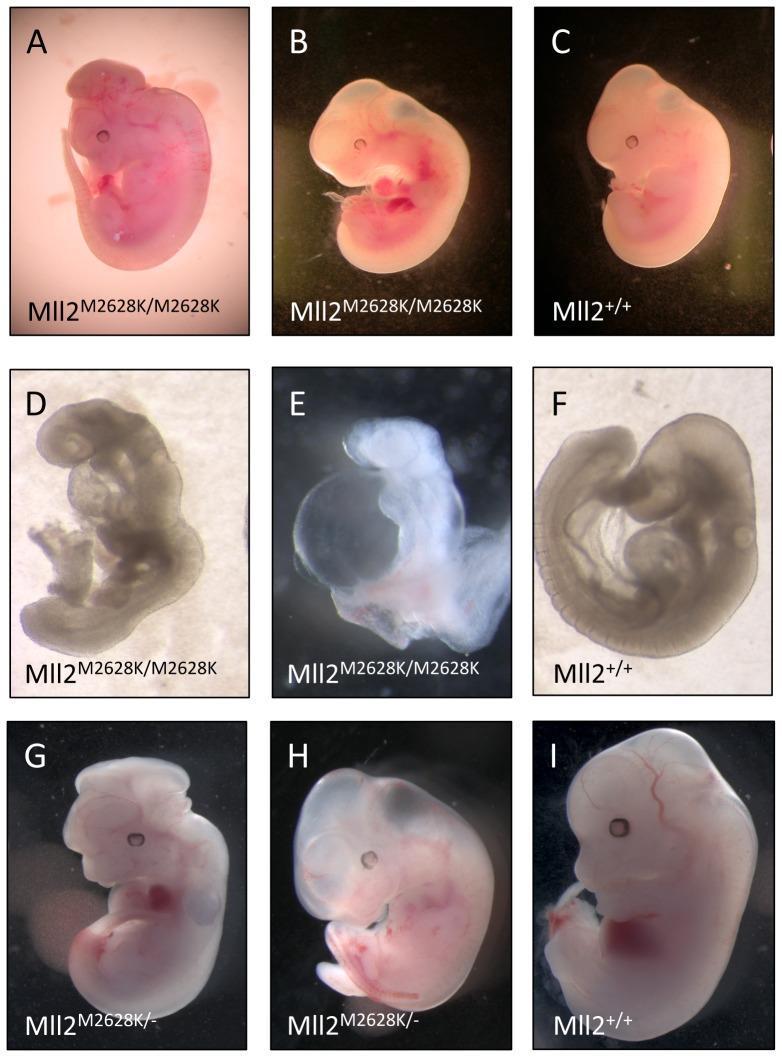
This composite of clinical photographs displays a side-by-side comparison of embryonic development in a mouse model, specifically examining the effects of the Mll2 M2628K mutation. The image is organized into three rows (A-C, D-F, G-I) comparing mutant (Mll2 M2628K/M2628K and Mll2 M2628K/-) embryos against wild-type (Mll2+/+) controls. Key developmental abnormalities in the mutants include exencephaly (protrusion of brain tissue due to neural tube defects), visible in panels A and G; severe pericardial oedema (fluid accumulation around the heart), prominent in B, E, and H; and abnormal heart looping and growth retardation shown in D and E. Panel E specifically illustrates anterior truncation defects at 9.5 dpc. In contrast, the wild-type embryos (C, F, I) demonstrate normal morphology, proper axial turning, and typical developmental progression for their respective stages (9.5 and 12.5 dpc). This figure serves as an educational tool for embryology and genetics, illustrating how specific genetic mutations disrupt midline development, cardiac morphogenesis, and neural tube closure.
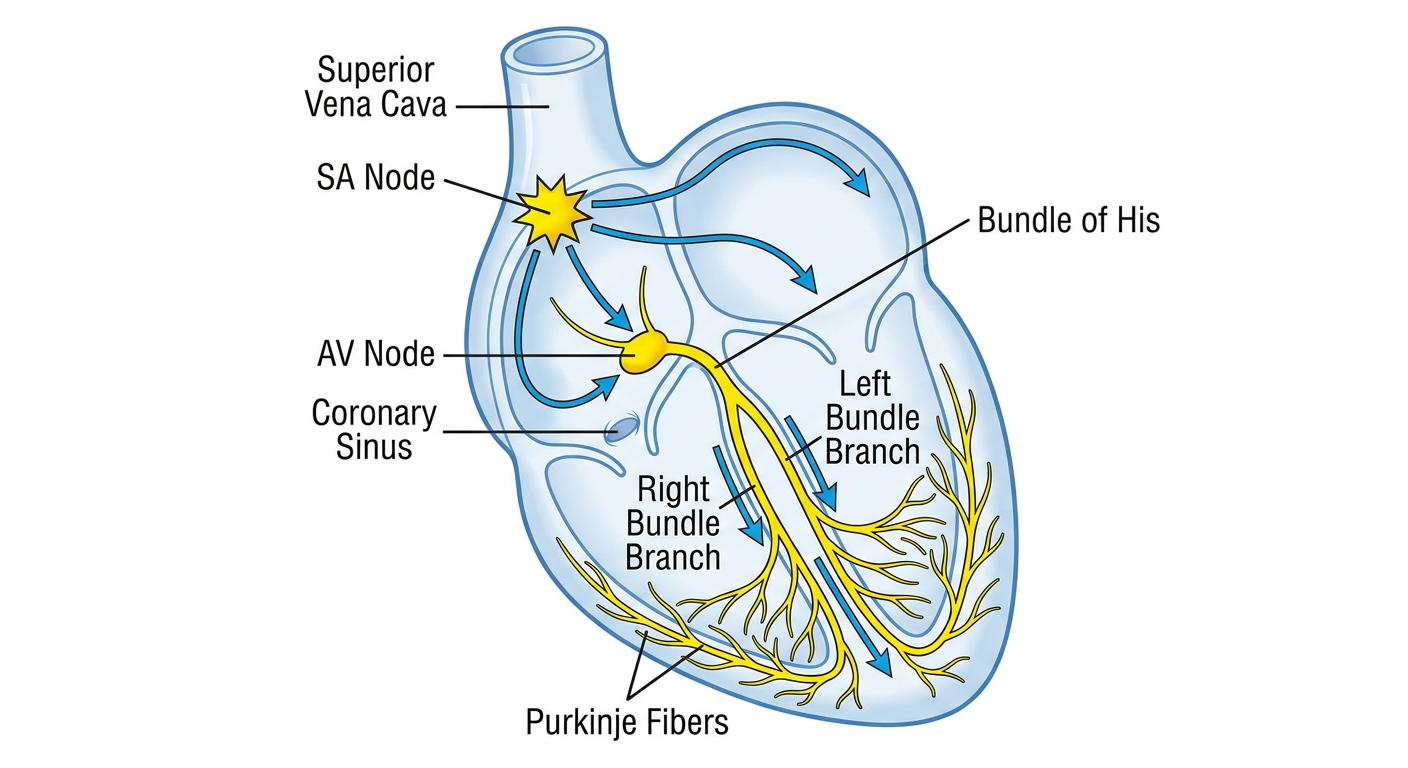
conduction system of the heart SA node AV node bundle of His diagram
Day 1 — Developmental Anatomy of the Heart + Cardiac Physiology
(PM 01, first block — basic embryology through MD-level integration)
I. CARDIAC EMBRYOLOGY
1. Timeline (know these day-numbers — MD vivas love them)
| Day | Event |
|---|---|
| Day 15-16 | Cardiogenic mesoderm forms in splanchnic mesoderm cranial to the oropharyngeal membrane; cardiogenic cords appear, canalize into endocardial tubes |
| Day 19-21 | Paired heart tubes fuse (lateral folding brings them to the midline) into a single primitive heart tube; cephalocaudal folding brings the heart into the thorax |
| Day 22 | Heart tube begins to beat; primitive circulation starts (earliest functioning organ in the embryo) |
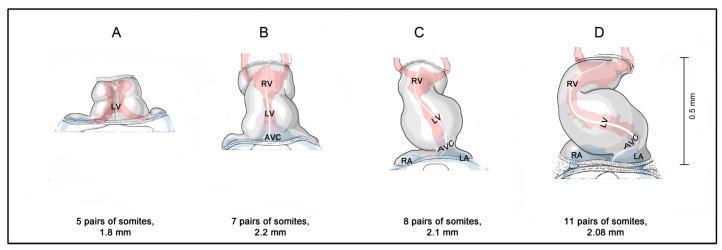
| Day 23 | Cardiac looping — the straight tube bends to the right (dextral looping, controlled by NODAL/PITX2 left-right asymmetry genes); this establishes the basic left-right orientation of the future chambers |
| Day 28-37 | Septation: atrial septum, interventricular septum, endocardial cushions, truncus/conus septation |
| Week 5-8 | Valve formation, coronary vessel development, maturation of conducting tissue |
| Primitive segment | Adult derivative |
|---|---|
| Truncus arteriosus | Ascending aorta + pulmonary trunk (after aorticopulmonary septation) |
| Bulbus cordis | Right ventricle outflow (conus) + parts of both ventricles |
| Primitive ventricle | Trabeculated part of left ventricle |
| Primitive atrium | Trabeculated parts of both atria (rough auricular walls) |
| Sinus venosus | Smooth part of RA, coronary sinus, part of the SVC/IVC junction — and gives rise to the SA node region |
2. Septation (the exam favourite — build the "why defects happen" logic here)
- Atrial septum: septum primum grows down from the roof of the common atrium toward the endocardial cushions, leaving the ostium primum, which closes as the cushions fuse — but before it fully closes, perforations form the ostium secundum. Then septum secundum grows to the right of septum primum, leaving the foramen ovale, covered on the left by the flap-like septum primum. This valve-like arrangement is why blood can flow right-to-left in fetal life but not left-to-right.
- Clinical link: failure of septum primum/secundum fusion after birth → patent foramen ovale (present in ~25% of adults, usually asymptomatic); excessive resorption of septum primum or maldevelopment of septum secundum → ostium secundum ASD (commonest ASD).
- Endocardial cushions (AV canal): fuse to divide the single AV canal into right and left AV orifices, contribute to the membranous interventricular septum, and close the ostium primum. Failure of fusion → ostium primum ASD / persistent AV canal (common in Down syndrome).
- Interventricular septum: muscular part grows up from the floor of the ventricle; the gap left above it (interventricular foramen) is closed by tissue derived from the endocardial cushions and the conal (truncoconal) ridges → membranous septum. This is the last part to close and the commonest site of VSD.
- Truncus arteriosus/conus septation: truncal and conal ridges spiral and fuse to form the aorticopulmonary septum, dividing the outflow into aorta and pulmonary trunk in a spiral fashion (this is why the great vessels normally twist around each other). Faulty spiraling/unequal division underlies Tetralogy of Fallot (unequal division shifting the aorta anteriorly/rightward over a VSD, with resultant pulmonary stenosis and RV hypertrophy) and transposition of the great arteries (straight, non-spiral septation).
- Semilunar valves: form from 3 swellings around the truncal orifice. AV valves (mitral, tricuspid): form from tissue around the AV canal, undermined and thinned to form leaflets and chordae tendineae, remaining tethered to papillary muscles.
3. Conducting system development
- SA node: from the right horn of the sinus venosus, ends up near the SVC-RA junction.
- AV node and bundle of His: from cells around the AV canal / left horn of the sinus venosus region.
- Purkinje network differentiates later from ordinary myocardium under the influence of endocardial signalling (endothelin pathway).
4. Fetal circulation and the changes at birth (always asked)
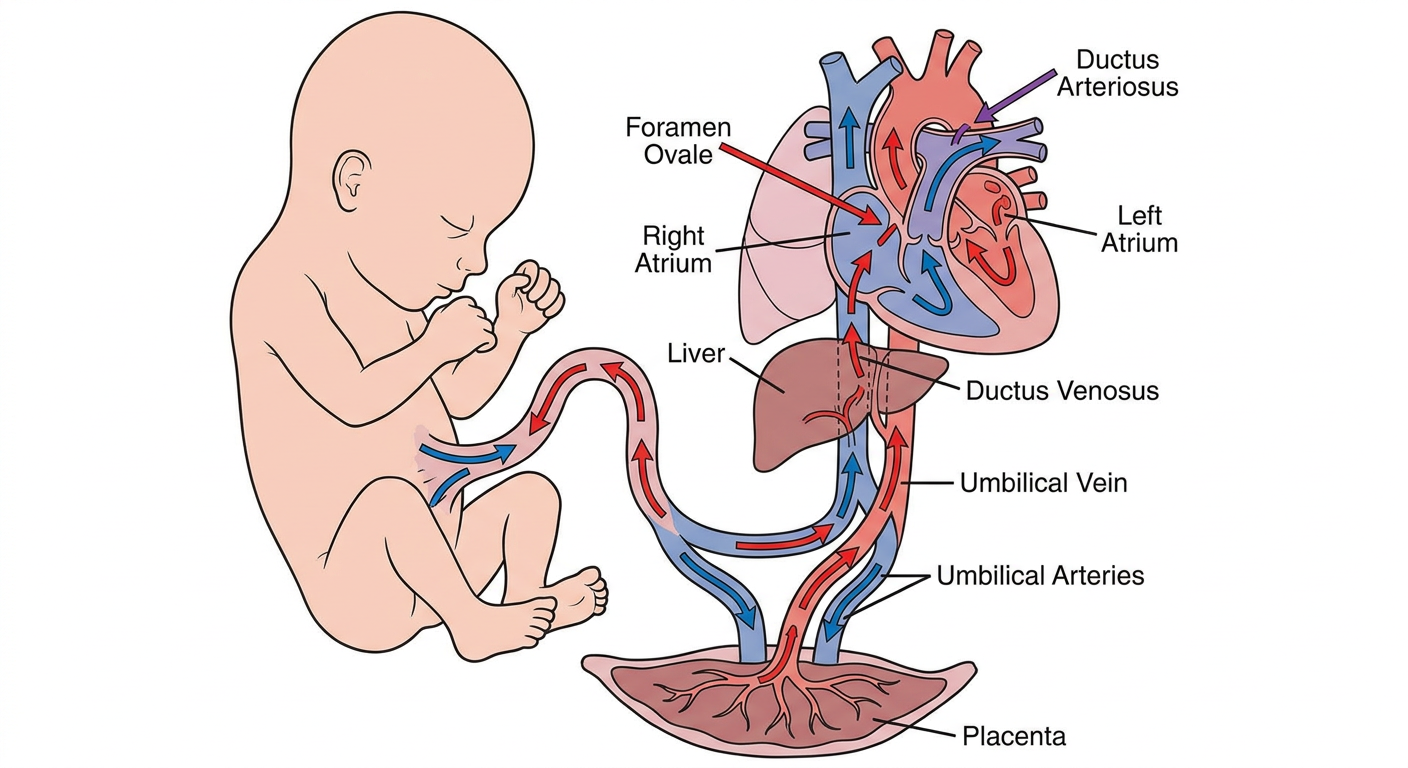
- Ductus venosus: umbilical vein → IVC, bypassing the liver sinusoids.
- Foramen ovale: IVC stream (highly oxygenated, from placenta) preferentially directed across into the LA → LV → head/upper body (streaming effect, "crista dividens").
- Ductus arteriosus: pulmonary trunk → descending aorta, bypassing the high-resistance fetal lungs; kept open in utero by prostaglandin E2/I2 and low fetal PaO2.
- First breath → lungs expand → pulmonary vascular resistance falls sharply → pulmonary blood flow increases.
- Placental circulation is cut off → systemic vascular resistance rises.
- LA pressure rises above RA pressure → foramen ovale flap closes functionally within minutes-hours, anatomically over weeks-months → becomes fossa ovalis.
- Rising PaO2 and falling prostaglandins → ductus arteriosus constricts and closes functionally within 10-15 hours, fibroses over weeks → becomes ligamentum arteriosum.
- Ductus venosus closes → ligamentum venosum; umbilical vein → ligamentum teres (round ligament of liver); umbilical arteries → medial umbilical ligaments.
II. GROSS / CLINICALLY-APPLIED ANATOMY
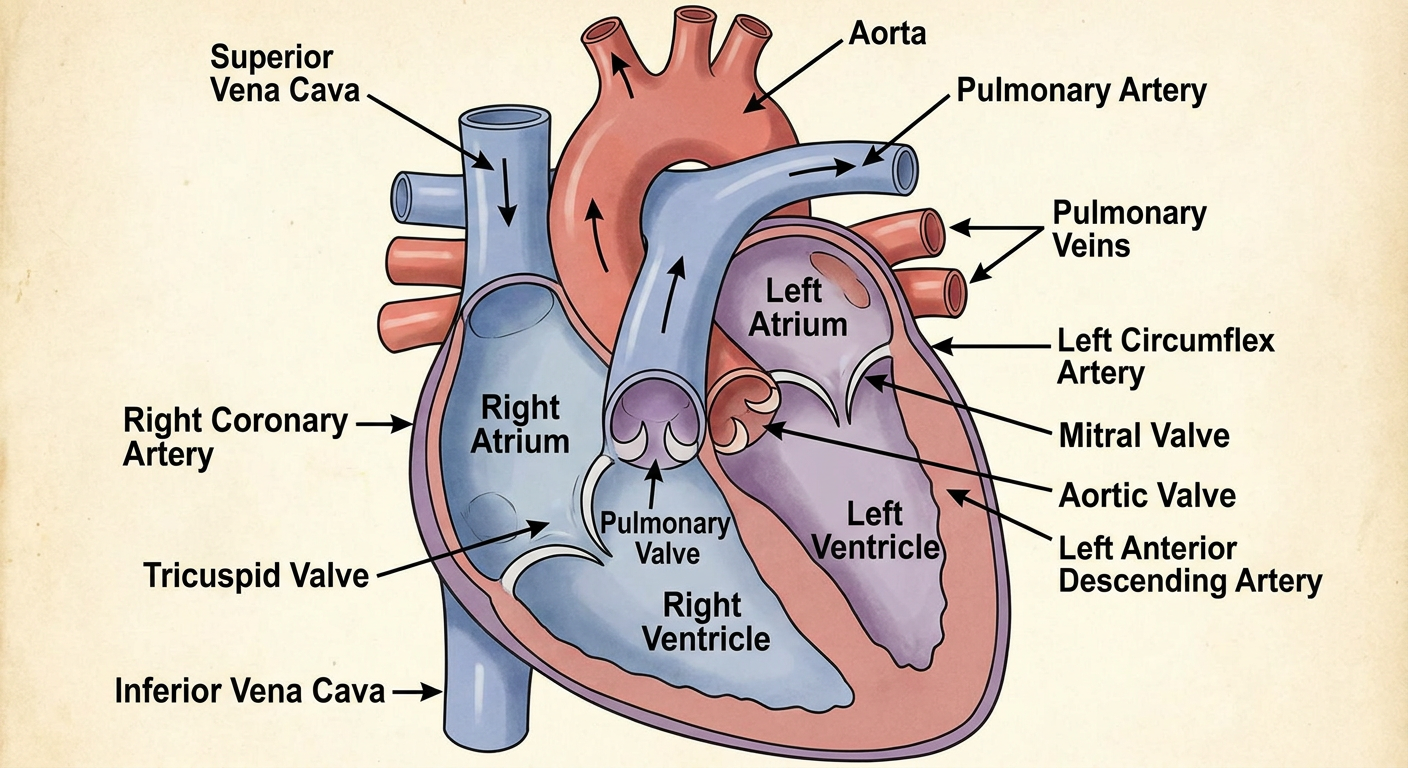
- Chambers: RA (smooth sinus venosus part + rough pectinate-muscle atrium proper, separated by the crista terminalis), RV (trabeculated, moderator band, conus/infundibulum leading to pulmonary valve), LA (smooth walled mostly, pectinate muscles confined to the auricle), LV (thicker wall, two papillary muscles, fine trabeculae carneae).
- Valves: Tricuspid (RA-RV, 3 cusps), Mitral (LA-LV, 2 cusps — anterior/aortic and posterior/mural), Pulmonary and Aortic (semilunar, 3 cusps each — aortic has coronary ostia in the right and left cusps).
- Fibrous skeleton of the heart: anchors the 4 valve rings, gives electrical insulation between atria and ventricles except through the AV node/bundle — clinically relevant for accessory pathway syndromes (e.g. WPW bypasses this insulation).
- Coronary circulation:
- Right coronary artery (RCA): SA node artery (~60%), AV node artery (~80-90%, "right dominant" pattern), posterior descending artery (PDA) in right-dominant circulation, supplies RV, inferior LV, posterior 1/3 septum.
- Left coronary artery → LAD (anterior 2/3 septum, anterior LV, apex) and LCx (lateral/posterior LV, may supply SA node in ~40%).
- Venous drainage mainly via the coronary sinus (in the AV groove, receives great/middle/small cardiac veins) into the RA; small anterior cardiac veins drain directly into RA.
- Pericardium: fibrous pericardium (protective, limits acute distension) + serous pericardium (parietal + visceral/epicardial layers, pericardial cavity between them, ~30-50 mL fluid normally).
III. THE CONDUCTING SYSTEM
| Structure | Location | Intrinsic rate | Notes |
|---|---|---|---|
| SA node | Junction of SVC and RA (sinus venosus derivative) | ~60-100/min | Normal pacemaker; rich sympathetic + vagal supply |
| AV node | Floor of RA, near coronary sinus opening (Koch's triangle) | ~40-60/min | Delays impulse ~0.1 s → allows atrial emptying before ventricular contraction; site of physiological "decremental" conduction |
| Bundle of His | Penetrates the fibrous (central) body | — | Only muscular connection between atria and ventricles normally |
| Bundle branches (R & L) | Interventricular septum | — | Left bundle branch itself trifascicular (anterior, posterior, septal fascicles in most classifications) |
| Purkinje fibers | Subendocardial, ventricular walls | ~20-40/min | Fastest conduction velocity of the system, ensures near-simultaneous ventricular activation |
IV. CARDIAC PHYSIOLOGY — THE CARDIAC CYCLE
1. Definition and phases (HR 75/min → cycle length ≈ 0.8 s)
- Atrial systole (~0.1 s) — atrial contraction tops up ventricular filling (the "atrial kick," contributes ~15-25% of ventricular filling at rest, much more with exercise or in a stiff/non-compliant ventricle).
- Isovolumetric ventricular contraction — mitral/tricuspid valves close (→ S1), ventricular pressure rises steeply, all valves shut, volume constant.
- Rapid ejection — aortic/pulmonary valves open once ventricular pressure exceeds aortic/pulmonary diastolic pressure; most stroke volume ejected here.
- Reduced ejection — ejection continues but slower as ventricular pressure starts to fall.
- Isovolumetric relaxation — semilunar valves close (→ S2), ventricular pressure falls rapidly, volume constant (all four valves shut).
- Rapid filling — AV valves open once atrial pressure exceeds ventricular pressure; most of ventricular filling happens here.
- Diastasis (reduced/slow filling) — flow slows as pressures nearly equalize; shortest with tachycardia (why fast heart rates compromise filling and coronary perfusion).
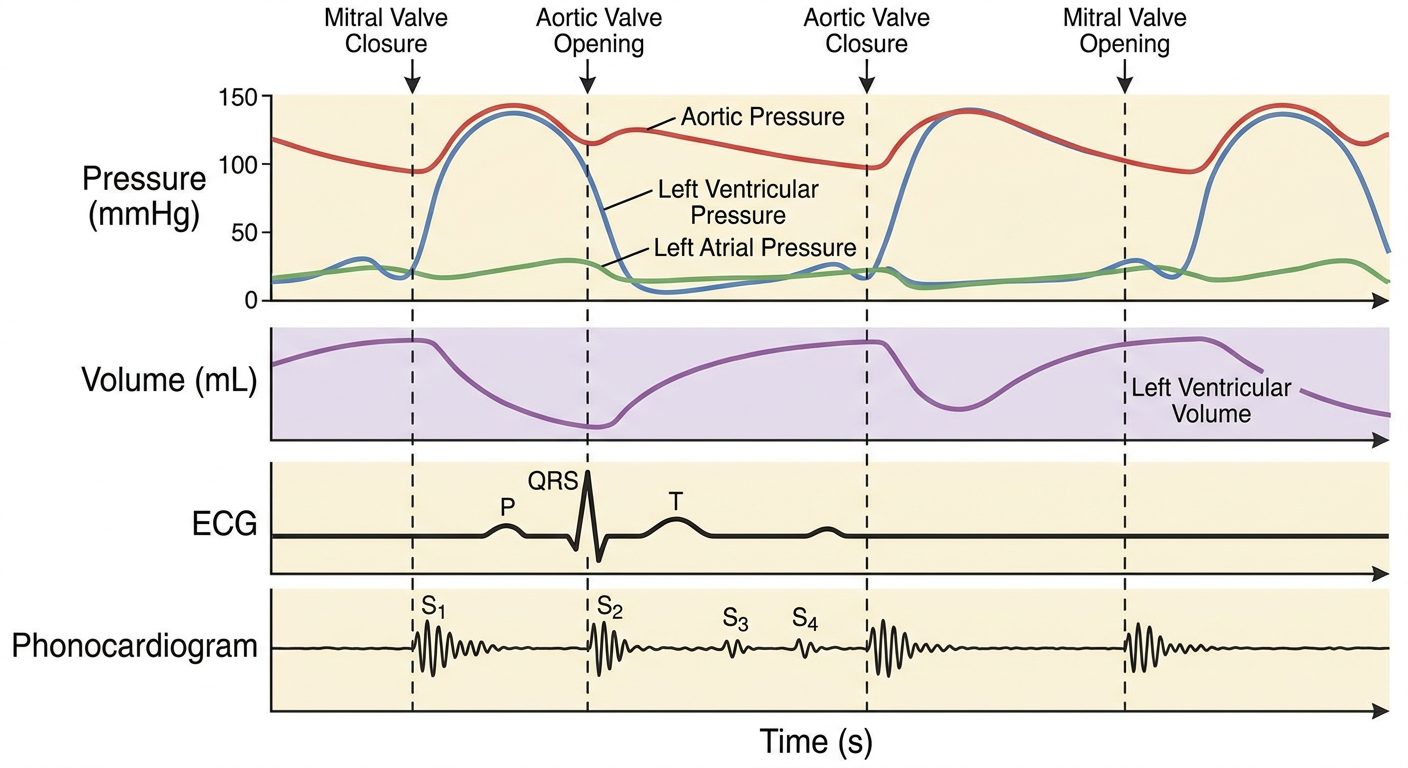
- LV pressure, aortic pressure, LA pressure, LV volume, ECG, and heart sounds are all plotted against the same time axis.
- Aortic valve opens when LV pressure > aortic diastolic pressure; closes at the dicrotic notch (a small pressure blip from valve closure and elastic recoil of the aorta).
- Mitral valve opens when LA pressure > LV pressure (early diastole).
2. Heart sounds
- S1 — closure of mitral + tricuspid valves, start of systole.
- S2 — closure of aortic + pulmonary valves, start of diastole; normal physiological splitting widens on inspiration (increased venous return delays pulmonary closure).
- S3 — rapid ventricular filling sound; normal in children/young adults, pathological in adults = volume overload (heart failure, mitral regurgitation).
- S4 — atrial contraction against a stiff/non-compliant ventricle; always pathological in adults (LVH, hypertension, ischemia, HFpEF).
3. Preload, afterload, contractility
| Determinant | Definition | Main physiological measure | Key modifiers |
|---|---|---|---|
| Preload | Ventricular wall stress/stretch at end-diastole | LV end-diastolic volume/pressure | Venous return, blood volume, atrial contraction, venous tone |
| Afterload | Resistance the ventricle must overcome to eject | Aortic pressure / systemic vascular resistance (wall stress, per Laplace's law) | SVR, aortic valve disease, vessel compliance |
| Contractility | Intrinsic force of contraction independent of preload/afterload | Ejection fraction, dP/dt max | Sympathetic stimulation (+), catecholamines (+), ischemia (-), negative inotropes (-) |
4. Stroke volume, cardiac output, ejection fraction
- Stroke volume (SV) = EDV - ESV (normal ~70 mL)
- Cardiac output (CO) = SV × HR (normal ~5 L/min at rest)
- Ejection fraction (EF) = SV/EDV × 100 (normal ≥55%) — the key number distinguishing HFrEF from HFpEF later in the course.
- Cardiac index = CO/body surface area (normal ~2.6-4.2 L/min/m²), used clinically to normalize for body size.
5. Fetal vs adult cardiac cycle — the key differences
- Fetal circulation is a parallel circuit (both ventricles pump into the systemic circulation via the shunts) vs the adult series (in-line, lung-dependent) circuit.
- Fetal RV output actually exceeds LV output (RV is the dominant ventricle in utero, ejecting mostly across the ductus arteriosus into the descending aorta), because pulmonary vascular resistance is very high (lungs are fluid-filled/unexpanded) — this reverses completely at birth once the lungs expand and PVR falls.
- Fetal heart rate is higher (~110-160 bpm) and relies more on rate than stroke volume/contractility for changes in output, because immature myocardium has less compliant, less organized sarcomeres.
6. Basic blood pressure regulation (brief foundation — expanded on hypertension day)
- Short-term: baroreceptor reflex (carotid sinus/aortic arch → NTS → autonomic outflow), seconds-to-minutes.
- Intermediate: capillary fluid shift, stress-relaxation of vessel walls, renin-angiotensin activation.
- Long-term: renal pressure-natriuresis and the renin-angiotensin-aldosterone system — the dominant long-term controller of arterial pressure.
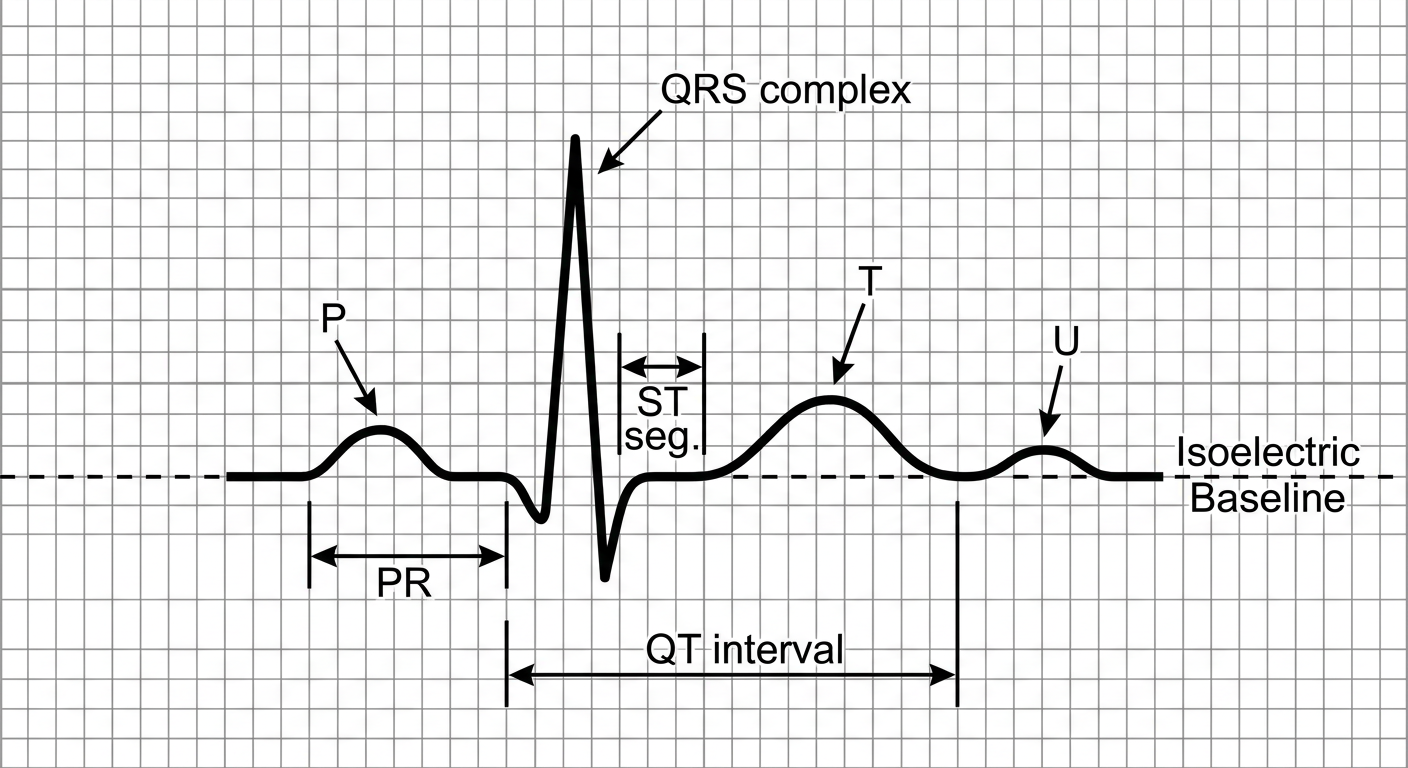
V. ECG FOUNDATIONS (normal ECG only — arrhythmia recognition comes Day 3)
| Wave/Interval | Represents | Normal duration/value |
|---|---|---|
| P wave | Atrial depolarization | <0.12 s, <2.5 mm amplitude |
| PR interval | Atrial depolarization + AV nodal delay | 0.12-0.20 s |
| QRS complex | Ventricular depolarization | <0.10-0.12 s |
| ST segment | Ventricular plateau (fully depolarized, isoelectric) | Isoelectric, baseline |
| T wave | Ventricular repolarization | Upright in most leads |
| QT interval | Total ventricular depolarization + repolarization | Corrected (QTc) ~<0.44 s men, <0.46 s women |
| U wave | Papillary muscle/Purkinje repolarization (variable) | Small, often absent |
Today's Output Tasks (from your plan — do these before moving on)
- Draw the heart + conducting system from memory (label SA node, AV node, bundle of His, bundle branches, Purkinje fibers, and blood supply to each).
- Write a one-page cardiac-cycle flowchart with the Wiggers diagram correlation (pressure/volume/ECG/heart sounds together).
- Calculate: if EDV = 120 mL, ESV = 50 mL, HR = 72/min — find SV, EF, and CO.
Checkpoint Questions (answer these and I'll correct/expand)
- Why is the membranous interventricular septum the commonest site for a VSD?
- Trace the direction of blood flow through all three fetal shunts, and state what closes each one and what it becomes anatomically after birth.
- What causes S3 to be pathological in an adult but physiological in a child?
- If sympathetic stimulation increases contractility, what happens to the Frank-Starling curve, and what happens to ESV at a fixed afterload?
- Which coronary artery occlusion would most directly threaten the AV node, and what conduction abnormality would you expect on ECG?
CAN U HELP TO UNDERSTAND EVERYTHING WITH APPROPRIATE DIAGRAM
fetal circulation diagram ductus venosus foramen ovale ductus arteriosus umbilical vessels
heart chambers valves coronary arteries anatomy labeled diagram
Wiggers diagram cardiac cycle pressure volume ECG heart sounds
normal ECG waves PQRST labeled intervals diagram
cardiac conduction system SA node AV node bundle of His Purkinje fibers heart
A clear medical textbook diagram of fetal circulation showing the heart, lungs, liver, umbilical cord and placenta, with labeled arrows for the ductus venosus, foramen ovale, ductus arteriosus, umbilical vein and umbilical arteries, showing direction of blood flow and oxygenated vs deoxygenated blood in different colors
A labeled anatomical diagram of the human heart in cross-section showing all four chambers (right atrium, right ventricle, left atrium, left ventricle), the tricuspid, mitral, pulmonary and aortic valves, the great vessels (aorta, pulmonary artery, pulmonary veins, superior and inferior vena cava), and the coronary arteries (left anterior descending, left circumflex, right coronary artery) on the external surface
A labeled diagram of the cardiac conduction system inside a heart outline, showing the SA node at the junction of superior vena cava and right atrium, the AV node near the coronary sinus, the bundle of His penetrating the interventricular septum, the left and right bundle branches, and the Purkinje fibers spreading through the ventricular walls, with arrows showing the path of electrical conduction
A Wiggers diagram for medical students showing stacked aligned graphs against a shared time axis: aortic pressure, left ventricular pressure, left atrial pressure curves in one panel, left ventricular volume curve in a second panel, an ECG trace with P QRS T waves in a third panel, and a phonocardiogram showing S1 S2 S3 S4 heart sounds in a fourth panel, with vertical dashed lines marking mitral valve closure, aortic valve opening, aortic valve closure, and mitral valve opening across all panels
A clear labeled diagram of a single normal ECG waveform on ECG graph paper, labeling the P wave, PR interval, QRS complex, ST segment, T wave, U wave and QT interval, with the isoelectric baseline marked
1. Cardiac Looping (Day 21-23 embryo) — authentic embryology figure
2. Fetal Circulation — the three shunts
3. Heart Anatomy — chambers, valves, coronary arteries
4. Conduction System — the electrical pathway
5. Wiggers Diagram — the master diagram of the cardiac cycle
6. Normal ECG waveform
Uh, I'm answering the, uh, checkpoint question one, that, uh, if a AV node or, uh, its bundle region is affected in the inferior MI, the whole conduction system down the part of that region is being blocked. So, uh, it is wholly blocked in the, uh, if there is a damage to AV nodes or its bundle region. But if the SA node is dysfunction, so there might be a slight delay or blockage from the SA node, but, uh, AV no- node is still working, so it helps in conduction, not a complete block.
The actual concept: hierarchy of automaticity + anatomical pathway
| Pacemaker | Intrinsic rate |
|---|---|
| SA node | 60-100/min (fastest → normally suppresses everyone else) |
| AV node/junctional tissue | 40-60/min |
| Purkinje/ventricular tissue | 20-40/min |
The answer to the question, that is, why fast heart rate compromises healing and coronary perfusion, because the heart is not getting a sufficient time in to fill, uh...
Why tachycardia compromises both ventricular filling AND coronary perfusion
- Total time available for coronary flow per minute goes down, even though heart rate (and therefore total myocardial oxygen demand) goes up.
- You get a mismatch: increased O2 demand + decreased time for O2 supply - which is precisely why tachycardia provokes or worsens angina in someone with coronary artery disease, and why it's dangerous in critical aortic stenosis or severe LV hypertrophy (both already have compromised subendocardial perfusion at baseline).
- Beta-blockers are first-line anti-anginal therapy: slowing the heart rate lengthens diastole, giving more time for coronary filling, on top of reducing myocardial O2 demand.
- Tachycardia in a patient with critical coronary stenosis can itself precipitate ischemia even without any change in the stenosis - "supply-demand mismatch" purely from rate.
Move to Day 2: Cardinal Manifestations (chest pain, palpitations, dyspnea, edema, cyanosis, syncope) BUT IN DEPTH
jugular venous pulse waveform a c v wave diagram
clubbing of fingers central cyanosis clinical photo
heart auscultation areas mitral tricuspid pulmonary aortic area chest diagram
pitting edema lower limb clinical photo
jugular venous pressure waveform diagram a wave c wave v wave x descent y descent
clubbing fingers nail
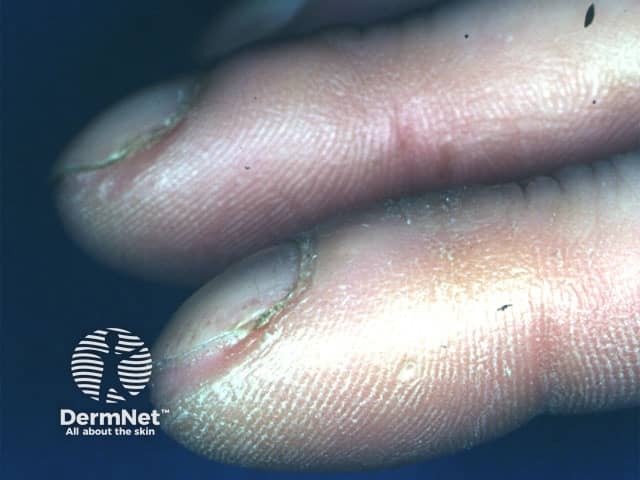
Clinical photograph of the distal digits demonstrating digital clubbing. Modality: Clinical photography; technique: macro close‑up digital image with bright‑field illumination and high resolution to emphasize nail bed morphology. Anatomical location: fingers (distal phalanges) with visible nail plates, nail beds, and periungual tissue; dorsal view highlighting the nail–bed interface. Visual features: bulbous, expanded distal digits; nail plates show increased curvature with convex nail beds; reduced angle between the nail plate and the adjacent skin; glossy, smooth periungual skin; absence of cutaneous ulcers in view; subtle subungual fullness may be present. Pathologic/clinical findings: clubbing is a clinical sign characterized by hyperplastic nail bed change; not a histologic lesion, but correlates with chronic hypoxia and systemic disease. Diagnostic significance: digital clubbing signals potential underlying cardiopulmonary pathology or hepatobiliary disease; commonly associated conditions include interstitial lung disease (idiopathic pulmonary fibrosis, bronchiectasis), chronic obstructive pulmonary disease, cyanotic heart disease, liver cirrhosis, and inflammatory bowel disease; warrants systemic workup. Differential considerations: idiopathic clubbing; secondary clubbing from pulmonary/vascular disease or congenital heart disease; alternatively pseudoclubbing from nail dystrophy. Clinical correlation: correlate with oxygen saturation, chest imaging, echocardiography, hepatic panel; multidisciplinary assessment recommended. Documented progression can guide treatment decisions and patient counseling in dermatology, pulmonology, and internal medicine.
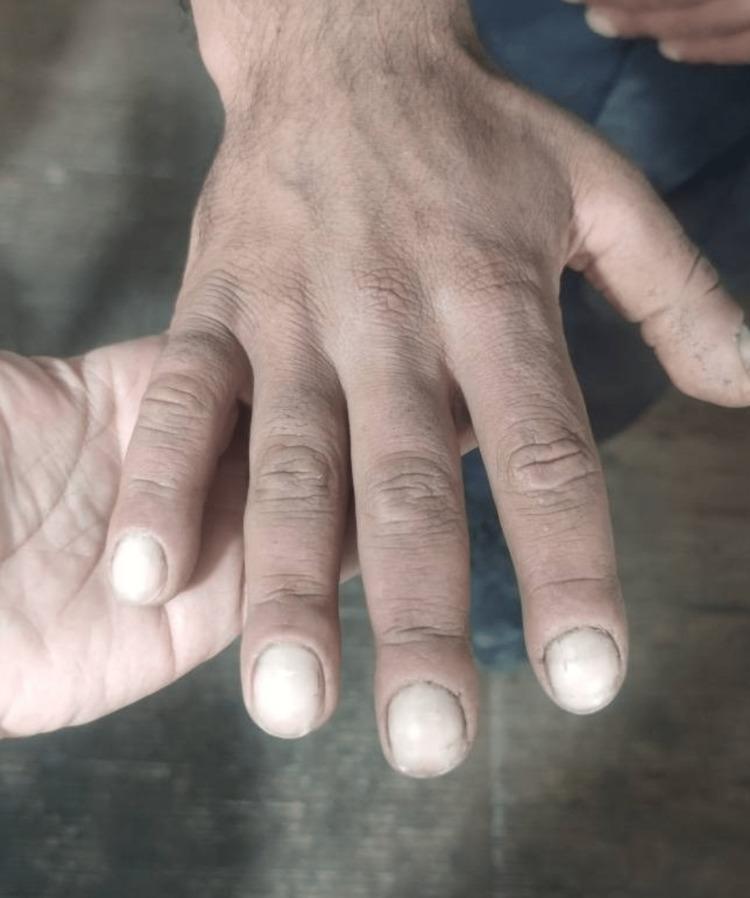
Clinical photograph of a patient's dorsal hand and fingers demonstrating digital clubbing (Hippocratic fingers). The fingernails exhibit a characteristic bulbous enlargement of the distal phalanges, with an increased longitudinal and transverse curvature of the nail plates, giving them a convex, 'watch-glass' appearance. There is an apparent loss of the normal Lovibond angle (the angle between the nail plate and the proximal nail fold). The fingers appear thickened and blunt-tipped. The skin over the hand and knuckles shows prominent creasing and a thickened texture, consistent with pachydermoperiostosis or acromegaly-related changes. This visual finding is a significant clinical sign often associated with chronic hypoxia, pulmonary diseases, cardiovascular conditions, or primary hypertrophic osteoarthropathy.
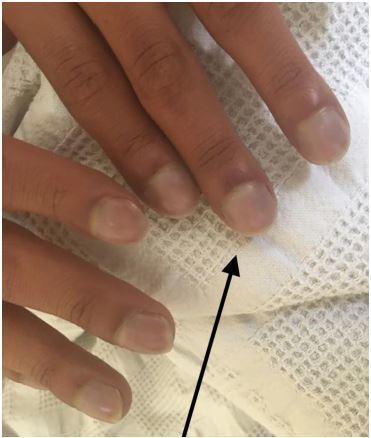
This clinical photograph shows a close-up of a patient's fingers demonstrating classic signs of digital clubbing and peripheral cyanosis. The distal phalanges exhibit a bulbous, 'drumstick' appearance with a noticeable loss of the normal Lovibond angle (the angle between the nail plate and the proximal nail fold). The nail beds appear convex and rounded. A distinct bluish-purple discoloration (cyanosis) is visible across the nail beds and distal fingertips, indicating poor blood oxygenation or circulation. A black arrow points to the most prominent area of clubbing on the index finger. These findings are clinically significant as they often indicate chronic hypoxemia secondary to congenital heart disease (such as Ebstein anomaly), pulmonary disease, or chronic inflammatory conditions. This image serves as a teaching tool for physical examination findings in cardiovascular and respiratory medicine.
pitting oedema leg pressing skin
pulse waveforms collapsing water hammer pulse pulsus alternans anacrotic
A medical diagram of the normal jugular venous pulse waveform showing a wave, c wave, v wave, x descent and y descent plotted against time, aligned above a simultaneous ECG trace with P QRS T waves, clearly labeled
A medical education diagram comparing five arterial pulse waveform tracings side by side, each labeled: normal pulse, collapsing (water-hammer) pulse of aortic regurgitation, anacrotic pulse of aortic stenosis with slow upstroke, pulsus alternans with alternating tall and short beats, and pulsus paradoxus showing a drop in amplitude during inspiration, each plotted as pressure against time
A diagram of the front of a human chest showing the four cardiac auscultation areas marked with labeled circles: aortic area at the right 2nd intercostal space, pulmonary area at the left 2nd intercostal space, tricuspid area at the left lower sternal border, and mitral area at the left 5th intercostal space midclavicular line (apex)
Day 2 — Cardinal Manifestations of CVS Disease + Complete Clinical Examination (In Depth)
I. CHEST PAIN
Mechanism
History framework (SOCRATES)
Differential diagnosis — organize by system, always in a viva
| Category | Causes | Distinguishing features |
|---|---|---|
| Cardiac - ischemic | Stable angina, unstable angina, NSTEMI/STEMI | Exertional, crushing/heavy, relieved by rest/nitrates (stable); rest pain, >20 min (ACS); associated sweating, nausea, breathlessness |
| Cardiac - non-ischemic | Acute pericarditis, aortic dissection | Pericarditis: sharp, pleuritic, relieved sitting forward, friction rub. Dissection: sudden, tearing, radiates to back, unequal pulses/BP |
| Pulmonary | PE, pneumothorax, pneumonia, pleurisy | Pleuritic (worse on inspiration), dyspnoea, hemoptysis (PE), sudden onset with breathlessness (pneumothorax) |
| GI | GERD, esophageal spasm, peptic ulcer, biliary colic | Burning, related to meals/lying down, relieved by antacids |
| Musculoskeletal | Costochondritis, Tietze syndrome, muscle strain | Reproducible on palpation, worse with movement |
| Psychogenic | Anxiety/panic disorder | Diagnosis of exclusion, associated hyperventilation, paresthesias |
II. PALPITATIONS
Definition and mechanism
Differential diagnosis
| Category | Causes |
|---|---|
| Cardiac - ectopic/arrhythmic | Premature atrial/ventricular contractions ("skipped beat" sensation), atrial fibrillation, SVT/AVNRT ("sudden pounding, terminates suddenly"), VT, sinus tachycardia |
| Endocrine/metabolic | Thyrotoxicosis, hypoglycemia, pheochromocytoma, menopause |
| Physiological/toxic | Anxiety, exercise, caffeine, alcohol, nicotine, sympathomimetic drugs |
| Other | Anemia, fever, pregnancy |
III. DYSPNOEA (BREATHLESSNESS)
Mechanism
Key patterns to distinguish (high-yield)
- Exertional dyspnoea: earliest symptom of LV dysfunction, graded by NYHA Class I-IV (I = no limitation; II = slight limitation, dyspnoea on ordinary activity; III = marked limitation, dyspnoea on less-than-ordinary activity; IV = dyspnoea at rest).
- Orthopnoea: breathlessness lying flat, relieved by sitting/propping up with pillows (quantify as "2-pillow" or "3-pillow" orthopnoea). Mechanism: supine posture redistributes fluid from the legs/splanchnic bed back into central circulation, raising venous return and pulmonary capillary pressure in an already failing LV.
- Paroxysmal nocturnal dyspnoea (PND): sudden waking from sleep, gasping for air, relieved by sitting up/standing. Mechanism: same fluid redistribution plus blunted nocturnal respiratory centre responsiveness and reduced sympathetic tone supporting the LV overnight.
- Platypnoea: breathlessness on sitting up, relieved lying down (rare — think platypnoea-orthodeoxia syndrome, right-to-left shunting).
Differential diagnosis
IV. OEDEMA
Mechanism — Starling forces
Cardiac oedema characteristics
Differential diagnosis
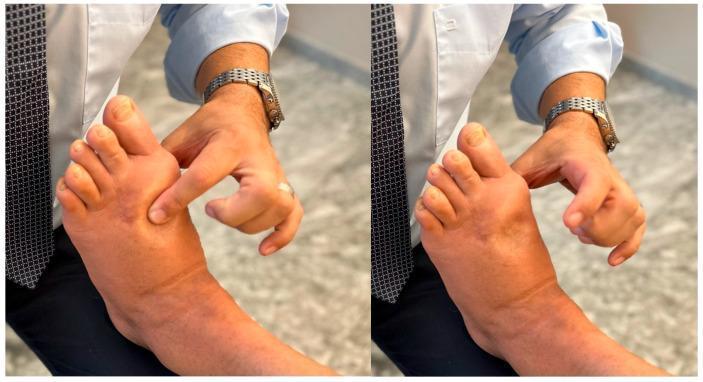
V. CYANOSIS
Definition
| Feature | Central cyanosis | Peripheral cyanosis |
|---|---|---|
| Site | Tongue, lips, mucous membranes (+ periphery) | Nail beds, fingertips, nose, ears only (mucosa spared) |
| Extremity temperature | Warm | Cold |
| Mechanism | Reduced arterial O2 saturation | Normal saturation, but increased peripheral O2 extraction due to slow flow/vasoconstriction |
| Causes | Right-to-left cardiac shunt (TOF, Eisenmenger syndrome), severe lung disease impairing gas exchange, high altitude | Cold exposure, shock/low cardiac output, peripheral vascular disease, heart failure |
VI. PRE-SYNCOPE AND SYNCOPE
Definition
Classification (this structure is exactly how it's tested)
- Vasovagal (emotional stress, prolonged standing, pain)
- Situational (cough, micturition, defecation)
- Carotid sinus syncope
- Volume depletion (dehydration, hemorrhage)
- Autonomic failure (diabetic autonomic neuropathy, Parkinson's, drugs)
- Drug-induced (antihypertensives, diuretics)
- Arrhythmic: bradyarrhythmias (complete heart block, sick sinus syndrome), tachyarrhythmias (VT, SVT with rapid rate)
- Structural/obstructive: severe aortic stenosis, HOCM, massive PE, cardiac tamponade, aortic dissection, atrial myxoma
Red flags suggesting cardiac syncope (must elicit in every history)
VII. COMPLETE CVS CLINICAL EXAMINATION
1. General inspection
2. Pulse examination
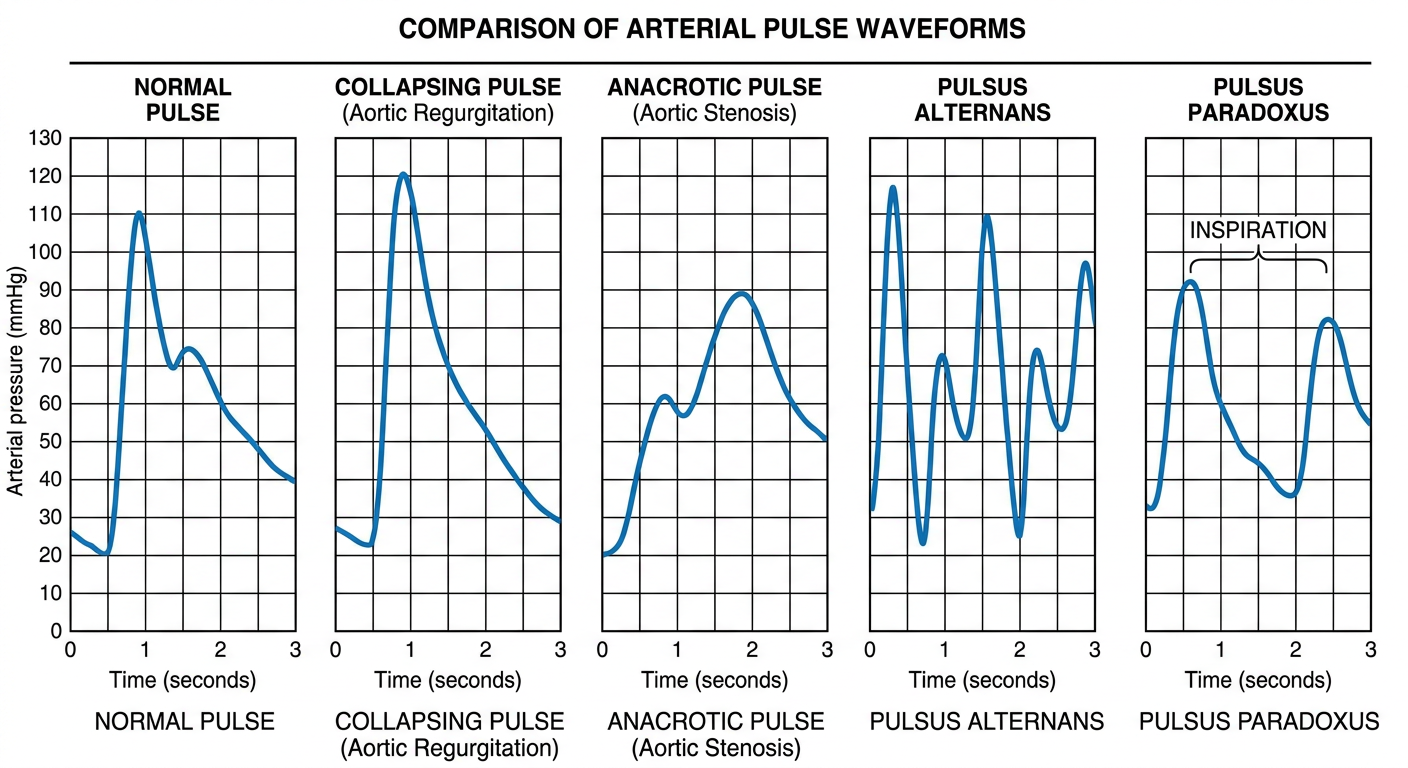
- Collapsing (water-hammer) pulse: rapid rise and fall — aortic regurgitation, PDA
- Anacrotic pulse: slow rising, notched upstroke — severe aortic stenosis
- Pulsus alternans: alternating strong/weak beats with regular rhythm — severe LV systolic failure
- Pulsus paradoxus: exaggerated fall (>10 mmHg) in systolic BP on inspiration — cardiac tamponade, severe asthma/COPD
- Pulsus bisferiens: double-peaked systolic pulse — combined AS + AR, or HOCM
3. Blood pressure
4. Jugular venous pressure (JVP) — one of the highest-yield bedside skills
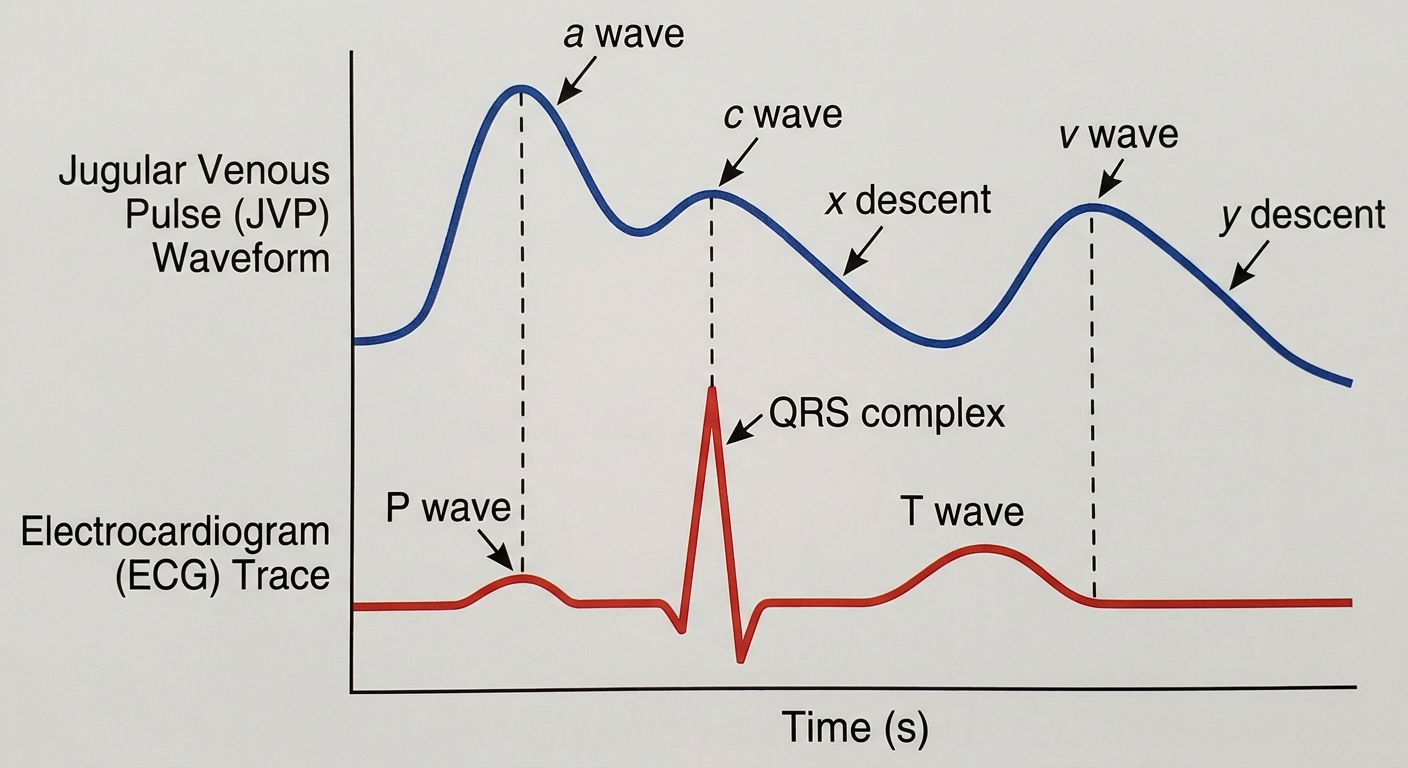
- a wave: atrial contraction — absent in AF, large ("giant") a wave in tricuspid stenosis or pulmonary hypertension, cannon a waves (irregular, very tall) when atria contract against a closed tricuspid valve in complete heart block or AV dissociation.
- c wave: closure of tricuspid valve (small, often not visible clinically).
- x descent: atrial relaxation.
- v wave: passive atrial filling against closed tricuspid — large "v" wave in tricuspid regurgitation.
- y descent: tricuspid valve opening, rapid ventricular filling — sharp/deep in constrictive pericarditis (Friedreich's sign), slow in tricuspid stenosis.
5. Precordium
- Apex beat — location (normally 5th ICS, midclavicular line) and character:
- Tapping — mitral stenosis (palpable S1)
- Heaving/sustained (pressure overload) — aortic stenosis, hypertension, HOCM
- Thrusting/hyperdynamic (volume overload) — mitral regurgitation, aortic regurgitation, VSD
- Diffuse and displaced — dilated cardiomyopathy
- Double apical impulse — HOCM
- Left parasternal heave — RV hypertrophy (pulmonary hypertension, mitral stenosis, ASD)
- Thrills — palpable murmurs (grade ≥4/6)
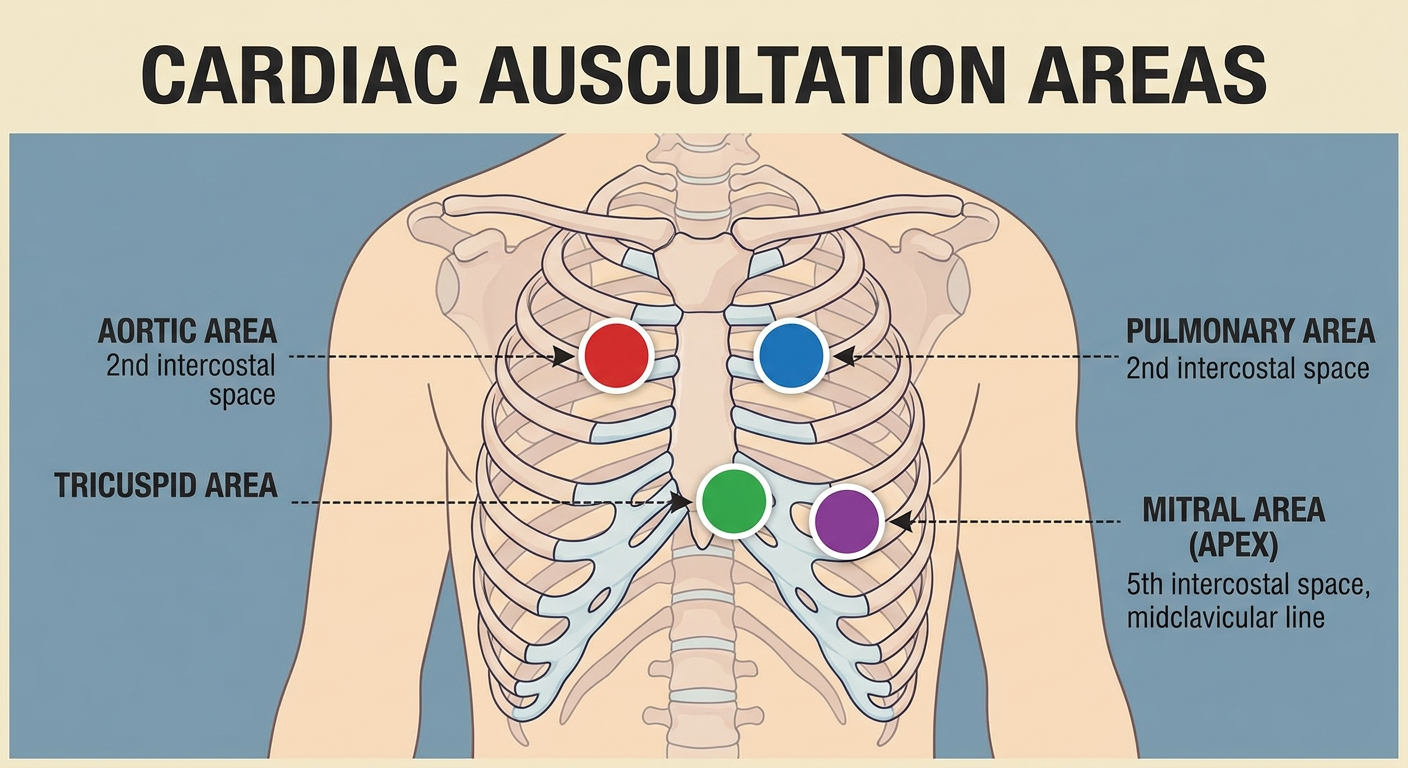
- S1/S2: intensity (loud S1 in MS/tachycardia; soft S1 in MR/long PR interval; loud P2 in pulmonary hypertension), splitting (physiological splitting of S2 widens on inspiration; fixed splitting in ASD; reversed/paradoxical splitting in LBBB or severe AS).
- Extra sounds: S3 (volume overload/systolic failure), S4 (pressure overload/stiff ventricle — see Day 1), opening snap (mitral stenosis, follows S2), ejection click (bicuspid aortic valve, pulmonary stenosis).
- Murmurs: timing (systolic vs diastolic), shape (crescendo-decrescendo = ejection systolic in AS; pansystolic = MR/VSD/TR; early diastolic decrescendo = AR/PR; mid-diastolic rumble = MS/TS), pitch, site of maximum intensity, radiation (AS radiates to carotids; MR radiates to axilla), grade (I-VI Levine scale).
- Dynamic maneuvers: squatting/handgrip increase MR and VSD murmur intensity (increase afterload); standing/Valsalva increase HOCM murmur (decrease preload) but decrease AS murmur — this maneuver differentiates HOCM from AS, a favorite viva discriminator.
6. Complete the examination
Output Tasks (per your plan)
- Perform one complete CVS examination aloud, as if presenting a long case, in the correct sequence: general inspection → hands/pulse → face → JVP → precordium (inspection, palpation, auscultation) → back/lungs → abdomen → legs.
- Build a checklist distinguishing normal vs abnormal findings at each step.
- Write differential diagnosis lists for all six cardinal symptoms from memory, without looking back.
Checkpoint Questions
- A patient has a raised JVP with a prominent "y descent" and Kussmaul's sign. What's your top diagnosis, and why does inspiration paradoxically raise JVP here?
- Why does orthopnoea occur specifically on lying flat, and why is PND worse at night compared to daytime exertional dyspnoea?
- Differentiate cardiac syncope from vasovagal syncope using three history features and explain the physiological reason cardiac syncope is more dangerous.
- A patient has clubbing, central cyanosis, and pink upper limbs but blue lower limbs. What's the diagnosis and underlying shunt physiology?
- On examination, standing up from squatting makes a systolic murmur louder. What valve lesion does this suggest, and why does the maneuver have this effect?