
Numerical abbreviation of chromosomes
human chromosome numerical abbreviation nomenclature ISCN
https://www.coriell.org/0/Sections/Support/Global/iscn_help.…
human karyotype chromosomes numbered 1-22 X Y ideogram
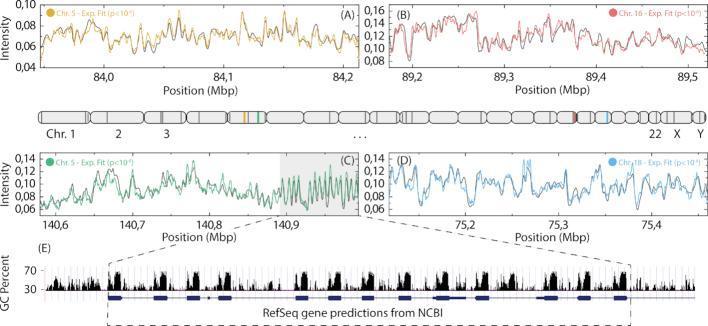
This scientific figure illustrates the mapping of experimental optical DNA barcodes to the human genome using a competitive binding assay. The central element is a schematic ideogram of the human karyotype (Chr 1-22, X, Y), showing the genomic distribution of mapped molecules. Panels A-D provide high-resolution intensity plots for specific segments on Chromosomes 5, 16, and 18. Each plot displays experimental intensity data (colored lines: yellow, red, green, blue) overlaid with theoretical fits (grey lines) across genomic positions measured in megabase pairs (Mbp). The y-axis represents signal intensity, where variations reflect sequence-specific binding patterns of YOYO-1 and netropsin. Panel C contains a shaded grey region indicating a highly repetitive sequence, which is further analyzed in Panel E. Panel E demonstrates the clinical and genomic relevance by correlating these intensity patterns with RefSeq gene predictions (blue bars) and local GC content percentage (black peaks). The data highlights the utility of optical DNA mapping (ODM) in identifying large-scale genomic structures, repetitive regions like the Protocadherin Alpha gene cluster, and potential structural variations that may be missed by traditional sequencing.
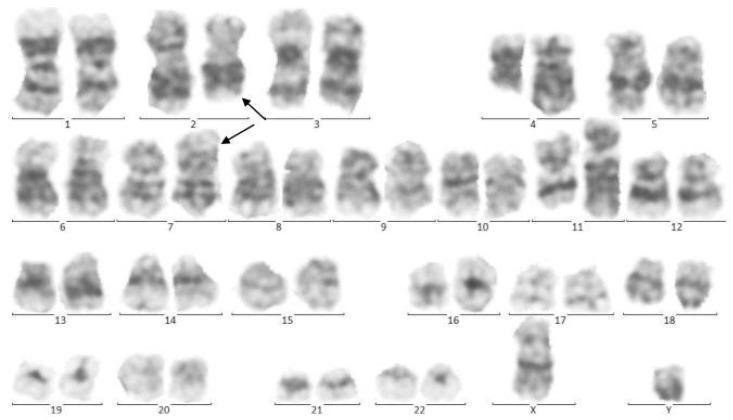
This diagnostic image shows a human G-banded karyotype (Giemsa staining) of a male (46,XY) in metaphase. The chromosomes are organized into 22 numbered pairs of autosomes and one pair of sex chromosomes (X and Y). The staining demonstrates characteristic light and dark banding patterns used for structural analysis. Specific arrows point to structural abnormalities on one homologue of chromosome 2 and chromosome 7, indicating a reciprocal translocation. Clinical context indicates these findings represent a clonal evolution in a pediatric patient with Pro-B-cell Acute Lymphoblastic Leukemia (pro-B-ALL). In addition to the visible 2;7 translocation, the karyotype is associated with a diagnostic t(4;11)(q21;q23) translocation, which is a common cytogenetic hallmark in high-risk infant leukemia involving the KMT2A (MLL) gene. This educational visual demonstrates how cytogenetic analysis identifies specific chromosomal rearrangements essential for hematologic malignancy diagnosis, risk stratification, and treatment planning.
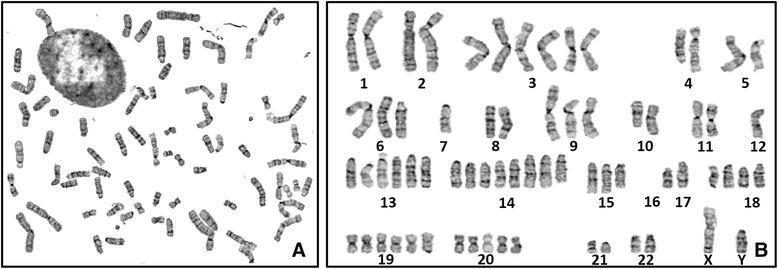
This diagnostic image displays a G-banded karyotype analysis of the SHG139 human glioma cell line, presented in two panels. Panel A shows a metaphase spread with chromosomes dispersed randomly across the field, alongside a speckled interphase nucleus. The chromosomes exhibit characteristic dark and light banding patterns used for identification. Panel B presents the organized karyotype, with chromosomes arranged and numbered from 1 to 22, plus sex chromosomes (X, Y). The karyotype demonstrates significant numerical abnormalities (aneuploidy) and structural variations typical of malignant glioma cells. Notable findings include a complex polyploid state with varying copy numbers: monosomy of chromosomes 7, 12, X, and Y; disomy of 1, 2, 4, 5, 8, 10, 11, 17, 21, and 22; and high-level gains (polysomy) of others, specifically six copies of 3, 13, and 19, and eight copies of chromosome 14. A complete deletion of chromosome 16 is also evident. This visual serves as an educational example of genomic instability and complex chromosomal rearrangements in primary CNS tumors.
Numerical Abbreviation of Human Chromosomes
1. The Basic System: Numbers 1-22 + Sex Chromosomes
| Type | Designation | Count |
|---|---|---|
| Autosomes | 1 through 22 | 44 chromosomes (22 pairs) |
| Sex chromosomes | X and Y | 2 (pair 23) |
2. Alphabetical Group Classification (Denver System)
| Group | Chromosomes | Characteristics |
|---|---|---|
| A | 1, 2, 3 | Large metacentric or submetacentric |
| B | 4, 5 | Large submetacentric |
| C | 6, 7, 8, 9, 10, 11, 12; X | Medium submetacentric |
| D | 13, 14, 15 | Medium acrocentric, with satellites |
| E | 16, 17, 18 | Smaller metacentric/submetacentric |
| F | 19, 20 | Short metacentric |
| G | 21, 22; Y | Smallest acrocentric |
- Emery's Elements of Medical Genetics and Genomics, p. 37
3. Chromosome Arm Notation
| Symbol | Meaning |
|---|---|
| p | Short arm (petit) |
| q | Long arm |
| cen | Centromere |
| tel | Telomere |
- Example: 15q12 = chromosome 15, long arm, region 1, band 2
4. ISCN Karyotype Abbreviations
| Abbreviation | Meaning |
|---|---|
| 46,XX | Normal female |
| 46,XY | Normal male |
| 47,XY,+21 | Male with Down syndrome (trisomy 21) |
| 46,XX,del(5p) | Female with cri du chat (5p deletion) |
| + | Extra chromosome (gain) |
| - | Missing chromosome (loss) |
| del | Deletion |
| dup | Duplication |
| inv | Inversion |
| ins | Insertion |
| t | Translocation |
| der | Derivative chromosome |
| i | Isochromosome |
| dic | Dicentric |
| mar | Marker chromosome |
| mos | Mosaic |
| mat / pat | Maternal / paternal origin |
| dn | De novo (not inherited) |
| [ ] | Number of cells examined |
| chr | Chromosome |
| cht | Chromatid |
| arr | Microarray |
- Thompson & Thompson Genetics and Genomics in Medicine, 9th ed., p. 84
- ISCN Symbols and Abbreviated Terms - Coriell
5. Band Numbering System
- Bands are numbered from the centromere outward on each arm
- Sub-bands are indicated by a decimal point: e.g., 7q11.23 means chromosome 7, long arm, region 1, band 1, sub-band 23
Quick Summary
- 1-22 = autosome numbers (largest to smallest)
- X, Y = sex chromosome designations
- p / q = short / long arm
- A-G = morphological group letters (Denver system, older classification)
- 46,XX / 46,XY = standard karyotype notation (ISCN)
- Band location format: [chromosome][arm][region].[band] e.g., 17p13.1