Explain me 10 common heart diseases with ECG changes and ECG images of those diseases
Reading File
Finding Sources
Searching Images
ECG myocardial infarction ST elevation changes
Finding Sources
Searching Images
atrial fibrillation ECG irregular rhythm no P waves
Searching Images
heart block complete AV block ECG third degree
Searching Images
ventricular tachycardia ECG wide complex tachycardia
Searching Images
left ventricular hypertrophy ECG voltage criteria
Searching Images
pulmonary embolism ECG S1Q3T3 right heart strain
Searching Images
Wolff-Parkinson-White syndrome delta wave short PR ECG
Searching Images
pericarditis ECG diffuse ST elevation saddle shape PR depression
Searching Images
hyperkalemia ECG peaked T waves wide QRS sine wave
Searching Images
dilated cardiomyopathy heart failure ECG left bundle branch block poor R wave progression
Here is a comprehensive guide to 10 common heart diseases with their ECG changes and ECG images.
10 Common Heart Diseases: ECG Changes & Images
1. 🫀 Acute Myocardial Infarction (STEMI) — Anterior
ECG Changes:
- Hyperacute T waves (earliest sign — tall, peaked, broad-based)
- ST-segment elevation ≥1 mm in ≥2 contiguous leads (convex "tombstone" morphology)
- Pathological Q waves (>40 ms wide, >25% of QRS height) — indicate necrosis
- Reciprocal ST depression in opposing leads
- T-wave inversion in later stages
- Lead distribution: V1–V4 (anterior/LAD territory), V5–V6 + I + aVL (anterolateral), II/III/aVF (inferior/RCA or LCx)
Anatomical Correlation:
| Territory | Leads with ST elevation | Artery |
|---|---|---|
| Anterior | V1–V4 | LAD (proximal) |
| Anterolateral | V1–V6, I, aVL | LAD (proximal) |
| Inferior | II, III, aVF | RCA or LCx |
| Posterior | V1–V3 (depression + tall R) | LCx or RCA |
ECG Image — Anterolateral STEMI:

ECG Image — Inferior STEMI (with posterior involvement):
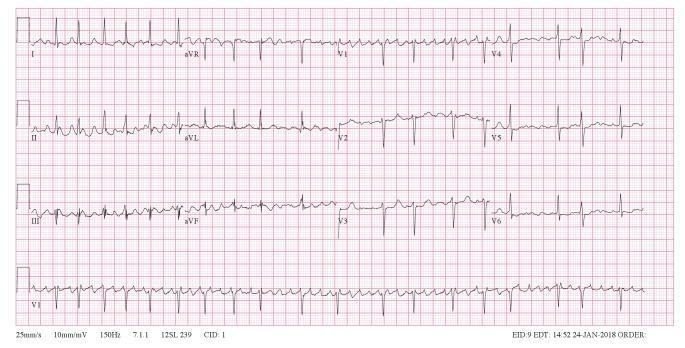
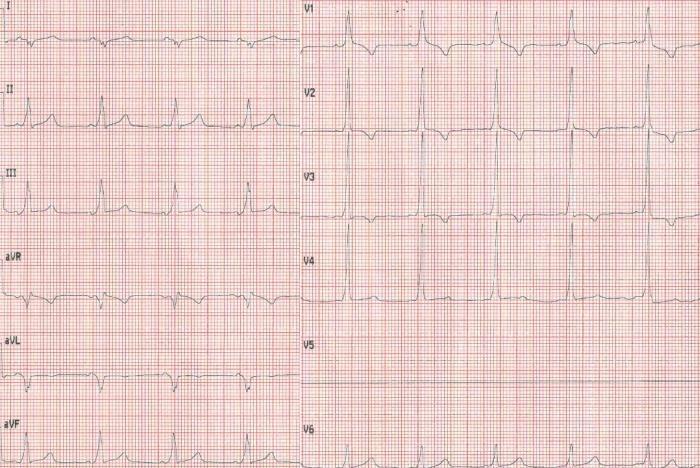
2. ❤️🩹 Atrial Fibrillation (AF)
ECG Changes:
- No visible P waves — replaced by chaotic fibrillatory (f) waves, best seen in V1 and II
- Irregularly irregular R-R intervals (hallmark sign)
- Narrow QRS (unless aberrant conduction/bundle branch block)
- Ventricular rate: uncontrolled (>100 bpm), controlled (60–100), or bradycardic (<60)
- Fine vs. coarse AF: coarse f-waves can mimic atrial flutter
ECG Image — Atrial Fibrillation (fast ventricular response):
ECG Image — Coarse AF:
3. 🛑 Complete (Third-Degree) AV Block
ECG Changes:
- Complete AV dissociation — P waves and QRS complexes are completely independent
- P waves occur at a faster regular rate (atrial rate)
- QRS complexes occur at a slower, regular escape rate (ventricular rate)
- Wide QRS (>120 ms) if escape rhythm is ventricular (infra-Hisian); narrow QRS if junctional escape
- No fixed PR interval — P waves "march through" QRS complexes
- Typically presents with bradycardia (ventricular rate 30–45 bpm)
ECG Image — Complete (3rd Degree) AV Block:
ECG Image — 3rd Degree Block (junctional escape, narrow QRS):
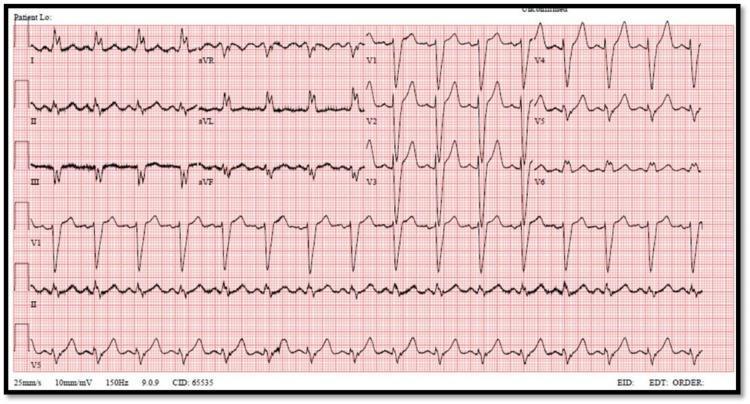
4. ⚡ Ventricular Tachycardia (VT)
ECG Changes:
- Wide QRS (>120 ms) at rate >100 bpm
- Monomorphic VT: uniform QRS morphology, regular rhythm
- AV dissociation (P waves unrelated to QRS) — pathognomonic when seen
- Fusion beats and capture beats (Dressler beats) — confirm ventricular origin
- Concordance: all precordial leads positive (positive) or negative (negative) — strongly suggests VT
- Northwest axis (extreme left axis deviation)
- Rate typically 140–220 bpm
ECG Image — Monomorphic VT (wide complex tachycardia):
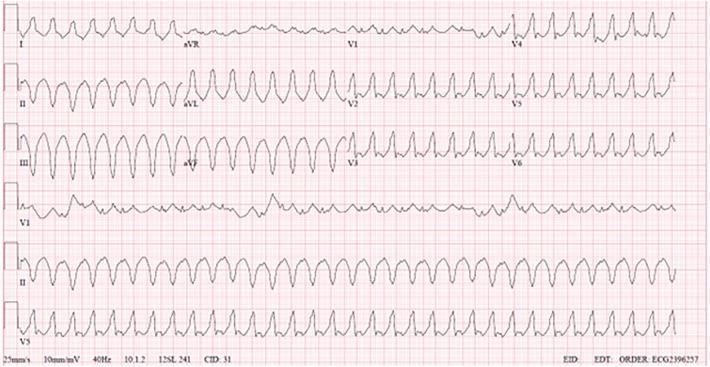
ECG Image — Wide Complex Tachycardia (VT):
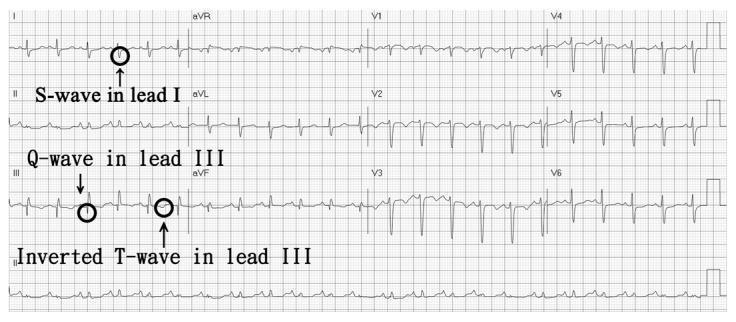
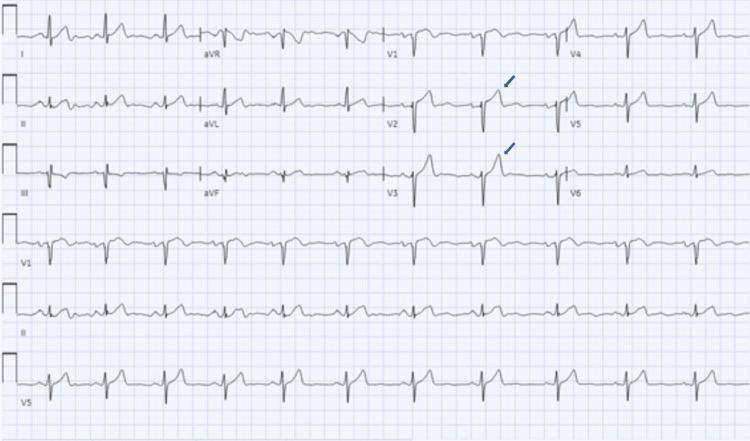
5. 🫁 Pulmonary Embolism (PE)
ECG Changes:
- Sinus tachycardia — most common finding (>50% of cases)
- Classic S1Q3T3 pattern: deep S in I, Q wave in III, T-wave inversion in III
- Right bundle branch block (RBBB) — complete or incomplete
- T-wave inversions in V1–V4 (right ventricular strain)
- Right axis deviation
- P pulmonale (tall peaked P waves in II if right atrial strain)
- New atrial fibrillation
ECG Image — PE with S1Q3T3 (annotated):
ECG Image — PE with RV strain (RBBB + precordial T-wave inversions):
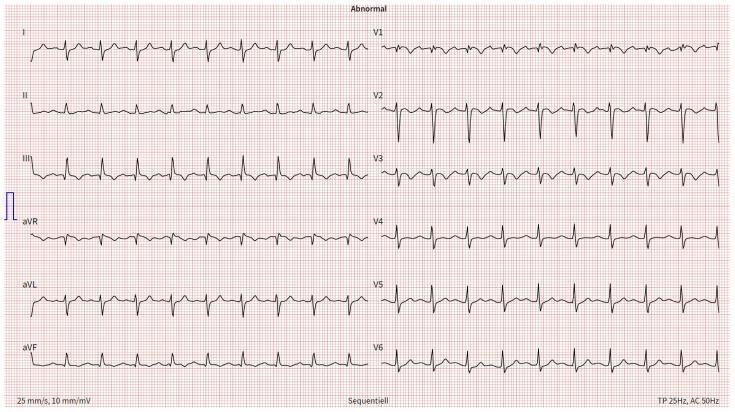
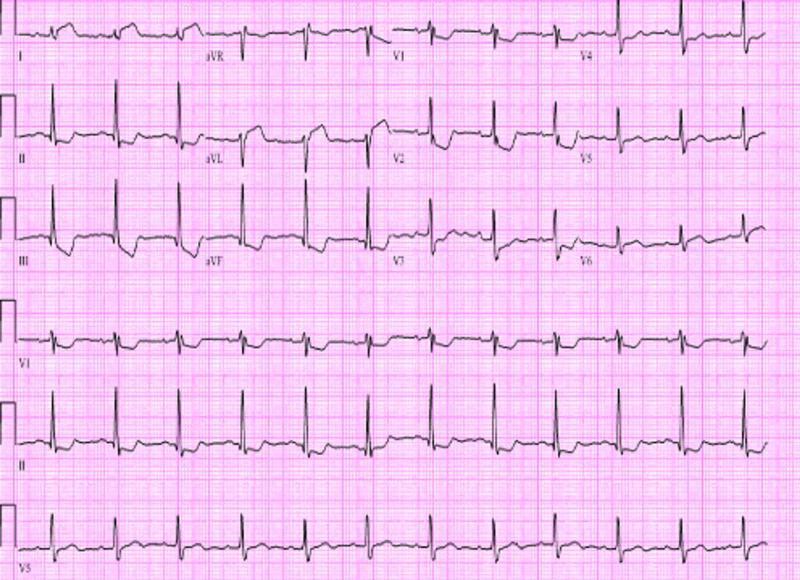
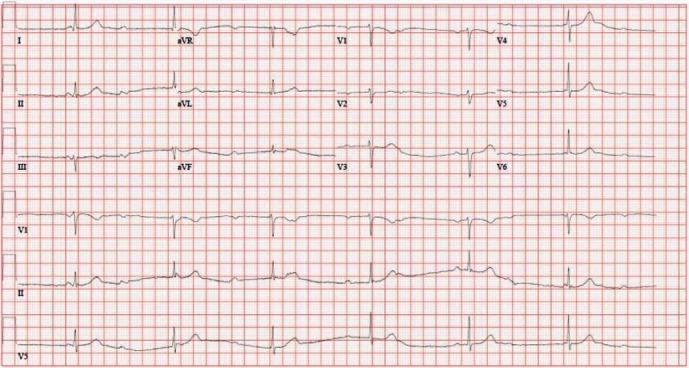
6. 💉 Left Ventricular Hypertrophy (LVH)
ECG Changes:
Voltage criteria (increased QRS amplitudes due to increased muscle mass):
- Sokolow-Lyon: S in V1 + R in V5 or V6 ≥35 mm
- Cornell voltage: R in aVL + S in V3 >28 mm (men) or >20 mm (women)
- Cornell product: >2440 mm·ms
Associated changes (strain pattern):
- ST depression + T-wave inversion in lateral leads (I, aVL, V5–V6) — "strain pattern"
- Left axis deviation
- Left atrial enlargement (broad/notched P waves, negative terminal component in V1)
ECG Image — LVH with Cornell voltage criteria:
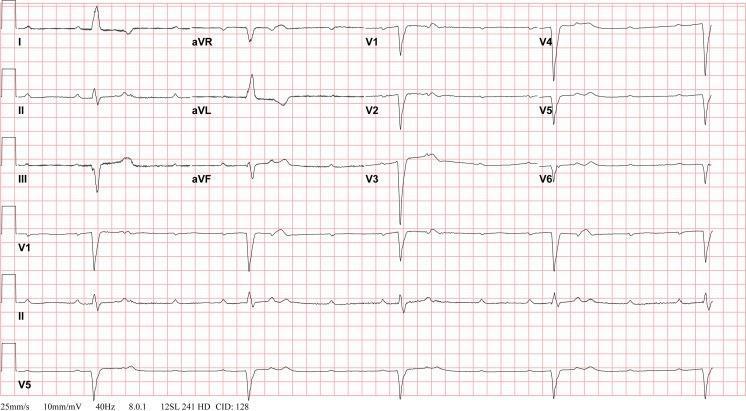
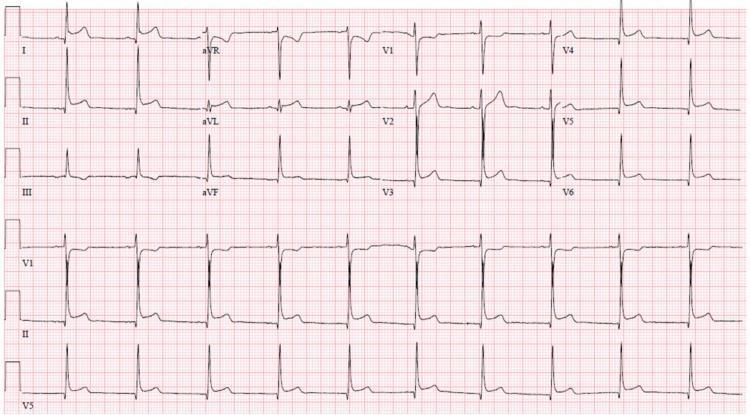
7. 🔥 Acute Pericarditis
ECG Changes (classically evolve in 4 stages):
- Stage I: Diffuse, concave (saddle-shaped) ST elevation in most leads (except aVR and V1); PR depression (most specific finding); reciprocal changes in aVR (ST depression + PR elevation)
- Stage II: ST returns to baseline, T waves flatten
- Stage III: T-wave inversions develop diffusely
- Stage IV: Normalization (weeks to months)
- Spodick's sign: downsloping TP segment (early and specific)
- Key differentiator from STEMI: diffuse (not territorial) + concave morphology + PR depression
ECG Image — Acute Pericarditis (diffuse saddle ST + PR depression):

ECG Image — Pericarditis with Spodick's sign:
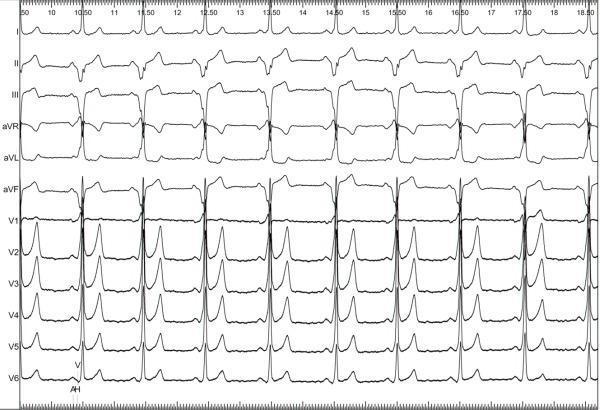
8. ⚡ Wolff-Parkinson-White Syndrome (WPW)
ECG Changes:
- Short PR interval (<120 ms) — accessory pathway bypasses AV node delay
- Delta wave — slurred upstroke at start of QRS (initial ventricular pre-excitation)
- Wide QRS (>120 ms) — due to fusion of pre-excited and normally conducted depolarization
- Pseudo-infarct Q waves (negative delta waves in inferior or lateral leads can mimic MI)
- Secondary ST-T changes discordant to QRS direction
- Accessory pathway localization based on delta wave polarity in each lead
Risk: WPW + AF → rapid conduction via accessory pathway → ventricular fibrillation
ECG Image — WPW (classic delta waves + short PR):
ECG Image — WPW (posteroseptal pathway, pseudoinfarct Q waves inferior):
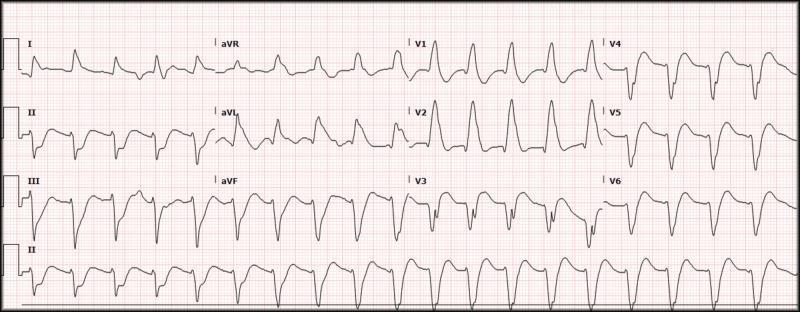
9. 🧂 Hyperkalemia
ECG Changes (progressive with rising K⁺):
| K⁺ level | ECG change |
|---|---|
| 5.5–6.5 mmol/L | Tall, narrow, peaked ("tented") T waves (earliest sign) |
| 6.5–7.5 mmol/L | Flattened/absent P waves (atrial standstill), prolonged PR |
| 7.5–8.5 mmol/L | Wide QRS (intraventricular conduction delay), deepening S waves |
| >8.5 mmol/L | Sine wave pattern (merged QRS-T), VF/asystole risk |
ECG Image — Severe Hyperkalemia (peaked T waves + wide QRS + sine wave):
ECG Image — Early-Moderate Hyperkalemia (peaked T waves):
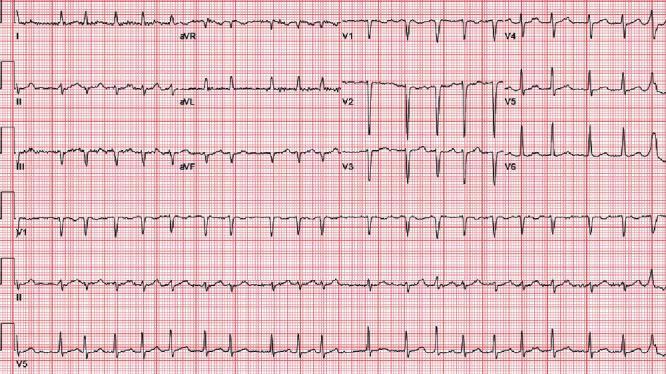
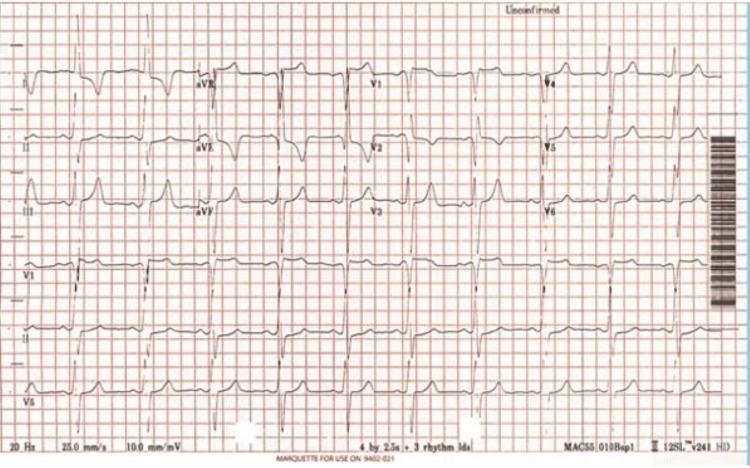
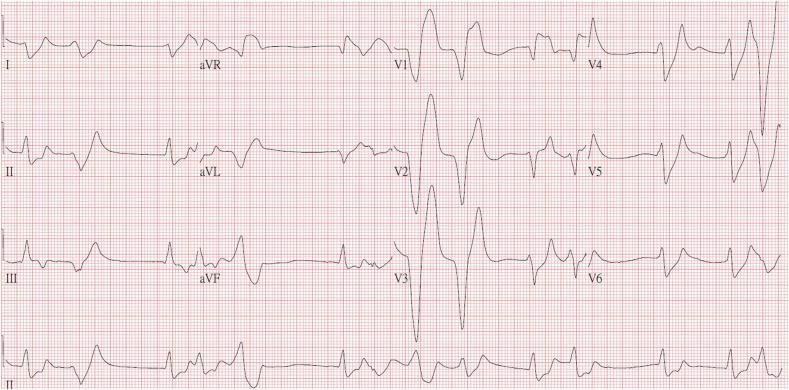
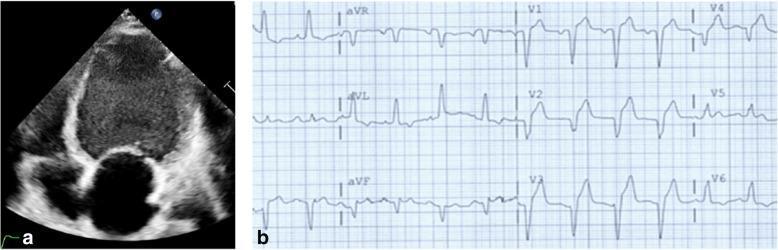
10. 🫀 Dilated Cardiomyopathy (DCM)
ECG Changes:
- Left Bundle Branch Block (LBBB): broad notched R waves in I, aVL, V5–V6; deep S waves in V1; QRS >120 ms; secondary ST-T changes discordant to QRS
- Poor R wave progression (V1–V4) — mimics anterior infarction
- Left axis deviation
- Left atrial enlargement — broad, bifid P waves (P mitrale)
- Sinus tachycardia (compensatory)
- Non-specific intraventricular conduction delay (IVCD)
- Ventricular ectopy / premature ventricular complexes (PVCs)
- Low voltage (if coexisting pericardial effusion)
ECG Image — DCM with LBBB:
ECG Image — DCM (echocardiogram + LBBB ECG):
Quick Reference Summary Table
| # | Disease | Key ECG Finding(s) |
|---|---|---|
| 1 | Acute MI (STEMI) | ST elevation (convex), Q waves, T-wave inversion, reciprocal depression |
| 2 | Atrial Fibrillation | Absent P waves, irregularly irregular QRS, fibrillatory baseline |
| 3 | Complete AV Block | AV dissociation, slow escape rhythm, no PR relationship |
| 4 | Ventricular Tachycardia | Wide QRS >120 ms, rate >100, AV dissociation, concordance |
| 5 | Pulmonary Embolism | S1Q3T3, sinus tachycardia, RBBB, V1–V4 T-wave inversions |
| 6 | LV Hypertrophy | Tall R/deep S voltages, lateral strain pattern, LAD |
| 7 | Acute Pericarditis | Diffuse concave ST↑, PR depression, Spodick's sign |
| 8 | WPW Syndrome | Short PR, delta wave, wide QRS, pseudo-Q waves |
| 9 | Hyperkalemia | Peaked T waves → absent P → wide QRS → sine wave |
| 10 | Dilated Cardiomyopathy | LBBB, poor R progression, PVCs, left atrial enlargement |
Clinical Pearl: Always interpret ECG findings in clinical context. Many findings overlap (e.g., LBBB can obscure STEMI — use Sgarbossa criteria; WPW can mimic STEMI or AF).
This is a shared conversation. Sign in to Orris to start your own chat.