Pulmonary embolism in ECG

Reading File
Finding Sources
Searching Images

ECG pulmonary embolism S1Q3T3 pattern right heart strain
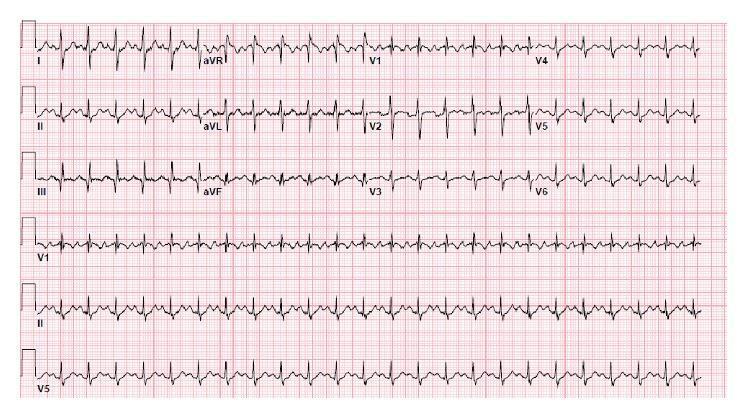
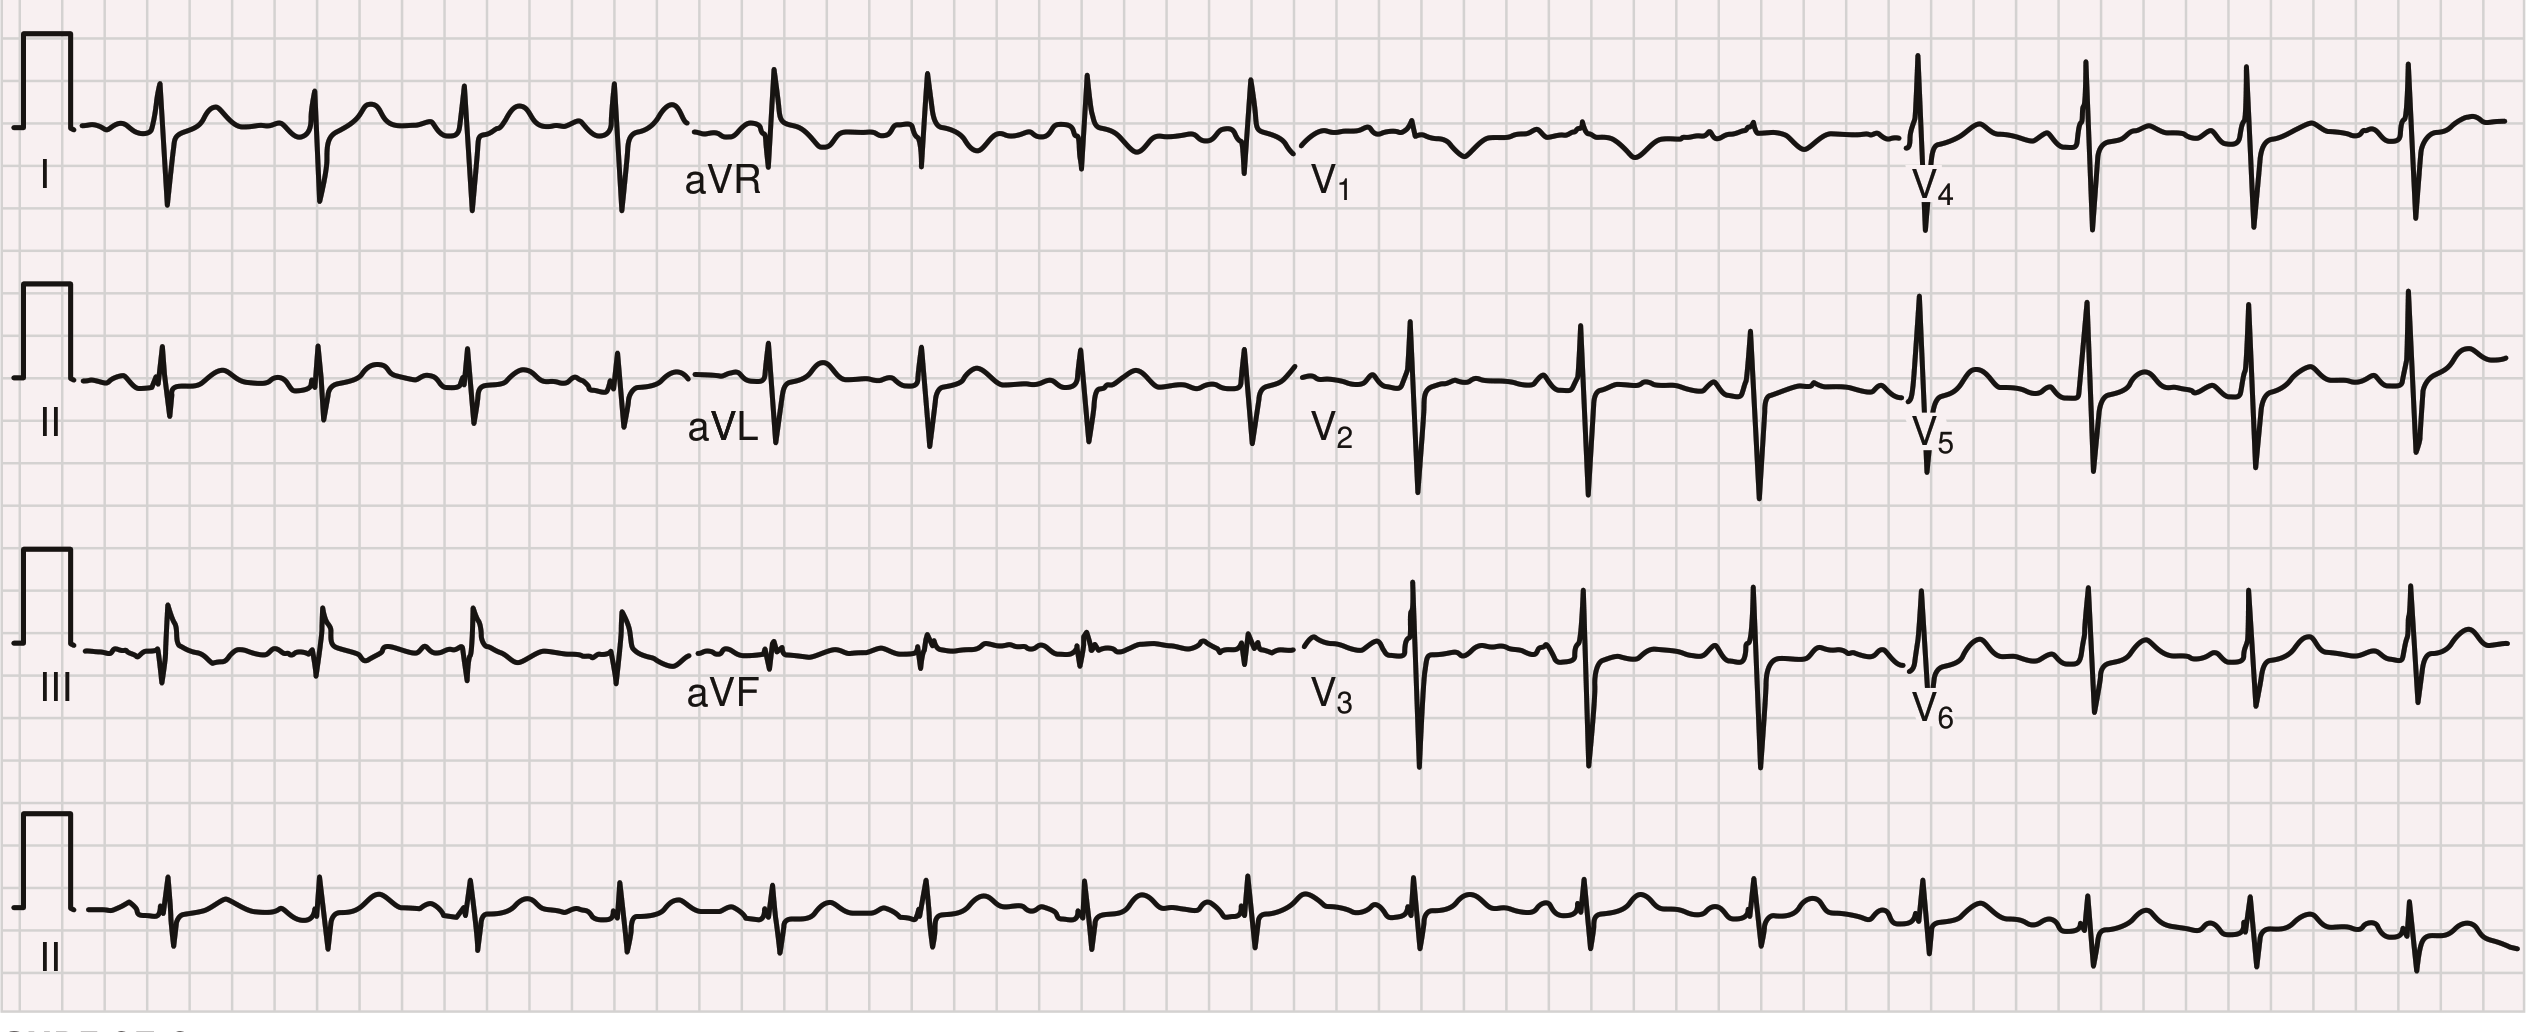
This diagnostic image is a 12-lead electrocardiogram (ECG) recorded at standard speed and voltage. The tracing demonstrates sinus tachycardia, characterized by a rapid heart rate with present P waves preceding each QRS complex. The most clinically significant finding is the 'S1Q3T3' pattern, a classic sign of right ventricular strain. This is visually evidenced by a prominent, deep S wave in Lead I, a discernible Q wave in Lead III, and an inverted T wave in Lead III. Additionally, the precordial leads (V1-V6) show T-wave inversions and ST-segment changes, further supporting a right heart pressure overload morphology. This specific combination of findings is strongly associated with acute pulmonary embolism and right heart strain in the appropriate clinical context. The ECG includes a long rhythm strip at the bottom (Leads V1, II, and V5) to facilitate rate and rhythm analysis.
This diagnostic image is a 12-lead electrocardiogram (ECG) recorded at standard speed and voltage. The tracing demonstrates sinus tachycardia, characterized by a rapid heart rate with present P waves preceding each QRS complex. The most clinically significant finding is the 'S1Q3T3' pattern, a classic sign of right ventricular strain. This is visually evidenced by a prominent, deep S wave in Lead I, a discernible Q wave in Lead III, and an inverted T wave in Lead III. Additionally, the precordial leads (V1-V6) show T-wave inversions and ST-segment changes, further supporting a right heart pressure overload morphology. This specific combination of findings is strongly associated with acute pulmonary embolism and right heart strain in the appropriate clinical context. The ECG includes a long rhythm strip at the bottom (Leads V1, II, and V5) to facilitate rate and rhythm analysis.

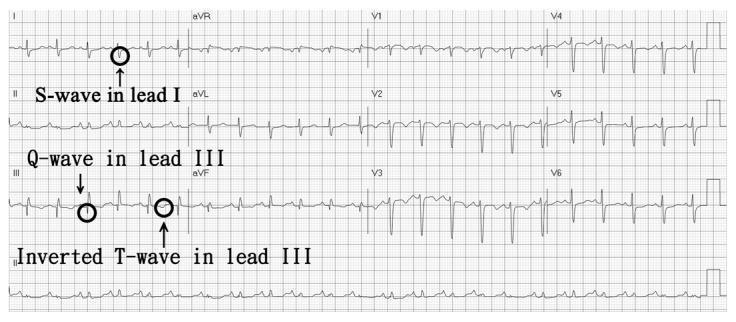
This diagnostic image is a 12-lead electrocardiogram (ECG) tracing demonstrating a classic S1Q3T3 pattern, a clinical sign of acute right heart strain often associated with pulmonary embolism. The ECG is annotated with black circles and arrows highlighting three primary visual features: a prominent S-wave in lead I (terminal negative deflection of the QRS), a pathological Q-wave in lead III (initial negative deflection), and an inverted T-wave in lead III. The tracing also shows sinus tachycardia, evidenced by a regular rhythm with a heart rate exceeding 100 beats per minute. The QRS complexes are generally narrow and upright in the precordial leads (V1-V6). This illustration is designed for medical students and clinicians to identify specific morphological ECG abnormalities that reflect the pathophysiological stress of the right ventricle against increased pulmonary vascular resistance.
This diagnostic image is a 12-lead electrocardiogram (ECG) tracing demonstrating a classic S1Q3T3 pattern, a clinical sign of acute right heart strain often associated with pulmonary embolism. The ECG is annotated with black circles and arrows highlighting three primary visual features: a prominent S-wave in lead I (terminal negative deflection of the QRS), a pathological Q-wave in lead III (initial negative deflection), and an inverted T-wave in lead III. The tracing also shows sinus tachycardia, evidenced by a regular rhythm with a heart rate exceeding 100 beats per minute. The QRS complexes are generally narrow and upright in the precordial leads (V1-V6). This illustration is designed for medical students and clinicians to identify specific morphological ECG abnormalities that reflect the pathophysiological stress of the right ventricle against increased pulmonary vascular resistance.

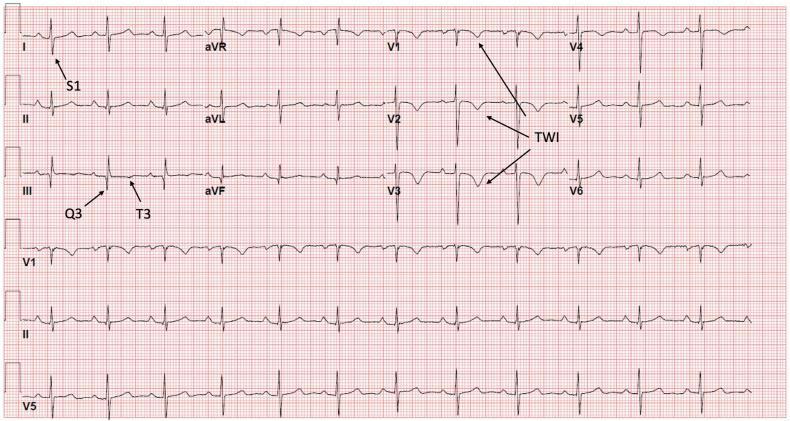
Diagnostic Image: A 12-lead electrocardiogram (ECG) displayed on a standard red grid, demonstrating classic features associated with acute right ventricular (RV) strain. The tracing shows a sinus rhythm with several key diagnostic findings. In the limb leads, an S1Q3T3 pattern is visible, marked with labels: a deep S-wave in lead I (S1), a pathological Q-wave in lead III (Q3), and an inverted T-wave in lead III (T3). In the precordial leads, there are prominent, deep, symmetric T-wave inversions (TWI) extending from V1 through V6, which are also highlighted with arrows. These visual markers collectively illustrate the McGinn-White sign, often associated with acute pulmonary embolism. The ECG serves as an educational tool for recognizing the cardiovascular manifestations of increased right-sided heart pressure and strain.
Diagnostic Image: A 12-lead electrocardiogram (ECG) displayed on a standard red grid, demonstrating classic features associated with acute right ventricular (RV) strain. The tracing shows a sinus rhythm with several key diagnostic findings. In the limb leads, an S1Q3T3 pattern is visible, marked with labels: a deep S-wave in lead I (S1), a pathological Q-wave in lead III (Q3), and an inverted T-wave in lead III (T3). In the precordial leads, there are prominent, deep, symmetric T-wave inversions (TWI) extending from V1 through V6, which are also highlighted with arrows. These visual markers collectively illustrate the McGinn-White sign, often associated with acute pulmonary embolism. The ECG serves as an educational tool for recognizing the cardiovascular manifestations of increased right-sided heart pressure and strain.

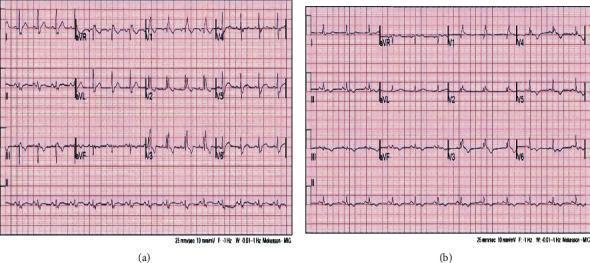
This diagnostic image displays a side-by-side comparison of two 12-lead electrocardiograms (ECG) from a 55-year-old patient, demonstrating the cardiovascular manifestations of acute pulmonary embolism (PE) and subsequent progression. ECG (a), captured at the time of acute diagnosis, shows sinus rhythm with a heart rate of approximately 90 bpm and a classic right ventricular (RV) strain pattern. Key features include a right bundle branch block (RBBB) with an rSR' pattern in lead V1, slurred S waves in lead V6, and the S1Q3T3 pattern (deep S wave in lead I, Q wave in lead III, and inverted T wave in lead III). Inverted T waves are also prominent in the anterior precordial leads (V1-V3). ECG (b), taken five days later during ICU recovery, shows persistent RBBB with a slightly widened QRS duration (~150 ms) and evolving diffuse T-wave changes across the precordial leads. The comparison highlights the utility of serial ECG monitoring in identifying RV strain secondary to pulmonary vascular obstruction and tracking the resolution of electrophysiological abnormalities following thrombolytic therapy.

This diagnostic image displays a side-by-side comparison of two 12-lead electrocardiograms (ECG) from a 55-year-old patient, demonstrating the cardiovascular manifestations of acute pulmonary embolism (PE) and subsequent progression. ECG (a), captured at the time of acute diagnosis, shows sinus rhythm with a heart rate of approximately 90 bpm and a classic right ventricular (RV) strain pattern. Key features include a right bundle branch block (RBBB) with an rSR' pattern in lead V1, slurred S waves in lead V6, and the S1Q3T3 pattern (deep S wave in lead I, Q wave in lead III, and inverted T wave in lead III). Inverted T waves are also prominent in the anterior precordial leads (V1-V3). ECG (b), taken five days later during ICU recovery, shows persistent RBBB with a slightly widened QRS duration (~150 ms) and evolving diffuse T-wave changes across the precordial leads. The comparison highlights the utility of serial ECG monitoring in identifying RV strain secondary to pulmonary vascular obstruction and tracking the resolution of electrophysiological abnormalities following thrombolytic therapy.

Finding Sources
Searching Images

right bundle branch block ECG right axis deviation pulmonary hypertension
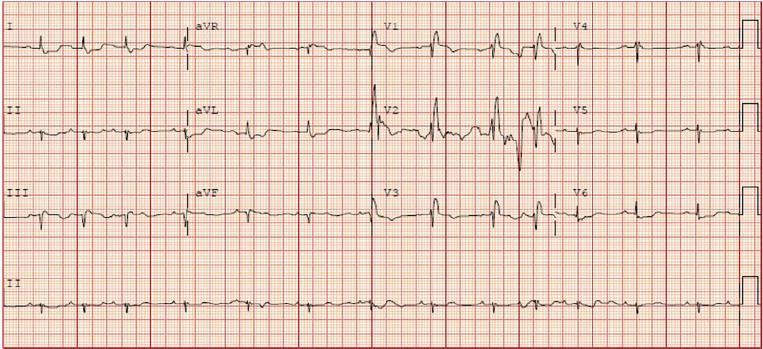
A 12-lead electrocardiogram (ECG) demonstrating findings consistent with right heart strain. The primary diagnostic features include a complete Right Bundle Branch Block (RBBB) and Right Axis Deviation (RAD). In the precordial leads V1-V3, the QRS complexes are widened with a classic RSR' pattern, most prominent in lead V1. Corresponding widened, slurred S waves are visible in leads I, aVL, and V6. In the limb leads, Right Axis Deviation is evidenced by a predominantly negative QRS complex in lead I and a predominantly positive QRS complex in lead aVF. There are additional signs of right ventricular strain, including T-wave inversions in the right precordial leads (V1-V3). These electrophysiological findings are clinically significant in the context of acute pulmonary hypertension, such as that caused by a massive pulmonary embolism. The ECG serves as an educational example of how acute right ventricular pressure overload manifests through conduction delays and axis shifts.
A 12-lead electrocardiogram (ECG) demonstrating findings consistent with right heart strain. The primary diagnostic features include a complete Right Bundle Branch Block (RBBB) and Right Axis Deviation (RAD). In the precordial leads V1-V3, the QRS complexes are widened with a classic RSR' pattern, most prominent in lead V1. Corresponding widened, slurred S waves are visible in leads I, aVL, and V6. In the limb leads, Right Axis Deviation is evidenced by a predominantly negative QRS complex in lead I and a predominantly positive QRS complex in lead aVF. There are additional signs of right ventricular strain, including T-wave inversions in the right precordial leads (V1-V3). These electrophysiological findings are clinically significant in the context of acute pulmonary hypertension, such as that caused by a massive pulmonary embolism. The ECG serves as an educational example of how acute right ventricular pressure overload manifests through conduction delays and axis shifts.

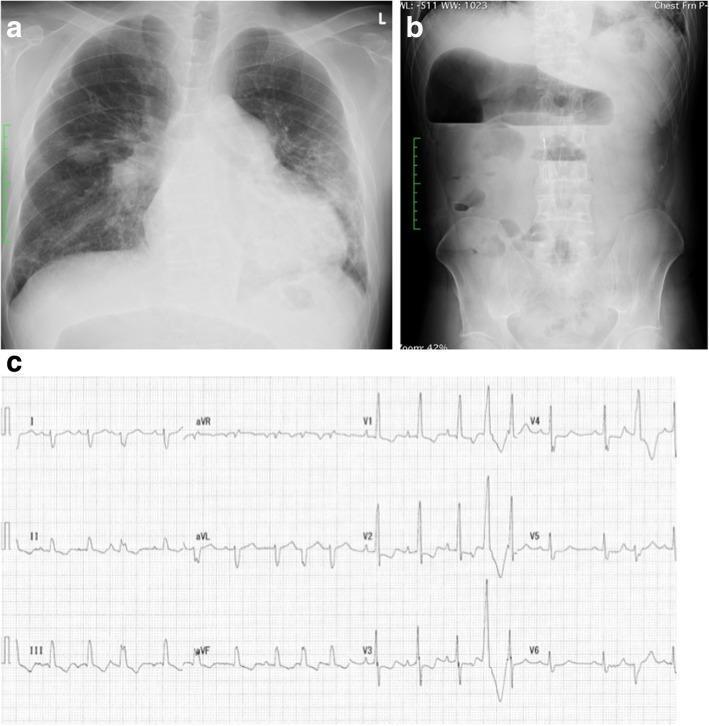
A composite clinical image containing three panels (a, b, and c) illustrating diagnostic findings for a patient with pulmonary hypertension and chronic intestinal paralysis. Panel a is a posterior-anterior (PA) chest radiograph demonstrating significant cardiomegaly with a prominent right-sided heart border and a notably enlarged pulmonary arterial arch, consistent with right heart strain. Panel b is a plain abdominal radiograph in the upright position showing significant gaseous distension within the colon and prominent air-fluid levels, indicating chronic intestinal paralysis or ileus. Panel c is a standard 12-lead electrocardiogram (ECG) showing signs of right ventricular hypertrophy, including a right bundle branch block (RBBB) pattern, right axis deviation, and tall R-waves in the precordial V-leads. Together, these images serve as an educational resource for identifying secondary systemic and cardiac manifestations of chronic thromboembolic pulmonary hypertension and concurrent gastrointestinal complications.

A composite clinical image containing three panels (a, b, and c) illustrating diagnostic findings for a patient with pulmonary hypertension and chronic intestinal paralysis. Panel a is a posterior-anterior (PA) chest radiograph demonstrating significant cardiomegaly with a prominent right-sided heart border and a notably enlarged pulmonary arterial arch, consistent with right heart strain. Panel b is a plain abdominal radiograph in the upright position showing significant gaseous distension within the colon and prominent air-fluid levels, indicating chronic intestinal paralysis or ileus. Panel c is a standard 12-lead electrocardiogram (ECG) showing signs of right ventricular hypertrophy, including a right bundle branch block (RBBB) pattern, right axis deviation, and tall R-waves in the precordial V-leads. Together, these images serve as an educational resource for identifying secondary systemic and cardiac manifestations of chronic thromboembolic pulmonary hypertension and concurrent gastrointestinal complications.

Reading File
Reading File
Loading Image
Loading Image
Reading File
Excellent - I now have rich textbook content and multiple real ECG images. Here is a complete, well-illustrated answer.

ECG Findings in Pulmonary Embolism

The ECG in PE reflects acute right heart strain caused by sudden obstruction of the pulmonary vasculature. It is important to understand that no single ECG finding is specific for PE - the ECG's main value is supporting the diagnosis and excluding mimics (e.g., STEMI, pericarditis).

Pathophysiology

When a large clot obstructs the pulmonary arteries, pulmonary vascular resistance rises abruptly. The right ventricle (RV) dilates under this pressure, causing:
  • RV conduction delay (RBBB)
  • Rightward axis shift
  • RV ischemia and strain (T-wave changes)
  • Reflex tachycardia

ECG Findings - Overview Table

FindingLeadsSignificance
Sinus tachycardiaAllMost common finding (~40%)
S1Q3T3 (McGinn-White sign)I, IIIClassic but not highly sensitive
T-wave inversionsV1-V4Right precordial strain
Incomplete / complete RBBBV1-V3, I, V6RV conduction delay
Right axis deviationI (negative), aVF (positive)RV pressure overload
ST changesVariableMassive PE / RV ischemia
Atrial fibrillation / flutterAllSupraventricular irritability
Normal ECG-Does not exclude PE

1. Sinus Tachycardia

The most common finding - present in ~40% of patients with PE. It is a nonspecific but important clue. A normal heart rate does not rule out PE.

2. S1Q3T3 Pattern (McGinn-White Sign)

The most famous ECG sign of PE - though present in only ~12-20% of cases.
  • S wave in Lead I - deep, broad terminal S wave (right axis deviation)
  • Q wave in Lead III - small pathological Q wave
  • Inverted T wave in Lead III
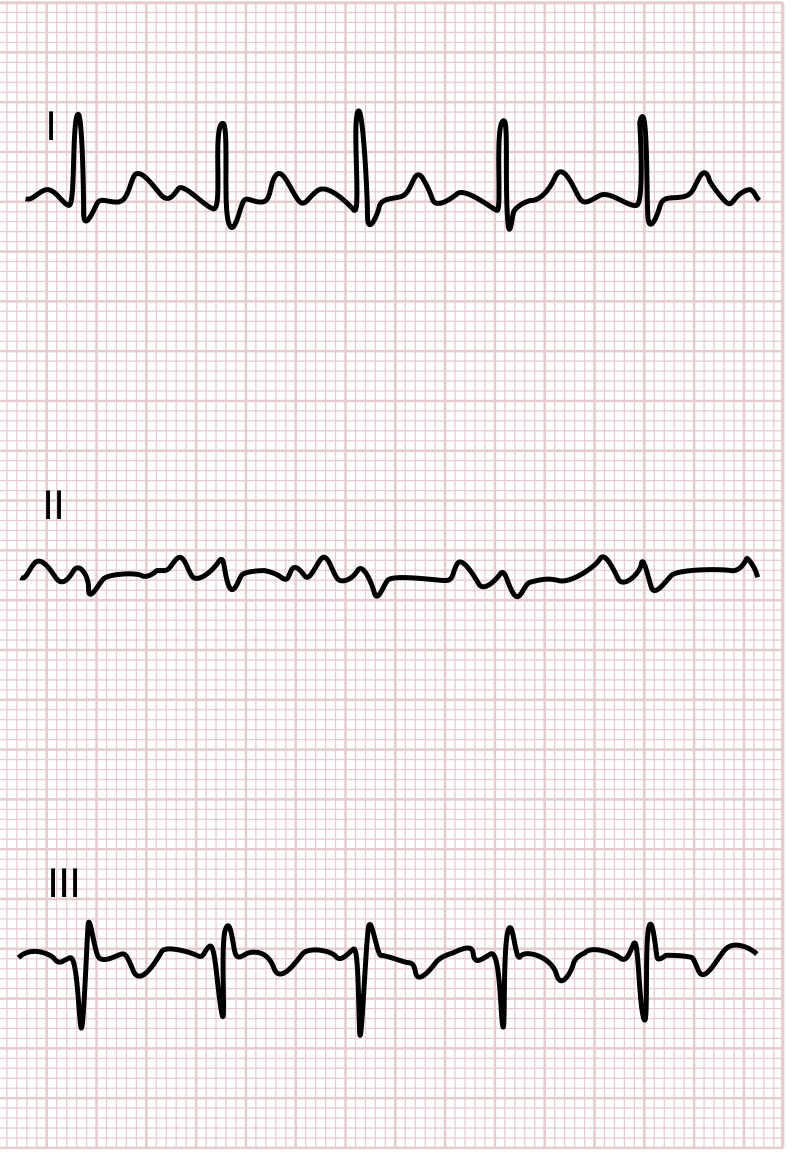
This is the classic ECG from Goldman-Cecil Medicine showing leads I, II, and III with the S1Q3T3 pattern:
Classic S1Q3T3 in PE (Goldman-Cecil Medicine)
Lead I shows broad S wave; Lead III shows Q wave and inverted T wave - the S1Q3T3 pattern.
Here is an annotated example from a real patient with left main pulmonary artery embolism (33-year-old male, from Braunwald's Heart Disease):
PE ECG with S1Q3T3 and incomplete RBBB (Braunwald's Heart Disease)
Note: S wave in lead I, Q wave and inverted T wave in lead III (S1Q3T3), incomplete RBBB, and T-wave inversions/flattening in V1-V4.

3. T-Wave Inversions in V1-V4

This is actually the most common precordial finding in significant PE - more common than S1Q3T3. It reflects right ventricular pressure overload and subendocardial ischemia. Inversions can extend from V1 to V6 in massive PE.
ECG showing S1Q3T3 with T-wave inversions V1-V6 in PE
Classic S1Q3T3 with deep symmetric T-wave inversions from V1 to V6, illustrating massive PE with RV strain.

4. Right Bundle Branch Block (RBBB)

  • Incomplete RBBB is more common
  • Complete RBBB (QRS > 120 ms) in larger emboli
  • Seen as rSR' pattern in V1-V3, with wide slurred S waves in I, aVL, and V6
  • Reflects right bundle stretch from acute RV dilation
RBBB with right axis deviation in acute RV strain from PE

5. Right Axis Deviation (RAD)

Rightward shift of the QRS axis - manifests as:
  • Deep S wave in Lead I
  • Positive QRS in aVF Reflects RV dilation causing a rightward shift.

6. Atrial Arrhythmias

Atrial fibrillation or flutter may occur in ~10% of PE cases due to right atrial dilation and irritability.

Key Clinical Points

  • Normal ECG does not exclude PE - up to 30% of PE patients have a normal or near-normal ECG
  • Right heart strain findings (RBBB, S1Q3T3, precordial T inversions) are more common in large or massive PE with hemodynamic compromise
  • These changes are not specific - identical patterns can occur in acute asthma/COPD exacerbation, idiopathic pulmonary hypertension, and RV failure from other causes
  • The ECG's main roles are: (1) supporting the diagnosis in the right context, and (2) excluding ACS/pericarditis
  • Serial ECGs are useful - resolution of right strain signs after anticoagulation/thrombolysis is a favorable prognostic marker
As described in Braunwald's Heart Disease: "The most famous sign of right heart strain is the S1Q3T3 pattern... but the most common signs are sinus tachycardia and T wave inversion in leads V1 to V4. Right-sided heart strain is not specific for PE and may be observed in patients with asthma, COPD, or idiopathic pulmonary hypertension."

Summary Mnemonic: "STRAW"

  • Sinus tachycardia (most common)
  • T-wave inversions V1-V4
  • RBBB (incomplete > complete)
  • Axis deviation (right axis)
  • White sign - S1Q3T3 (McGinn-White sign)
This is a shared conversation. Sign in to Orris to start your own chat.