
T score graph for bone scan in diabetic
T score DEXA bone scan interpretation diabetic patients osteoporosis graph
T-Score Graph - DEXA Bone Scan Interpretation
The T-Score Scale
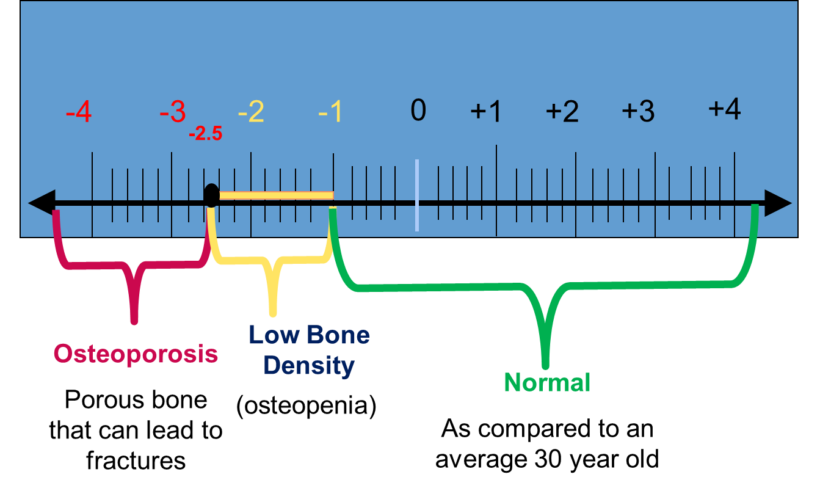
WHO Classification (T-Score Categories)
| T-Score | Classification | Clinical Meaning |
|---|---|---|
| -1.0 and above (e.g., 0, +1, +2) | Normal | BMD within/above the young adult mean |
| -1.0 to -2.5 | Osteopenia (Low bone density) | Mild-moderate reduction; increased fracture risk |
| -2.5 or below | Osteoporosis | BMD ≥2.5 SD below young adult mean; high fracture risk |
| -2.5 or below + fragility fracture | Severe Osteoporosis | Highest fracture risk category |
Key Point for Diabetic Patients - The "T-Score Paradox"
"While there are changes in the mineral composition of bone with diabetes, the link between diabetes and osteoporosis seems to be somewhat independent of bone mineral density. Instead, AGEs (Advanced Glycosylation End Products) and the resultant poor cross-linking of collagen strands due to elevated circulating glucose change the material properties of the bone."
- Rockwood & Green's Fractures in Adults, 10th ed. (2025), p. 842
- Type 1 Diabetes - typically shows lower BMD (T-score more negative) compared to non-diabetic individuals
- Type 2 Diabetes - often shows normal or even higher BMD/T-score (due to obesity/higher body weight), yet fracture risk is STILL elevated
- A recent DEXA study of 89 type 2 diabetic patients found mean T-scores of -1.76 at the lumbar spine and -1.08 at the femoral neck - placing most patients in the osteopenia range (PMC, 2025)
Why T-Score Underestimates Fracture Risk in Diabetics
| Factor | Effect on Bone |
|---|---|
| AGEs (Advanced Glycosylation End Products) | Poor collagen cross-linking; brittle bone despite normal density |
| Diabetic neuropathy | Increased fall risk |
| Retinopathy | Impaired vision - fall risk |
| Nephropathy | Secondary hyperparathyroidism, vitamin D deficiency |
| Poor glycemic control (high HbA1c) | Paradoxically linked to slightly higher BMD but worse bone quality |
| Insulin deficiency (T1DM) | Insulin has anabolic effects on bone; its absence reduces BMD |
DEXA Scanning Sites in Diabetics
- Lumbar spine (L1-L4) - most sensitive to metabolic changes
- Femoral neck - best predictor of hip fracture risk
- Total hip
- Sometimes: distal forearm (especially if spine/hip not measurable)
Clinical Take-Away for Diabetics
- Do not rely on T-score alone in diabetic patients
- Use FRAX tool (Fracture Risk Assessment Tool) which incorporates diabetes as a secondary cause of osteoporosis
- TBS (Trabecular Bone Score) from spine DEXA is increasingly used in diabetics - it assesses bone microarchitecture and better captures the quality deficit that T-score misses
- Screening is recommended especially in: T1DM patients >age 50, T2DM patients with additional risk factors (long duration, poor control, fall risk)
Make a hand drawn diagram for this
Hand drawn sketch style medical diagram of T-score bone density scale for diabetic patients. Shows a horizontal number line from -4 to +4 with hand-drawn arrow style. Three zones clearly marked with rough sketchy coloring: red zone from -4 to -2.5 labeled "Osteoporosis - Porous bone, fractures", yellow/orange zone from -2.5 to -1 labeled "Osteopenia - Low Bone Density", green zone from -1 to +4 labeled "Normal BMD". Below the scale, a hand-drawn callout box titled "Diabetic Patient Warning" with sketchy bullet points: "T1DM: Lower BMD (T-score more negative)", "T2DM: Normal/High T-score BUT fracture risk still HIGH", "AGEs cause poor collagen cross-linking = brittle bone despite normal density", "Use FRAX tool + TBS score, don't rely on T-score alone". Small hand-drawn bone sketches near each zone. Pencil and ink sketch aesthetic, slightly imperfect lines, on white paper background, medical student notes style.
404 Not Found. {'message': '{\n "error": {\n "code": 404,\n "message": "Publisher model `projects/engaged-beaker-474810-u2/locations/global/publishers/google/models/gemini-3-pro-image-preview` was not found or your project does not have access to it. Ensure you are using a valid model name and that the model is available in the specified region. For more information, see: https://docs.cloud.google.com/gemini-enterprise-agent-platform/resources/locations.",\n "status": "NOT_FOUND"\n }\n}\n', 'status': 'Not Found'}
We encountered an error while processing your request. Please try again or reach out to us for help.