
Explain me 10 common heart diseases with ecg changes and ecg images of those diseases
Reading File
Now let me search the medical library and for ECG images in parallel:
Finding Sources
Searching Images
ECG electrocardiogram myocardial infarction ST elevation
Searching Images
ECG atrial fibrillation electrocardiogram
Finding Sources
Searching Images
ECG heart block complete third degree atrioventricular
Searching Images
ECG ventricular tachycardia wide complex tachycardia
Searching Images
ECG hypertrophic cardiomyopathy left ventricular hypertrophy
Searching Images
ECG pericarditis saddle shaped ST elevation diffuse
Searching Images
ECG Wolff Parkinson White syndrome delta wave pre-excitation
Searching Images
ECG dilated cardiomyopathy left bundle branch block
Searching Images
ECG pulmonary embolism right heart strain S1Q3T3 pattern
Searching Images
ECG hyperkalemia peaked T waves sine wave
I now have excellent ECG images for all 10 diseases. Let me compile the comprehensive response.Here is a comprehensive guide to 10 common heart diseases with their ECG changes and images:
10 Common Heart Diseases: ECG Changes & Images
1. ST-Elevation Myocardial Infarction (STEMI)
Overview: Acute complete occlusion of a coronary artery causing transmural myocardial ischemia and necrosis.
ECG Changes:
- Hyperacute T waves — earliest sign; tall, peaked, broad-based T waves in the affected territory
- ST-segment elevation ≥1 mm in ≥2 contiguous limb leads or ≥2 mm in precordial leads, with convex ("tombstone") morphology
- Reciprocal ST depression in anatomically opposite leads
- Pathological Q waves — develop hours to days later (>40 ms wide, >25% of R-wave height)
- T-wave inversion in the subacute phase
Localisation:
| Territory | Leads with STE | Culprit artery |
|---|---|---|
| Anterior | V1–V4 | LAD |
| Lateral | I, aVL, V5–V6 | LCx |
| Inferior | II, III, aVF | RCA |
| Posterior | ST depression V1–V3 + tall R in V1 | RCA/LCx |
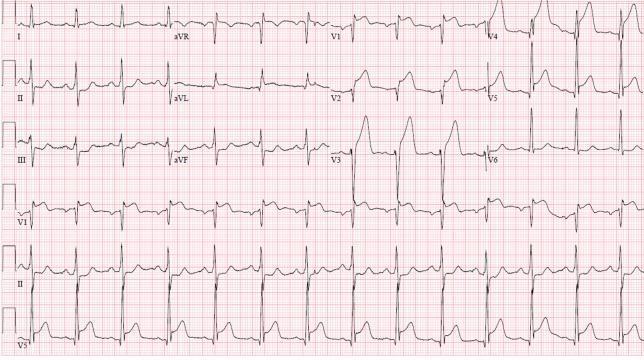
Anterior STEMI: convex ST elevation V1–V6, hyperacute T waves, reciprocal inferior depression — LAD occlusion.
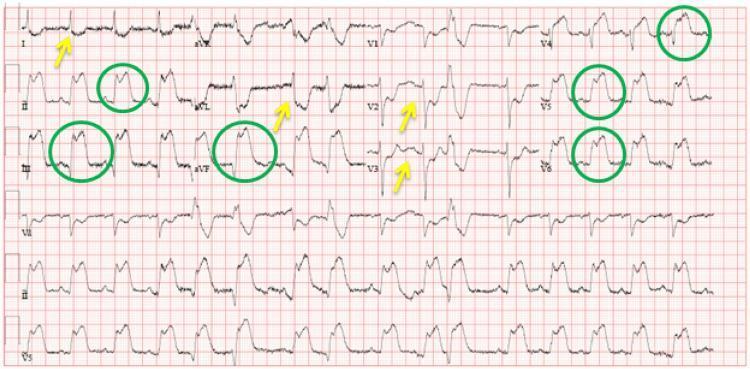
Inferolateral STEMI: ST elevation in II, III, aVF, and V4–V6 with reciprocal depression in I, aVL, and anterior leads.
2. Atrial Fibrillation (AF)
Overview: Disorganized atrial electrical activity causing irregular ventricular response; the most common sustained arrhythmia.
ECG Changes:
- Absent P waves — replaced by fibrillatory (f) waves, best seen in V1 and lead II
- Irregularly irregular RR intervals — the hallmark finding
- Narrow QRS complexes (unless aberrant conduction or bundle branch block coexists)
- Ventricular rate varies: rapid (>100 bpm, uncontrolled), controlled (60–100 bpm), or slow (<60 bpm in over-treatment)
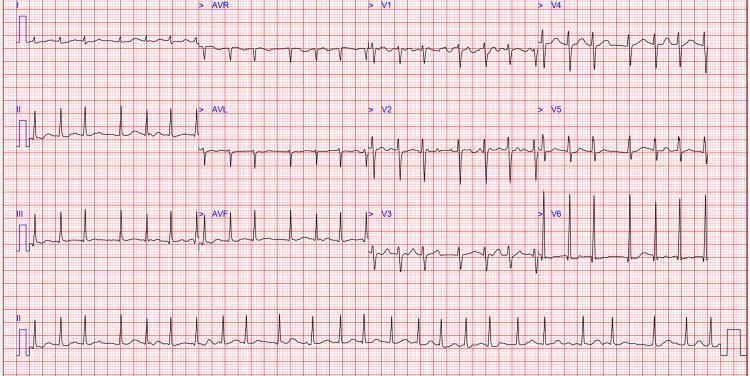
Classic AF: complete absence of P waves, irregular RR intervals, fine f-waves visible in V1 and the rhythm strip.
3. Complete (Third-Degree) AV Heart Block
Overview: Total failure of impulse conduction from atria to ventricles; atria and ventricles beat independently.
ECG Changes:
- Complete AV dissociation — P waves and QRS complexes bear no fixed relationship
- P-P intervals regular (atrial rate faster, usually 60–100 bpm)
- RR intervals regular but slow (ventricular escape rhythm)
- Escape QRS morphology depends on escape focus:
- Junctional escape (nodal block): narrow QRS, rate 40–60 bpm
- Ventricular escape (infra-Hisian): wide QRS, rate 20–40 bpm
- Secondary ST-T changes discordant with the QRS
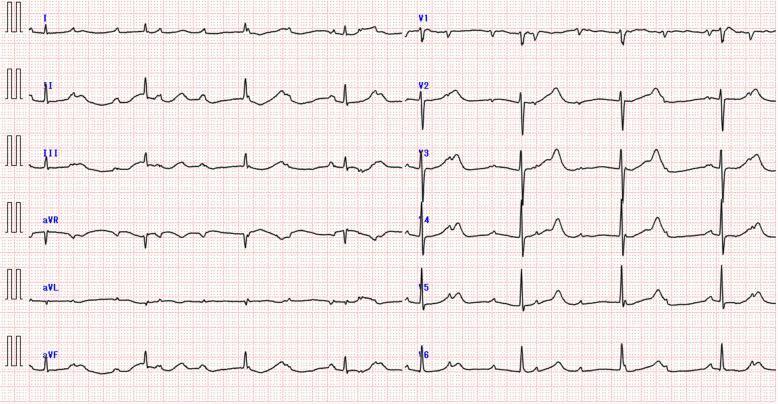
Complete heart block: slow wide-complex ventricular escape ~44 bpm, P waves completely independent of QRS complexes.
4. Ventricular Tachycardia (VT)
Overview: Life-threatening arrhythmia originating below the Bundle of His; most commonly in structural heart disease (post-MI scar, cardiomyopathy).
ECG Changes:
- Wide QRS tachycardia (QRS >120 ms), rate typically 100–250 bpm
- AV dissociation — P waves independent of QRS (pathognomonic when visible)
- Fusion beats and capture beats (Dressler beats) — diagnostic
- Concordance in precordial leads (all positive or all negative) supports VT over SVT with aberrancy
- Monomorphic VT: regular uniform QRS; Polymorphic VT: beat-to-beat QRS variation
- Torsades de pointes: twisting of QRS axis around the isoelectric line, often on long QT background
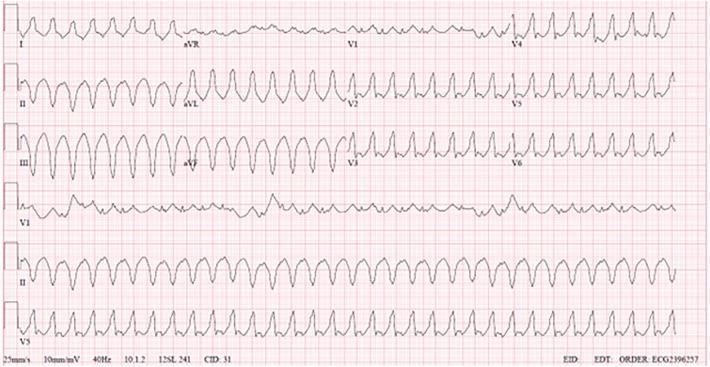
Monomorphic VT: wide QRS complexes, positive concordance V1–V6, no visible P waves, regular rapid rate.
5. Hypertrophic Cardiomyopathy (HCM)
Overview: Genetic sarcomere disease causing asymmetric left ventricular hypertrophy, often with outflow tract obstruction; leading cause of sudden cardiac death in young athletes.
ECG Changes:
- Left ventricular hypertrophy (LVH) — Sokolow–Lyon criteria (SV1 + RV5/V6 ≥35 mm)
- Deep, symmetric T-wave inversions — especially in apical HCM (Yamaguchi variant) with giant T inversions V2–V5
- "Strain pattern" — ST depression + T-wave inversion in lateral leads (I, aVL, V5–V6)
- Absent septal Q waves in I, aVL, V5, V6 (due to abnormal septal depolarisation)
- Left axis deviation
- Abnormal P-wave morphology if left atrial enlargement is present
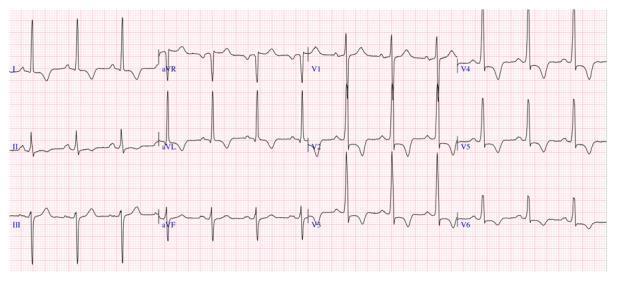
HCM (septal variant): high-amplitude R waves V2–V4, deep T-wave inversions V2–V6 with strain pattern, absent septal Q waves.
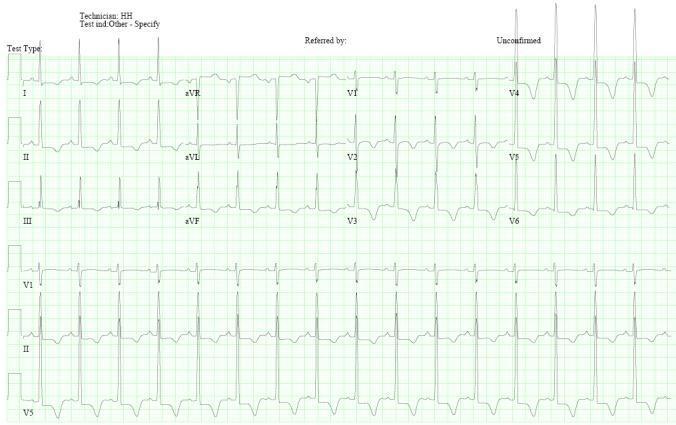
Apical HCM: "giant" deep symmetric T-wave inversions V2–V5 with LVH voltage — classic Yamaguchi pattern.
6. Acute Pericarditis
Overview: Inflammation of the pericardium, typically viral; presents with sharp pleuritic chest pain relieved by leaning forward.
ECG Changes (4 Stages):
- Stage 1 (acute): Diffuse concave ("saddle-shaped") ST elevation in all leads except aVR and V1 + PR depression (most specific sign) — PR elevation in aVR
- Stage 2 (days): ST normalises, T waves flatten
- Stage 3 (1–2 weeks): Diffuse T-wave inversions
- Stage 4 (weeks–months): ECG normalises
Key distinguishing features from STEMI:
- ST elevation is diffuse (not in one coronary territory)
- ST morphology is concave up (not convex)
- PR depression is present
- No reciprocal changes (except aVR)
- Spodick's sign — downsloping TP segment
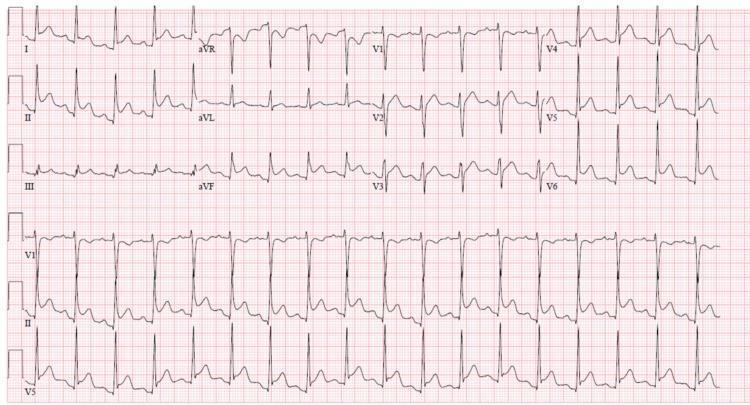
Acute pericarditis: diffuse concave ST elevation in I, II, III, aVF, V2–V6, PR depression in lead II, PR elevation in aVR, sinus tachycardia.
7. Wolff-Parkinson-White (WPW) Syndrome
Overview: Accessory AV pathway (Bundle of Kent) allows ventricular pre-excitation; predisposes to SVT and, in AF, potentially life-threatening rapid conduction.
ECG Changes:
- Short PR interval (<120 ms) — accessory pathway bypasses AV node
- Delta wave — slurred upstroke of QRS (initial slow ventricular depolarisation through myocardium)
- Widened QRS (>120 ms) — sum of delta wave + normal conduction
- Secondary ST-T changes discordant to QRS
- Pseudo-infarct patterns — negative delta waves in inferior leads (II, III, aVF) simulate Q waves
- Pathway location can be inferred from delta wave polarity in different leads
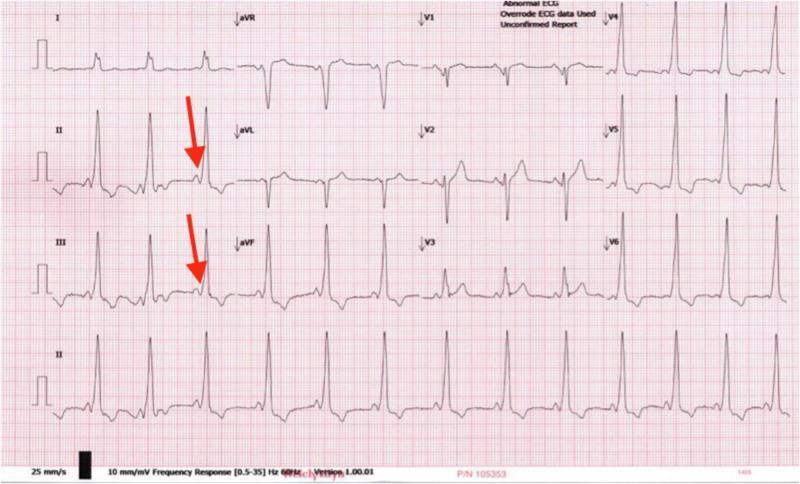
WPW: shortened PR interval, classic delta waves (red arrows in leads II, III), widened QRS with secondary ST-T changes.
8. Dilated Cardiomyopathy (DCM)
Overview: Enlarged, weakened left ventricle with reduced ejection fraction; causes include ischemia, viral myocarditis, alcohol, genetic mutations.
ECG Changes:
- Left bundle branch block (LBBB) — broad notched R in I, aVL, V5, V6; deep rS in V1–V3; secondary discordant ST-T changes
- Left ventricular hypertrophy criteria
- Sinus tachycardia — compensatory
- Poor R-wave progression in precordial leads
- Atrial fibrillation — common complication
- Fragmented QRS (fQRS) — multiple deflections within QRS, marker of fibrosis/scar
- Pathological Q waves mimicking prior MI
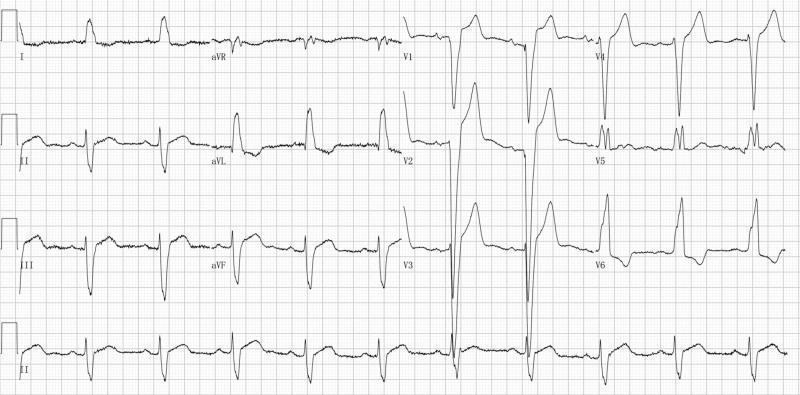
LBBB in DCM: QRS >120 ms, deep rS in V1–V3, broad monophasic R in lateral leads (I, V5–V6), discordant ST depression.
9. Pulmonary Embolism (PE)
Overview: Obstruction of pulmonary arteries causing acute right ventricular pressure overload and strain.
ECG Changes:
- Sinus tachycardia — most common finding (present in ~44% of PE)
- S1Q3T3 pattern (McGinn-White sign) — S wave in lead I, Q wave and T-wave inversion in lead III; present in ~20% of cases
- T-wave inversions in V1–V4 — right ventricular strain pattern
- Right bundle branch block (complete or incomplete) — acute RV dilatation
- Right axis deviation
- P pulmonale — peaked P waves in lead II (right atrial enlargement)
- Atrial fibrillation/flutter — can occur acutely
- Normal ECG does not exclude PE
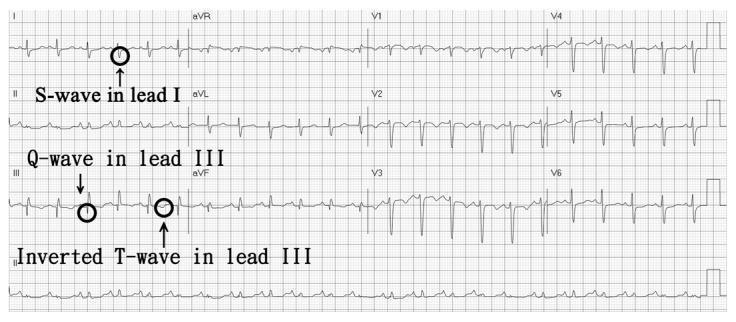
Acute PE: S1Q3T3 pattern annotated with circles — prominent S wave lead I, Q wave lead III, T-wave inversion lead III; sinus tachycardia.
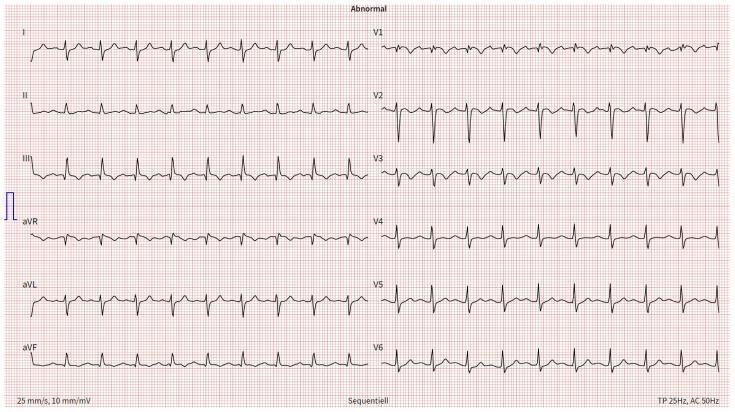
PE with RV strain: S1Q3T3, T-wave inversions V1–V3, incomplete RBBB (QRS 110 ms), sinus tachycardia ~116 bpm.
10. Hyperkalemia (Cardiac Effects)
Overview: Elevated serum potassium disrupts cardiac membrane potential; life-threatening at K⁺ >6.5–7.0 mmol/L.
ECG Changes (progressive with rising K⁺):
| K⁺ level | ECG Change |
|---|---|
| 5.5–6.5 mmol/L | Tall peaked "tented" T waves — narrow base, symmetric |
| 6.5–7.0 mmol/L | PR prolongation, P-wave flattening/disappearance |
| 7.0–8.0 mmol/L | QRS widening — intraventricular conduction delay |
| >8.0 mmol/L | Sine-wave pattern — QRS merges with T wave; pre-arrest |
| Terminal | Ventricular fibrillation → asystole |
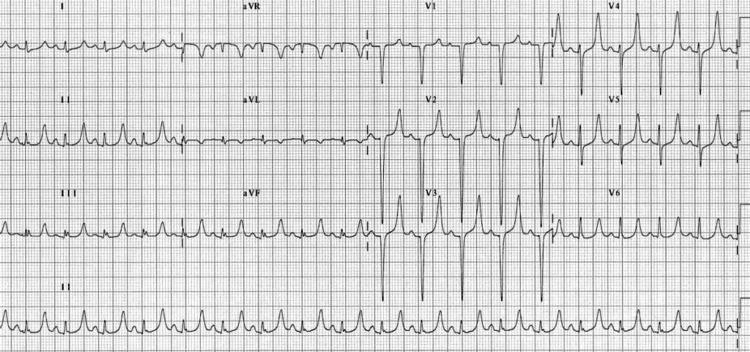
Severe hyperkalemia: prominently peaked T waves in inferior and precordial leads, widened QRS complexes, flattened P waves.
Quick Reference Summary
| Disease | Key ECG Feature |
|---|---|
| STEMI | Convex ST elevation + reciprocal depression + Q waves |
| Atrial Fibrillation | No P waves + irregularly irregular RR |
| Complete Heart Block | AV dissociation + slow escape rhythm |
| Ventricular Tachycardia | Wide QRS tachycardia + AV dissociation |
| HCM | LVH + strain + giant T inversions (apical) |
| Pericarditis | Diffuse concave STE + PR depression (Spodick's sign) |
| WPW | Short PR + delta wave + wide QRS |
| DCM | LBBB + poor R progression + fQRS |
| Pulmonary Embolism | Sinus tachycardia + S1Q3T3 + RV strain |
| Hyperkalemia | Peaked T waves → QRS widening → sine wave |
Clinical note: ECG findings must always be interpreted in the clinical context. A single tracing rarely tells the whole story — serial ECGs, troponin levels, echocardiography, and patient history are all essential parts of the workup.Here's a summary of what was covered across the 10 diseases:
Diseases covered with ECG changes and images:
- STEMI — Convex ST elevation by territory (anterior, inferolateral), hyperacute T waves, reciprocal changes, Q waves
- Atrial Fibrillation — Absent P waves, irregularly irregular RR intervals, fibrillatory baseline
- Complete (3rd Degree) AV Block — Total AV dissociation, slow ventricular escape, P waves independent of QRS
- Ventricular Tachycardia — Wide complex tachycardia, AV dissociation, concordance, fusion/capture beats
- Hypertrophic Cardiomyopathy — LVH voltage, strain pattern, giant T inversions (apical variant / Yamaguchi)
- Acute Pericarditis — Diffuse saddle-shaped ST elevation, PR depression, Spodick's sign, 4 evolutionary stages
- WPW Syndrome — Short PR, delta wave, widened QRS, pseudo-infarct patterns
- Dilated Cardiomyopathy — LBBB, poor R-wave progression, fragmented QRS, AF
- Pulmonary Embolism — S1Q3T3, sinus tachycardia, RV strain (T inversions V1–V4), RBBB
- Hyperkalemia — Progressive changes from peaked T waves → PR prolongation → QRS widening → sine wave → VF
Each section includes real ECG images from peer-reviewed medical literature with annotated descriptions of the diagnostic features.
This is a shared conversation. Sign in to Orris to start your own chat.