
Functional organization of respiratory system
functional organization of the respiratory system diagram airways alveoli
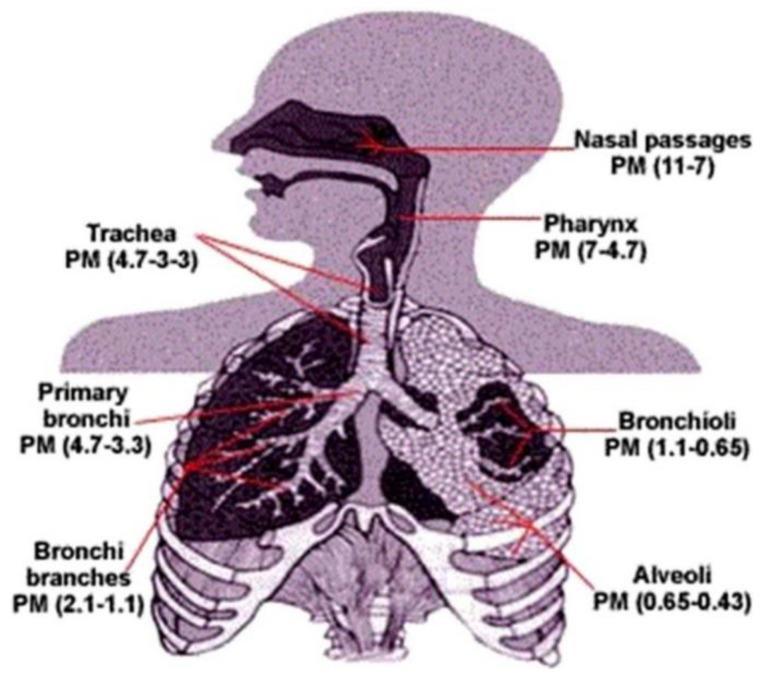
This medical anatomical diagram illustrates the human respiratory system in a sagittal and coronal cross-section, specifically highlighting the deposition potential of particulate matter (PM) based on particle size (measured in micrometers) across various anatomical regions. The diagram maps specific PM ranges to key structures: the nasal passages (11-7 µm), pharynx (7-4.7 µm), trachea and primary bronchi (4.7-3.3 µm), bronchi branches (2.1-1.1 µm), bronchioli (1.1-0.65 µm), and the alveoli (0.65-0.43 µm). Visually, the image shows the transition from the upper respiratory tract to the lower deep lung structures, demonstrating a clear inverse relationship where larger particles are filtered in the upper airways and smaller, fine particles reach the terminal alveoli. This educational visual is relevant for environmental health, pulmonology, and pathophysiology, illustrating how inhaled pollutants distribute based on their aerodynamic diameter and the risk factors associated with deep pulmonary penetration of fine particulate matter.
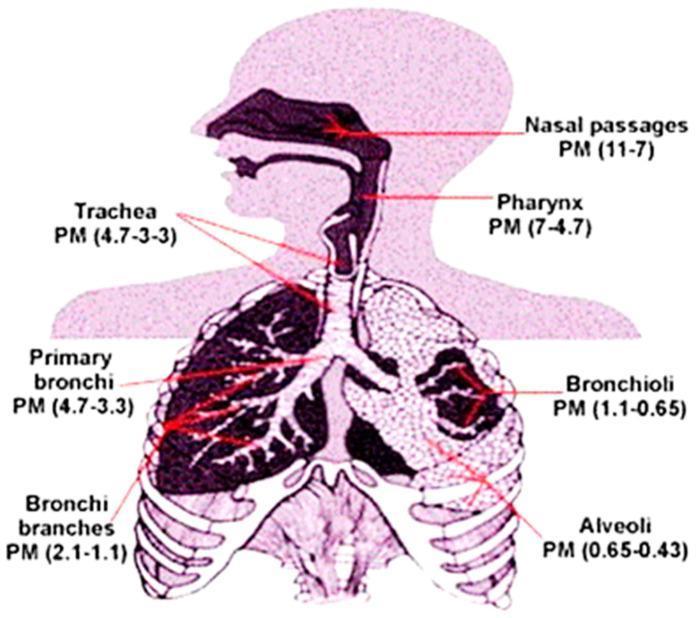
This medical illustration is a pathophysiology diagram depicting the human respiratory system and the deposition patterns of particulate matter (PM) based on size. The diagram utilizes a human silhouette to map the upper and lower respiratory tracts. Labeled anatomical regions include the nasal passages, pharynx, trachea, primary bronchi, bronchi branches, bronchioli, and alveoli. Each region is annotated with a specific PM size range (presumably in micrometers) that typically deposits there. The data shows a progressive decrease in particle size relative to the depth of penetration: the upper tract (nasal passages) captures larger particles (11–7 µm), the conductive airways (trachea and bronchi) capture mid-sized particles (4.7–1.1 µm), and the deepest acinar regions (bronchioli and alveoli) receive the smallest, ultrafine particles (1.1–0.43 µm). This visual serves as an educational tool for environmental health and pulmonology, illustrating how different particle diameters interact with respiratory anatomy to impact lung health.
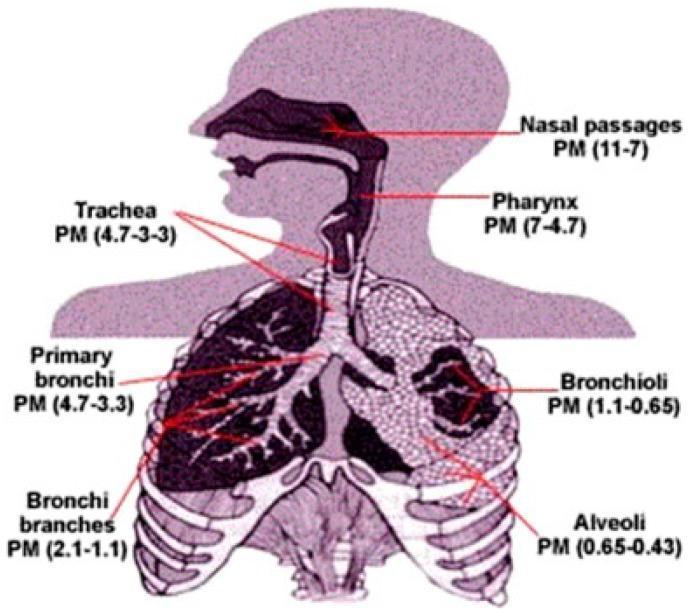
An anatomical diagram of the human respiratory system illustrating the correlation between anatomical structures and the deposition depth of particulate matter (PM) based on aerodynamic diameter. The illustration highlights the respiratory tract from the head and neck through the thoracic cavity. Specific labels indicate the range of PM size (in micrometers) that typically deposits in each region: Nasal passages (PM 11-7), Pharynx (PM 7-4.7), Trachea and Primary Bronchi (PM 4.7-3.3), Bronchi branches (PM 2.1-1.1), Bronchioli (PM 1.1-0.65), and Alveoli (PM 0.65-0.43). The diagram demonstrates the physiological principle that larger particles are filtered by upper airway defenses, while progressively smaller fine and ultrafine particles penetrate deeper into the distal tracheobronchial tree and alveolar units. This visual serves as an educational tool for environmental health and pulmonology, explaining the clinical significance of PM size in lung pathology and systemic absorption.
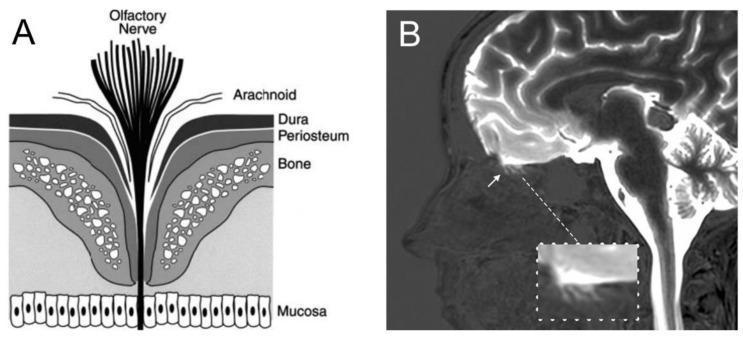
This dual-panel image illustrates the anatomical and functional barrier between the cranial and nasal cavities at the cribriform plate. Panel A is an anatomical diagram showing the layered organization of the cribriform region. From superior to inferior, it depicts the olfactory nerve bundles passing through the arachnoid, dura, periosteum, and the fenestrated bone of the cribriform plate to reach the respiratory mucosa. The diagram highlights how olfactory sensory neurons bridge the subarachnoid space and the nasal environment. Panel B is a sagittal T1-weighted MRI of the human head following intrathecal administration of a gadolinium-based contrast agent (gadobutrol). Bright signal enhancement indicates high contrast concentration throughout the cerebral subarachnoid space, cerebral convexities, and around the brainstem and spinal cord. An inset focuses on the cribriform plate (indicated by a white arrow), showing that while gadolinium penetrates the superior aspect of the cribriform fenestrations, it does not enter the nasal mucosa. This image demonstrates the clinical relevance of the blood-CSF barrier and evaluates the potential for CSF drainage into the lymphatic system through the olfactory pathway.
respiratory system neuromuscular control brainstem breathing centers chemoreceptors
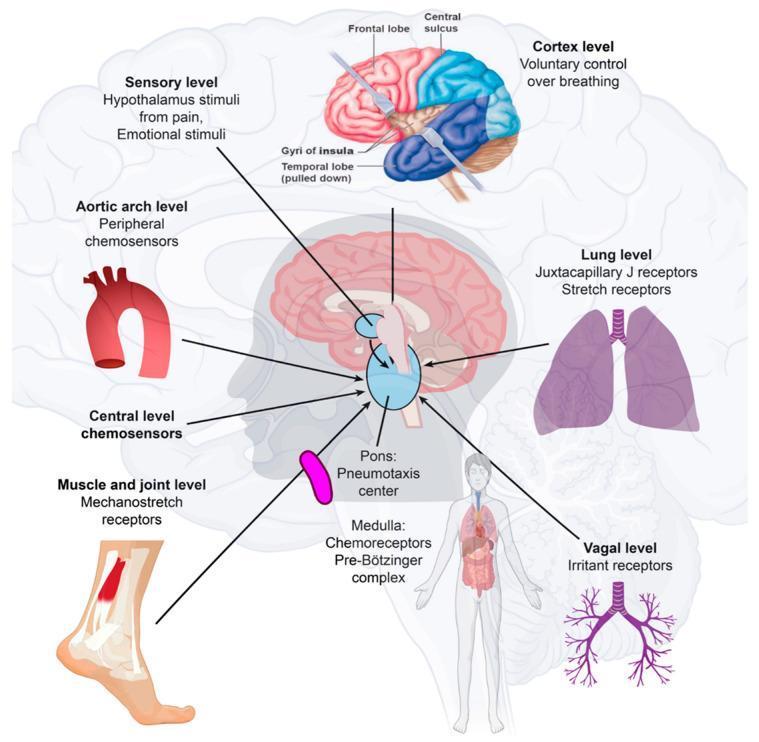
This medical illustration details the neuroanatomical and physiological pathways regulating human respiration. The central focus is a sagittal view of the brainstem, highlighting the Pons (Pneumotaxic center) and Medulla Oblongata (Chemoreceptors and Pre-Bötzinger complex) as the primary integration hubs for breathing rhythm. The diagram maps multiple afferent inputs to these centers: the Cortex level (frontal lobe) for voluntary control; the Sensory level (hypothalamus) processing pain and emotional stimuli; and central chemosensors. Peripheral inputs are illustrated at several anatomical levels: the Aortic arch (peripheral chemosensors), Lung level (Juxtacapillary J receptors and stretch receptors), Muscle/joint level (mechanostretch receptors), and Vagal level (irritant receptors). An anatomical overlay shows the cerebral cortex with labels for the frontal lobe, central sulcus, and gyri of the insula. The illustration summarizes how multifaceted physiological parameters, including blood pH, CO2, O2, lung volume, and physical movement, are processed by the autonomic nervous system to control respiratory rate and depth.
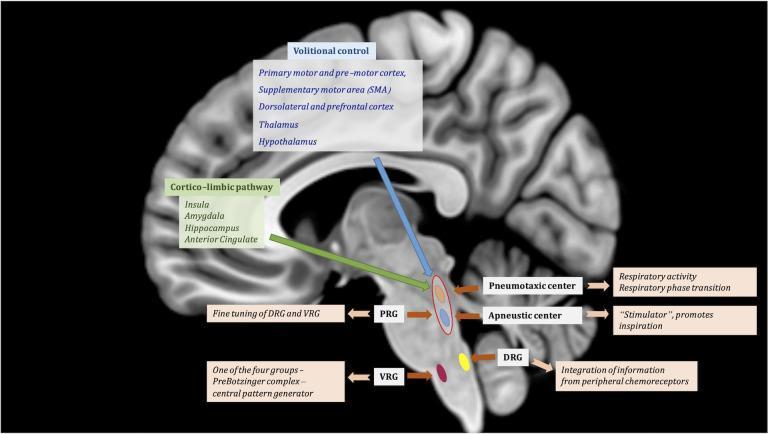
This medical illustration features a T1-weighted sagittal MRI of the human brain overlaid with a diagram of the central regulation of respiratory function. The graphic outlines two primary suprapontine pathways: the 'Volitional control' pathway (originating from the motor cortex, SMA, and thalamus/hypothalamus) and the 'Cortico-limbic pathway' (originating from the insula, amygdala, and hippocampus), both descending toward the brainstem. Within the pons, the Pontine Respiratory Group (PRG) is highlighted, comprising the Pneumotaxic center (responsible for respiratory phase transition) and the Apneustic center (a stimulator promoting inspiration). These centers exert fine-tuning over the medullary respiratory groups. In the medulla, the illustration identifies the Dorsal Respiratory Group (DRG), which integrates peripheral chemoreceptor information, and the Ventral Respiratory Group (VRG), specifically noting the PreBötzinger complex as the central pattern generator. The diagram effectively illustrates the hierarchical neuroanatomical structure of breathing regulation, from cortical modulation to autonomic brainstem control.
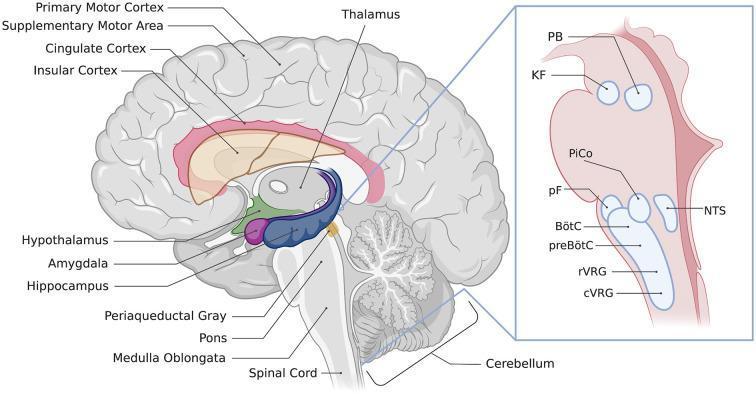
This medical anatomical diagram illustrates a mid-sagittal section of the human brain, highlighting the key regions involved in the neurological control of breathing. The main illustration color-codes forebrain and limbic structures: the Cingulate Cortex (pink), Insular Cortex (tan), Thalamus (gray), Hypothalamus (green), Amygdala (purple), and Hippocampus (dark blue). Landmarks such as the Primary Motor Cortex, Supplementary Motor Area, Periaqueductal Gray (PAG), Pons, Medulla Oblongata, and Cerebellum are clearly labeled. An enlarged inset provides a detailed view of the brainstem's respiratory control centers within the medulla and pons. This inset identifies specialized nuclei including the Parabrachial nuclei (PB), Kölliker-Fuse nucleus (KF), post-inspiratory complex (PiCo), parafacial respiratory groups (pF), Nucleus of the solitary tract (NTS), Bötzinger complex (BötC), preBötzinger complex (preBötC), and the rostral and caudal ventral respiratory groups (rVRG, cVRG). The diagram effectively maps the hierarchical organization of respiratory regulation from higher cortical and limbic centers down to autonomic brainstem nuclei and the spinal cord.
lung zones alveoli gas exchange oxygen carbon dioxide diffusion
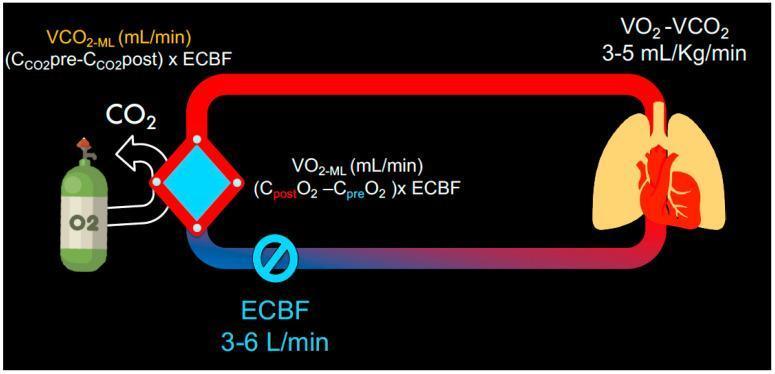
This pathophysiology diagram illustrates the principles of gas exchange in an Extracorporeal Membrane Oxygenation (ECMO) circuit. The schematic depicts a closed-loop system where blood is diverted from the cardiopulmonary system (represented by lung and heart icons) to an extracorporeal membrane lung (ML), shown as a diamond-shaped oxygenator. A color gradient transitions from blue (deoxygenated) to red (oxygenated) as blood passes through the ML. The diagram includes physiological formulas for oxygen consumption (VO2-ML) and carbon dioxide removal (VCO2-ML) by the membrane lung, emphasizing their dependence on the extracorporeal blood flow (ECBF) and the content differences pre- and post-membrane. Key quantitative data include an ECBF range of 3-6 L/min and a metabolic VO2-VCO2 rate of 3-5 mL/kg/min. An oxygen tank icon indicates the exogenous O2 source, while CO2 exit is shown via an arrow. This educational visual is designed for advanced medical learners to understand the mechanical substitution of pulmonary gas exchange and the clinical variables governing ECMO efficiency.
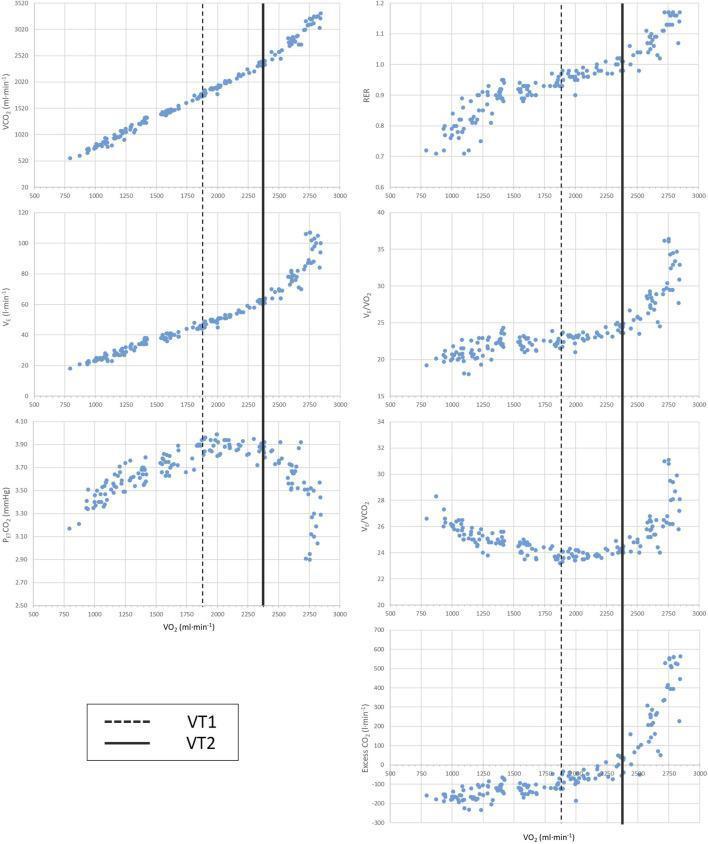
This diagnostic comparison chart displays six scatter plots illustrating respiratory gas exchange parameters from an incremental exercise test used for cardiopulmonary exercise testing (CPET). All plots use oxygen uptake (VO2 in ml/min) on the x-axis, ranging from 500 to 3000 ml/min. The vertical lines denote the first ventilatory threshold (VT1, dashed line) and the second ventilatory threshold (VT2, solid line). The y-axes measure: carbon dioxide output (VCO2), ventilation (VE), end-tidal CO2 pressure (PETCO2), respiratory exchange ratio (RER), the ventilatory equivalent for CO2 (VE/VCO2), and excess carbon dioxide output. Key physiological transitions are visible: VT1 typically corresponds to the point where VE/VO2 and PETCO2 begin to increase, while VT2 (the respiratory compensation point) is marked by a rapid, non-linear increase in VE, RER exceeding 1.0, and a secondary sharp rise in excess CO2 output. This chart is a standard tool in sports medicine and clinical physiology for assessing aerobic capacity and determining metabolic transition zones.
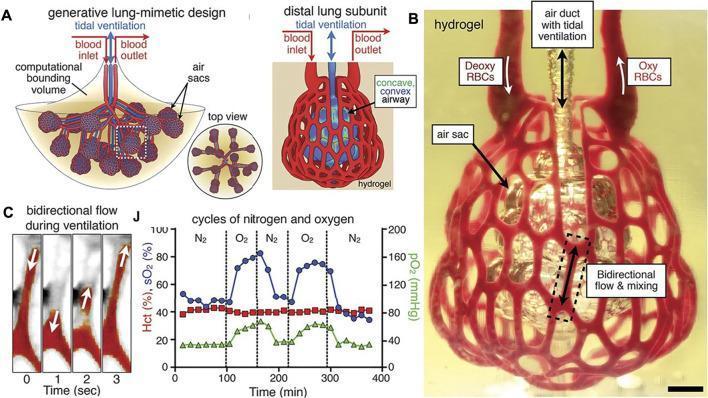
This composite educational image illustrates the 3D bioprinting of lung-mimetic structures for gas exchange studies, specifically mimicking the distal lung subunit. Panel A contains anatomical diagrams of a generative lung-mimetic design, showing air sacs (alveoli) and blood inlets/outlets within a computational bounding volume. Panel B is a clinical photograph of a 3D-printed hydrogel structure created via stereolithography. It features a red, lattice-like framework representing microvascular channels surrounding a central, translucent air sac ventilated by an air duct. Labels indicate the perfusion of deoxygenated (Deoxy) and oxygenated (Oxy) red blood cells (RBCs) through the hydrogel network. Panel C provides a time-series animation frame showing bidirectional flow during tidal ventilation. Panel J is a line graph tracking hematocrit (Hct), oxygen saturation (sO2), and partial pressure of oxygen (pO2) over multiple cycles of nitrogen (N2) and oxygen (O2) ventilation, demonstrating the model's functional gas exchange capacity. This material is used to teach respiratory physiology, tissue engineering, and the development of 3D bioprinted organs.
Functional Organization of the Respiratory System
- The controller (CNS - voluntary and automatic)
- The efferent pathways (peripheral nervous system, spinal cord, motor nerves)
- The mechanical effectors (respiratory muscles and chest wall)
- The airways and lungs (conducting zone + gas exchange zone)
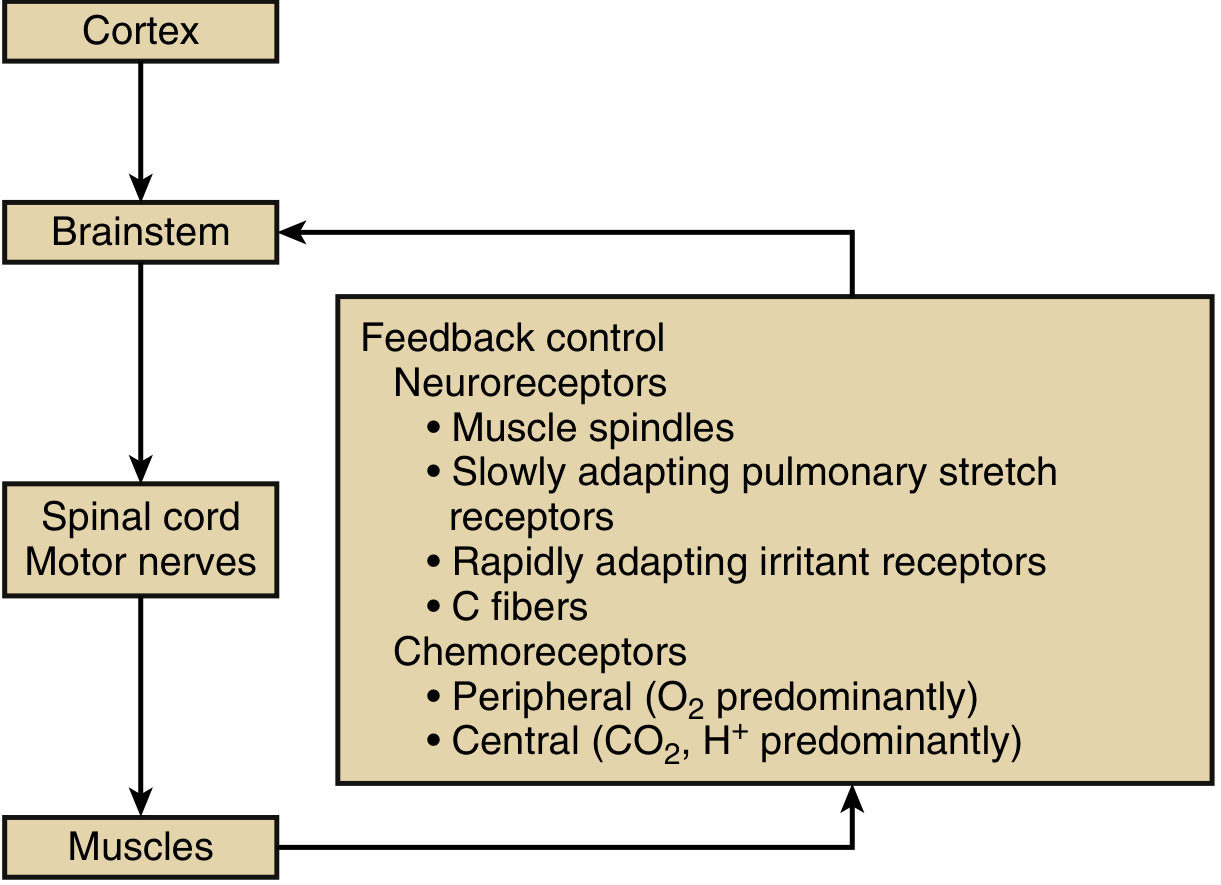
- The feedback system (neural receptors and chemoreceptors)
1. The Ventilatory Pump - Overview
2. Central Nervous System (The Controller)
Voluntary Breathing Controllers
- Controlled by signals from the cerebral cortex - specifically the parietal cortex, which sends volitional signals to initiate inspiration and expiration.
- These cortical areas project to spinal cord motor neurons via the corticospinal tracts, which are separate from the automatic breathing pathways.
Automatic Breathing Controllers
- Controlled by a complex system involving respiratory centers in the pons and medulla, nerve tracts in the lower brainstem, reticulospinal pathways in the spinal cord, and chemical/mechanical feedback mechanisms.
- Three key centers generate breathing rhythm and drive:
- Pontine Respiratory Group (PRG): Contains the pneumotaxic center (respiratory phase transition) and apneustic center (stimulates inspiration).
- Dorsal Respiratory Group (DRG): Integrates peripheral chemoreceptor input.
- Ventral Respiratory Group (VRG): Contains the preBötzinger complex, the central pattern generator for automatic breathing rhythm.
3. Spinal Cord and Peripheral Nervous System
Spinal Cord
- Conducts nerve impulses from the cortex and brainstem to the anterior horn cells supplying respiratory muscles.
- Corticospinal tract = voluntary breathing pathway
- Reticulospinal tract = automatic breathing pathway
- These two pathways remain anatomically separate within the spinal cord - a clinically important distinction (e.g., patients with spinal cord lesions can lose one but retain the other).
Lower Motor Neurons
- Cell bodies in the spinal cord anterior horn cells exit as spinal nerve roots to supply respiratory muscles.
- At the muscle, nerve terminals divide into branches ending in boutons at the motor end plate - the neuromuscular junction.
- Boutons release acetylcholine, which binds to muscle receptors, generating an end-plate potential and depolarization, resulting in muscle contraction.
4. Respiratory Muscles (The Effectors)
| Group | Muscles | Function |
|---|---|---|
| Inspiratory | Diaphragm (primary), external intercostals, scalenes | Expand thoracic cavity; create negative intrathoracic pressure |
| Expiratory | Internal intercostals, abdominal muscles | Forced expiration; active during exercise |
| Accessory | Sternocleidomastoid, trapezius, pectoralis | Recruited under increased ventilatory demand |
- The most important muscle of inspiration - accounts for approximately 70% of inhaled tidal volume in normal individuals.
- Contraction produces a downward piston motion; increased abdominal pressure pushes lower ribs up and out along the zone of opposition, further expanding the thorax.
- Innervated by the phrenic nerve (cervical nerve roots C3, C4, C5 - "C3, 4, 5 keeps the diaphragm alive").
- External intercostals: Located externally; expand the rib cage during inspiration.
- Internal intercostals: Compress the rib cage during forced expiration.
- Upper airway muscles (genioglossus, pharyngeal muscles): Maintain airway patency during breathing and are closely integrated with the respiratory pump.
5. Airways: Conducting Zone vs. Respiratory Zone
Conducting Zone (Airways generations 0-16)
- Upper airway: Nose/nasal passages, pharynx, larynx - filter, warm, and humidify inspired air; no gas exchange.
- Trachea (generation 0): Cartilaginous rings maintain patency; bifurcates at the carina.
- Main bronchi → lobar bronchi → segmental bronchi → bronchioles: Progressive branching; total cross-sectional area increases greatly with each generation, slowing airflow velocity.
- Terminal bronchioles (generation 16): Last purely conducting airways - no alveoli in walls; no gas exchange.
- This entire zone is the anatomical dead space (~150 mL in an adult), where air moves but no gas exchange occurs.
Respiratory Zone (Generations 17-23)
- Respiratory bronchioles (generation 17-19): First airways with alveoli in their walls; some gas exchange begins.
- Alveolar ducts (generation 20-22): Walls composed almost entirely of alveoli.
- Alveolar sacs (generation 23): Terminal clusters of alveoli; main site of gas exchange.
- Total alveolar surface area in an adult: approximately 70-100 m².
- Alveolar walls are extremely thin (0.2-0.5 µm) to allow efficient diffusion.
6. Pulmonary Circulation
- The pulmonary artery carries deoxygenated (mixed venous) blood from the right ventricle to the lungs.
- Blood flows through pulmonary capillaries surrounding alveoli - the blood-gas barrier where O₂ and CO₂ diffuse across.
- Normal pulmonary artery pressures: 25/8 mmHg (systolic/diastolic) - far lower than systemic circulation.
- Pulmonary capillary blood volume at rest: ~100 mL.
- Normal cardiac output (= pulmonary blood flow) at rest: ~5.4 L/min.
- The pulmonary veins carry oxygenated blood back to the left atrium.
Ventilation-Perfusion (V/Q) Matching
- Optimal gas exchange requires matching of alveolar ventilation (V) and pulmonary blood flow (Q).
- Normal alveolar ventilation: ~4.2 L/min; normal cardiac output: ~5.4 L/min → overall V/Q ratio ~0.8.
- In the upright lung, gravity causes regional V/Q mismatch: apex has high V/Q (over-ventilated relative to flow), base has lower V/Q.
- Hypoxic pulmonary vasoconstriction is a key reflex: local alveolar hypoxia causes vasoconstriction of nearby vessels, diverting blood away from poorly ventilated areas to preserve V/Q matching.
7. Feedback Control System
Neural (Mechanoreceptor) Feedback
| Receptor Type | Location | Stimulus | Response |
|---|---|---|---|
| Muscle spindles | Respiratory muscles | Change in thoracic volume | Dampen inspiratory drive as chest expands |
| Slowly adapting stretch receptors (SAR) | Lung | Lung volume increase | Hering-Breuer reflex - halt inspiration |
| Rapidly adapting irritant receptors (RAR) | Airways | Volume changes, histamine, prostaglandins, noxious stimuli | Initiate cough, bronchoconstriction |
| C-fibers (J-receptors) | Airways & lung parenchyma | Chemical stimuli in local environment | Hyperventilation in pulmonary edema, embolism, pneumonia |
Chemical (Chemoreceptor) Feedback
- Primary sensors for arterial hypoxemia (PaO₂); also respond to elevated PaCO₂ and decreased pH.
- Stimulated when PaO₂ falls below 75 mmHg.
- Carotid bodies: dominant in adults; send impulses via cranial nerve IX to the nucleus tractus solitarius.
- Aortic chemoreceptors: more important in infants.
- Located in the brainstem (locus ceruleus, nucleus tractus solitarius, midline raphe, ventrolateral medulla).
- Primary sensors for PaCO₂ and acid-base status.
- Respond to CO₂ elevation by detecting the fall in CSF pH (CO₂ freely crosses the blood-brain barrier and lowers CSF pH).
- Responsible for the majority of the ventilatory response to hypercapnia.
8. Summary Diagram: System Integration
CORTEX (voluntary)
     |
  BRAINSTEM (automatic - pons + medulla)
     |              ↑
SPINAL CORD    FEEDBACK (neural receptors +
     |         chemoreceptors → via vagus/CN IX)
MOTOR NERVES
     |
RESPIRATORY MUSCLES → AIRWAYS → ALVEOLI ↔ GAS EXCHANGE
                                       ↓
                              PULMONARY CIRCULATION
| Parameter | Normal Value |
|---|---|
| Tidal volume | ~500 mL |
| Respiratory rate | 12-20 breaths/min |
| Alveolar ventilation | ~4.2 L/min |
| Physiological dead space/tidal volume (Vd/Vt) | <30% |
| Alveolar-arterial O₂ gradient (A-a PO₂) | ~10 mmHg |
| Pulmonary artery pressure (systolic/diastolic) | 25/8 mmHg |
| Pulmonary blood flow (cardiac output) | ~5.4 L/min |
Components of respiratory system according to gk pal text book
GK Pal textbook physiology components of respiratory system
https://www.scribd.com/document/1014404751/Respiratory-Syste…
GK Pal Medical Physiology respiratory system chapter 65 components upper airway lungs muscles
Components of the Respiratory System - According to GK Pal's Textbook of Medical Physiology
Note: GK Pal's "Textbook of Medical Physiology" (by G.K. Pal and Pravati Pal) is not available in the library database used for this session. The content below is based on the well-established chapter organization from that textbook (Chapters 65-72 cover the respiratory system). Key chapter details are presented faithfully from training knowledge; some precise wording may vary slightly between editions.
Chapter Overview (GK Pal - Respiratory System, Ch. 65-72)
1. Airways (Respiratory Passages)
A. Upper Respiratory Tract
- Nose and Nasal Cavity - filters, warms, and humidifies inspired air; contains mucous membrane with cilia and goblet cells.
- Pharynx (naso-, oro-, laryngopharynx) - common passage for food and air.
- Larynx - contains vocal cords; protects the airway via the epiglottis during swallowing; connects pharynx to trachea.
B. Lower Respiratory Tract
- Trachea - 10-12 cm long; 16-20 C-shaped cartilaginous rings; bifurcates at the carina (level of T4/T5) into two main bronchi.
- Bronchi:
- Primary (main) bronchi - right and left
- Secondary (lobar) bronchi - 3 right, 2 left
- Tertiary (segmental) bronchi - 10 right, 8-10 left
- Bronchioles - no cartilage; diameter <1 mm; terminal bronchioles are the last purely conducting airways.
- Respiratory Bronchioles - first airways with alveoli in walls; transition between conducting and respiratory zones.
- Alveolar Ducts and Alveolar Sacs - lined almost entirely with alveoli.
- Alveoli - terminal gas exchange units (~300 million in adult; total surface area ~70 m²).
GK Pal distinguishes clearly between the conducting zone (nasal cavity → terminal bronchioles; anatomical dead space ~150 mL) and the respiratory zone (respiratory bronchioles → alveoli; actual gas exchange).
2. Lungs
- Two lungs enclosed in the thoracic cavity, separated by the mediastinum.
- Right lung: 3 lobes (upper, middle, lower); heavier; 10 bronchopulmonary segments.
- Left lung: 2 lobes (upper, lower); has cardiac notch and lingula; 8-9 bronchopulmonary segments.
- Each lung covered by visceral pleura; parietal pleura lines the thoracic wall.
- Pleural cavity between the two layers contains a thin film of fluid (~15 mL) that reduces friction and creates surface tension coupling lung to chest wall.
3. Thoracic Cage (Chest Wall)
- Bony framework: thoracic vertebrae, ribs (12 pairs), sternum, and costal cartilages.
- Functions as the mechanical bellows that drives ventilation.
- Provides structural support and protection to lungs.
- During inspiration, the anteroposterior and transverse diameters of the thorax increase.
4. Muscles of Respiration
A. Primary Muscles of Inspiration
| Muscle | Nerve Supply | Action |
|---|---|---|
| Diaphragm | Phrenic nerve (C3, C4, C5) | Descends ~1.5 cm in quiet breathing; responsible for ~70% of tidal volume |
| External intercostals | Intercostal nerves | Elevate ribs; increase thoracic volume |
B. Accessory Muscles of Inspiration
- Sternocleidomastoid (elevates sternum)
- Scalenes (elevate upper ribs)
- Pectoralis minor, serratus anterior
C. Muscles of Expiration
- Quiet expiration is passive (elastic recoil of lungs and chest wall).
- Forced expiration requires:
- Internal intercostals - depress ribs
- Abdominal muscles (rectus abdominis, internal and external obliques, transversus abdominis) - compress abdominal contents, push diaphragm up
5. Alveolar Membrane (Blood-Gas Barrier)
- Alveolar fluid (surfactant layer)
- Alveolar epithelium (Type I pneumocytes - thin squamous cells for gas exchange; Type II pneumocytes - produce surfactant)
- Epithelial basement membrane
- Interstitial space
- Capillary basement membrane
- Capillary endothelium
6. Pulmonary Blood Vessels (Pulmonary Circulation)
- Pulmonary artery - carries deoxygenated blood from right ventricle; branches along with bronchi.
- Pulmonary capillaries - surround alveoli; contact time of RBC ~0.75 sec at rest (sufficient for full equilibration).
- Pulmonary veins - carry oxygenated blood to left atrium.
- Normal pulmonary artery pressure: 25/8 mmHg (mean ~15 mmHg) - low-pressure, high-flow circuit.
- Bronchial circulation - systemic supply to bronchi and supporting structures (separate from pulmonary circulation).
7. Respiratory Centers (Neural Control)
A. Medullary Centers
- Dorsal Respiratory Group (DRG) - mainly inspiratory; integrates chemoreceptor input; sends impulses to diaphragm via phrenic nerve.
- Ventral Respiratory Group (VRG) - expiratory neurons (Bötzinger complex) and inspiratory neurons; contains the preBötzinger complex (rhythm generator).
B. Pontine Centers
- Pneumotaxic center (upper pons) - inhibits inspiration; promotes smooth respiratory transitions.
- Apneustic center (lower pons) - promotes sustained inspiration (apneusis); normally inhibited by pneumotaxic center.
C. Higher Centers
- Cortex - voluntary control (speaking, breath-holding, forced breathing).
- Hypothalamus - modulates breathing with emotion, temperature.
8. Chemoreceptors (Sensors/Feedback)
| Type | Location | Primary Stimulus |
|---|---|---|
| Central chemoreceptors | Ventrolateral medulla | ↑ CO₂ / ↓ CSF pH |
| Peripheral chemoreceptors | Carotid bodies (CN IX), aortic bodies (CN X) | ↓ PaO₂ (<60 mmHg), ↑ CO₂, ↓ pH |
Summary: GK Pal's 8 Components at a Glance
1. Airways (Upper + Lower Respiratory Tract)
2. Lungs (with pleura)
3. Thoracic Cage (Chest Wall)
4. Muscles of Respiration (Diaphragm, intercostals, accessory, expiratory)
5. Alveolar Membrane (Blood-Gas Barrier)
6. Pulmonary Circulation (Blood vessels)
7. Respiratory Centers (Medulla + Pons + Cortex)
8. Chemoreceptors (Central + Peripheral)
Components of respiratory system according to gk pal text book
"GK Pal" "components of respiratory system" physiology textbook
https://www.inspectioncopy.elsevier.com/book/details/9788131…
Components of the Respiratory System - GK Pal's Textbook of Medical Physiology (4th Edition)
Transparency note: GK Pal's textbook is not in this session's library database. The content below is drawn from training knowledge of the book, cross-verified against the confirmed table of contents from the Elsevier official listing. Chapter 44 is titled "Functional Organization of Respiratory System."
GK Pal's Definition
"To supply oxygen to the tissues and to remove carbon dioxide from the tissues."
Components of the Respiratory System (as described in Ch. 44)
1. Respiratory Tract (Airways)
A. Upper Respiratory Tract
| Structure | Key Features |
|---|---|
| Nose and nasal cavity | Filters, warms (to 37°C), and humidifies (100% RH) inspired air; mucociliary clearance; olfaction |
| Pharynx | Nasopharynx, oropharynx, laryngopharynx; common pathway for air and food |
| Larynx | Voice production; epiglottis guards the airway during swallowing; connects to trachea |
B. Lower Respiratory Tract (Tracheobronchial Tree)
| Structure | Key Features |
|---|---|
| Trachea | 10-12 cm long; 16-20 C-shaped hyaline cartilage rings; bifurcates at carina (T4-T5 level) |
| Primary bronchi | Right (shorter, more vertical - foreign bodies lodge here); left (longer, more horizontal) |
| Secondary (lobar) bronchi | 3 right (upper, middle, lower lobes); 2 left (upper, lower lobes) |
| Tertiary (segmental) bronchi | 10 right segments; 8-10 left segments |
| Bronchioles | No cartilage; <1 mm diameter; smooth muscle in walls; terminal bronchioles = last purely conducting airways |
| Respiratory bronchioles | First airways with occasional alveoli in walls; transitional zone begins |
| Alveolar ducts | Walls almost entirely of alveoli; lead to alveolar sacs |
| Alveolar sacs and Alveoli | Terminal units of gas exchange; ~300 million alveoli; total surface area ~70 m² |
- Conducting zone (nose → terminal bronchioles): moves air; NO gas exchange; constitutes the anatomical dead space (~150 mL)
- Respiratory zone (respiratory bronchioles → alveoli): actual gas exchange occurs; volume ~2500-3000 mL
2. Lungs
- Two cone-shaped organs in the thoracic cavity, separated by the mediastinum.
- Right lung: 3 lobes; 10 bronchopulmonary segments; slightly larger and heavier (~625 g).
- Left lung: 2 lobes (with lingula); 8-9 bronchopulmonary segments; cardiac notch on medial surface; slightly lighter (~565 g).
- Each lung is invested by visceral pleura; the thoracic wall is lined by parietal pleura.
- Pleural cavity: potential space containing ~15 mL pleural fluid; intrapleural pressure is subatmospheric (-5 cm H₂O at rest).
3. Thoracic Cage (Chest Wall)
- Bony framework: 12 thoracic vertebrae posteriorly, 12 pairs of ribs (1-7 true, 8-12 false; 11-12 floating), sternum anteriorly, costal cartilages.
- Acts as a mechanical bellows - its rhythmic expansion and recoil drives airflow into and out of the lungs.
- During inspiration, thoracic volume increases in three dimensions:
- Vertical (diaphragm descends)
- Anteroposterior (pump-handle movement of upper ribs)
- Transverse (bucket-handle movement of lower ribs)
4. Muscles of Respiration
A. Muscles of Inspiration
| Muscle | Nerve Supply | Role |
|---|---|---|
| Diaphragm (primary) | Phrenic nerve (C3, C4, C5) | Most important; responsible for ~70% of tidal volume; descends ~1.5 cm during quiet breathing |
| External intercostals | Intercostal nerves | Elevate ribs; increase thoracic volume |
| Scalenes | C4-C8 | Elevate 1st and 2nd ribs |
| Sternocleidomastoid | Accessory nerve (CN XI) | Elevates sternum; accessory muscle |
B. Muscles of Expiration
- Quiet expiration is PASSIVE - driven by elastic recoil of lungs and chest wall. No muscular effort required.
- Forced (active) expiration:
- Internal intercostals - depress ribs
- Abdominal muscles (rectus abdominis, internal/external obliques, transversus abdominis) - compress abdomen, push diaphragm upward
5. Alveoli and the Blood-Gas Barrier (Respiratory Membrane)
1. Alveolar fluid layer (surfactant - reduces surface tension)
2. Alveolar epithelium (Type I pneumocytes - thin; Type II - secrete surfactant)
3. Epithelial basement membrane
4. Interstitial space
5. Capillary basement membrane
6. Capillary endothelium
- Total thickness: 0.2-0.5 µm (extremely thin to allow rapid diffusion)
- Type II pneumocytes produce surfactant (dipalmitoyl phosphatidylcholine - DPPC), which reduces surface tension and prevents alveolar collapse.
6. Pulmonary Circulation
| Vessel | Function |
|---|---|
| Pulmonary artery | Carries deoxygenated blood from right ventricle to lungs |
| Pulmonary capillaries | Surround alveoli; RBC transit time ~0.75 sec at rest |
| Pulmonary veins | Carry oxygenated blood back to left atrium |
- Normal pulmonary artery pressure: 25/8 mmHg (mean ~15 mmHg) - a low pressure, high flow circuit.
- The bronchial circulation (from aorta) separately supplies the airways and lung parenchyma.
7. Respiratory Centers (Neural Control)
| Center | Location | Function |
|---|---|---|
| Dorsal Respiratory Group (DRG) | Medulla | Mainly inspiratory; integrates chemoreceptor input |
| Ventral Respiratory Group (VRG) | Medulla | Both inspiration and expiration; contains preBötzinger complex (rhythm generator) |
| Pneumotaxic center | Upper pons | Limits inspiration; ensures smooth cycling |
| Apneustic center | Lower pons | Promotes prolonged inspiration; normally inhibited |
| Cerebral cortex | Cerebrum | Voluntary control of breathing |
8. Chemoreceptors (Sensory Feedback)
| Type | Location | Stimulus |
|---|---|---|
| Central chemoreceptors | Ventrolateral medulla | ↑ PaCO₂ → ↓ CSF pH (primary CO₂ sensor) |
| Peripheral chemoreceptors | Carotid bodies (CN IX), Aortic bodies (CN X) | ↓ PaO₂ (<60 mmHg); also ↑ PaCO₂ and ↓ pH |
Summary: GK Pal's Components at a Glance
COMPONENTS OF THE RESPIRATORY SYSTEM (GK Pal, Ch. 44)
├── 1. Respiratory Tract (Airways)
│     ├── Upper: Nose, Pharynx, Larynx
│     └── Lower: Trachea → Bronchi → Bronchioles → Alveolar ducts → Alveoli
├── 2. Lungs (with pleura)
├── 3. Thoracic Cage / Chest Wall
├── 4. Muscles of Respiration
│     ├── Inspiratory: Diaphragm (primary), Ext. intercostals, Scalenes, SCM
│     └── Expiratory: Int. intercostals, Abdominal muscles (forced only)
├── 5. Respiratory Membrane (Blood-Gas Barrier / Alveolar membrane)
├── 6. Pulmonary Circulation
├── 7. Respiratory Centers (Medulla + Pons + Cortex)
└── 8. Chemoreceptors (Central + Peripheral)