

5f682b22-6537-4b98-8880-1787d8bbf4c8.jpeg
2nd question answer pls for 15 marks university exam
Reading File
Finding Sources
Finding Sources
Finding Sources
Finding Sources
Reading File
Reading File
Finding Sources
Reading File
Reading File
Reading File
Reading File
Reading File
Reading File
Reading File
Reading File
Reading File
Reading File
Loading Image
Reading File
I now have all the information needed. Let me compile a comprehensive 15-mark answer.
Q2: Conduction System of Heart | Cardiac Action Potential | Heart Block
PART 1: CONDUCTION SYSTEM OF THE HEART
The conduction system is a network of specialized cardiac muscle cells (conducting cells) that generate and rapidly transmit electrical impulses throughout the myocardium in a precise sequence, ensuring coordinated contraction of the heart.
Components and Sequence of Activation
The action potential spreads through the heart in the following order:
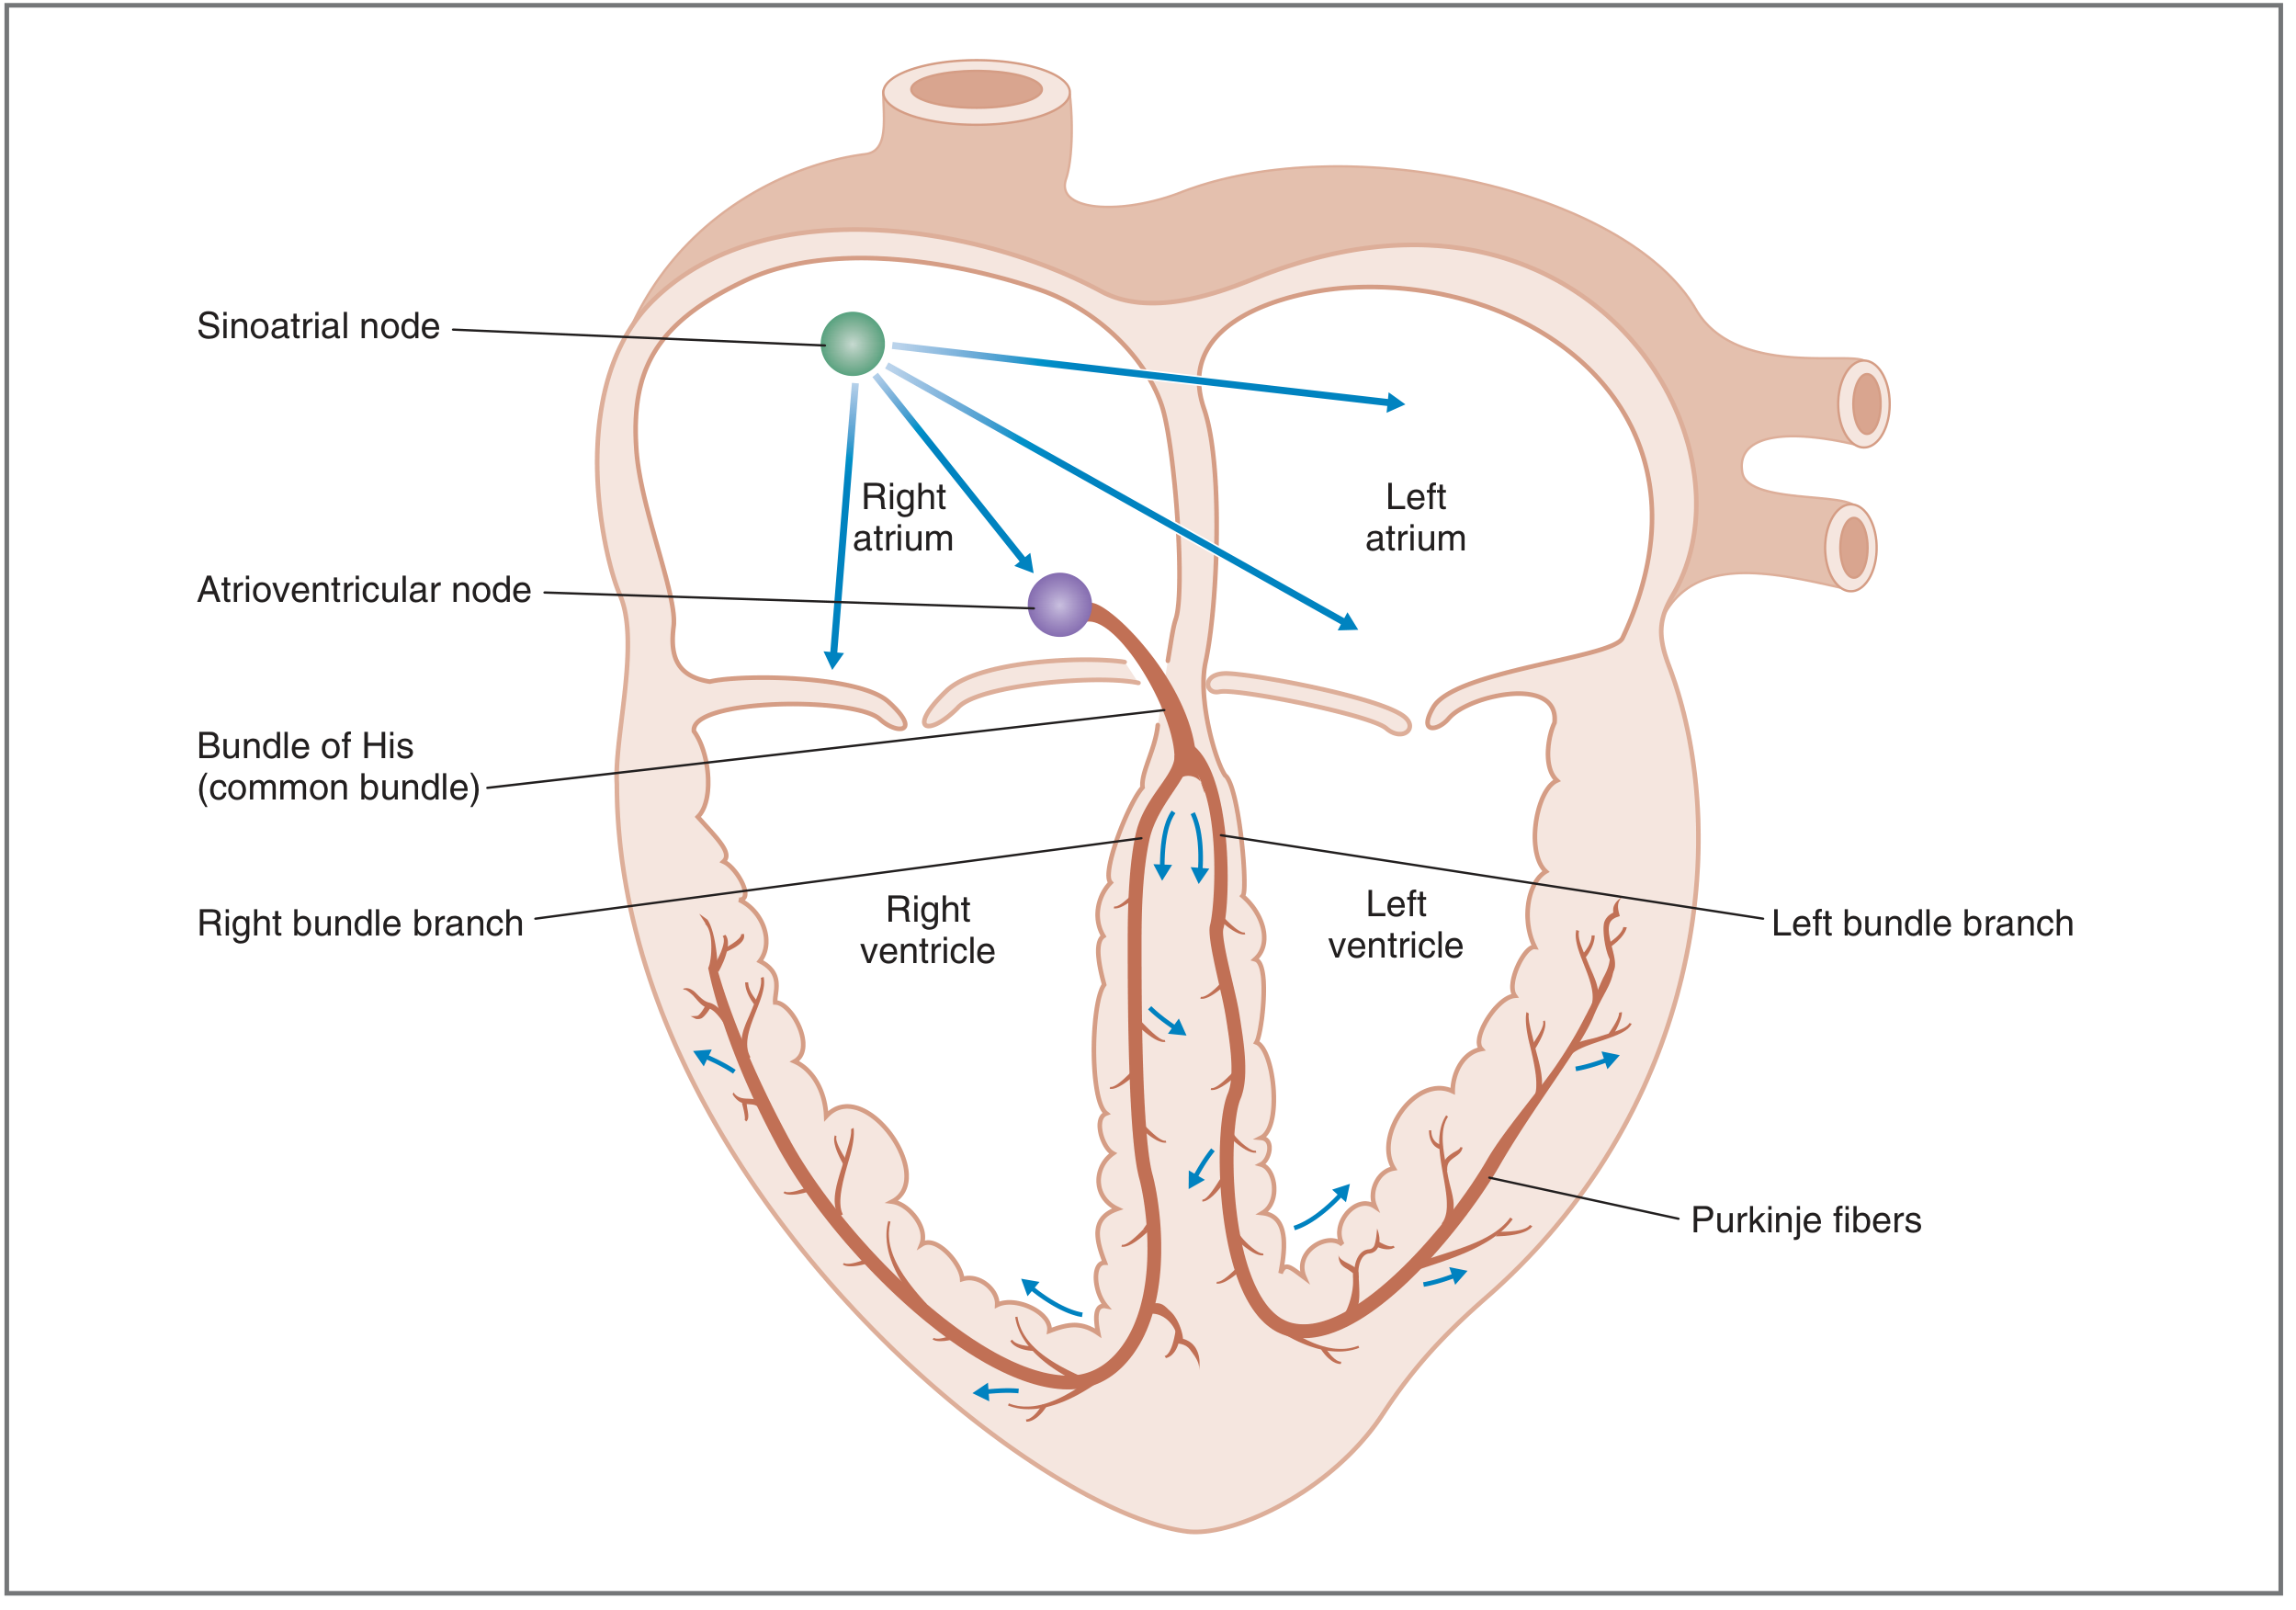
Fig. 4.11 - Sequence of activation of the myocardium (Costanzo Physiology)
1. Sinoatrial (SA) Node - The Pacemaker
- Located in the posterior wall of the right atrium, near the opening of the superior vena cava
- Acts as the dominant pacemaker of the heart (intrinsic rate: 60-100 beats/min)
- Fires spontaneously due to its unstable resting membrane potential (automaticity)
- Has the fastest rate of phase 4 (spontaneous) depolarization of all conducting cells
- Suppresses all other latent pacemakers via overdrive suppression
2. Atrial Internodal Tracts and Atria
- Impulse spreads from the SA node to the right and left atria via the internodal tracts (anterior, middle, and posterior)
- The atria depolarize and contract
- Simultaneously, the impulse travels to the AV node
3. Atrioventricular (AV) Node
- Located in the lower interatrial septum, above the tricuspid valve
- Conduction velocity here is very slow: 0.01-0.05 m/s (slowest in the heart)
- This AV delay (~100 ms) is physiologically important - it ensures the ventricles have enough time to fill with blood before they are activated
- Intrinsic rate if it acts as pacemaker: 40-60 beats/min
- Acts as the only normal electrical bridge between atria and ventricles
4. Bundle of His (AV Bundle)
- Arises from the AV node and passes through the fibrous skeleton of the heart
- Divides into the right bundle branch (for right ventricle) and left bundle branch (for left ventricle)
5. Left and Right Bundle Branches
- Run along the interventricular septum toward the apex
- The left bundle branch further divides into the left anterior fascicle and left posterior fascicle
6. Purkinje Fibers
- Fine network of fibers spreading from the bundle branches to the subendocardial myocardium
- Conduction velocity is the fastest: 2-4 m/s
- Rapidly and simultaneously distribute impulses to the ventricular myocardium from the apex upward, ensuring efficient ventricular contraction and blood ejection
Summary of Intrinsic Rates (Latent Pacemakers)
| Structure | Intrinsic Rate |
|---|---|
| SA node | 60-100/min |
| AV node / Bundle of His | 40-60/min |
| Purkinje fibers / Ventricles | 20-40/min |
The pacemaker with the fastest rate controls heart rate. Under normal conditions, the SA node dominates. If the SA node fails, a latent pacemaker (ectopic focus) takes over.
PART 2: CARDIAC ACTION POTENTIAL
There are two distinct types of cardiac action potentials:
A. Action Potential of Ventricular Muscle (Fast-Response)
This applies to ventricular cells, atrial cells, and Purkinje fibers. It has 5 phases (0-4):
Phase 0 - Upstroke (Rapid Depolarization)
- Triggered when threshold (~-70 mV) is reached
- Rapid opening of voltage-gated fast Na+ channels → massive Na+ influx (INa)
- Membrane potential rapidly rises from -90 mV to approximately +20 mV
- This is the fastest phase; rate of rise (dV/dT) is highest when the resting potential is most negative
Phase 1 - Initial Repolarization
- Brief, rapid repolarization immediately after the upstroke
- Caused by: (a) inactivation of Na+ channels (inactivation gates close) and (b) transient outward K+ current (K+ leaves cell down its electrochemical gradient)
Phase 2 - Plateau
- Unique feature of cardiac action potential (absent in nerve/skeletal muscle)
- Lasts 150-200 ms; membrane potential remains stably depolarized (~0 mV)
- Maintained by a balance: inward Ca2+ current (via L-type Ca2+ channels) = outward K+ current
- The Ca2+ entry during this phase triggers Ca2+-induced Ca2+ release from the sarcoplasmic reticulum, initiating contraction (excitation-contraction coupling)
- L-type Ca2+ channels are blocked by nifedipine, diltiazem, and verapamil
Phase 3 - Repolarization
- Gradual then rapid return to resting potential
- Caused by: (a) decrease in Ca2+ conductance (gCa falls → inward Ca2+ current stops) and (b) increase in K+ conductance (gK rises → large outward K+ current, IK)
- Membrane potential returns to -90 mV
Phase 4 - Resting Membrane Potential
- Stable at approximately -90 mV in ventricular cells
- High K+ conductance (IK1) drives membrane toward K+ equilibrium potential
- Inward Na+ and Ca2+ currents balance the outward K+ current
- No spontaneous depolarization in ventricular cells (unlike SA node)
B. Action Potential of SA Node (Slow-Response / Pacemaker Potential)
The SA node action potential differs significantly:
| Feature | SA Node | Ventricular Fiber |
|---|---|---|
| Resting potential | Unstable (~-65 mV) | Stable (-90 mV) |
| Upstroke (Phase 0) | Slow; due to Ca2+ influx (L-type) | Fast; due to Na+ influx |
| Phases 1 and 2 | Absent | Present |
| Phase 4 | Spontaneous depolarization | No spontaneous depolarization |
Phase 4 - Pacemaker Potential (Most Important)
- The maximum diastolic potential is approximately -65 mV
- There is slow, spontaneous depolarization caused by:
- Opening of funny current (If) channels (also called HCN channels): carry inward Na+ current
- Gradual decrease in K+ conductance (as K+ channels close after repolarization)
- Gradual increase in T-type Ca2+ current
- This slow depolarization brings the membrane to threshold (~-40 mV), triggering the next action potential automatically
- This is the basis of automaticity - the heart's ability to beat without external input
Refractory Periods
- Absolute Refractory Period (ARP): Spans phases 0, 1, 2, and most of phase 3. No stimulus can trigger another action potential. Most Na+ channels are inactivated. Prevents tetanic contraction of cardiac muscle.
- Relative Refractory Period (RRP): Late phase 3. A stronger-than-normal stimulus can trigger an action potential. Some Na+ channels have recovered.
- Supranormal Period: Brief period after RRP where a weaker-than-normal stimulus can trigger an action potential.
PART 3: NOTE ON HEART BLOCK
Heart block refers to a delay or complete failure of impulse conduction, most commonly at the AV node or Bundle of His.
Causes
- Ischemia of the AV node or bundle (e.g., coronary artery disease)
- Compression by scar tissue or calcified cardiac structures
- Inflammation - rheumatic fever, myocarditis, diphtheria
- Vagal overstimulation (carotid sinus syndrome)
- Degenerative changes in the elderly
- Drugs - digitalis, beta-blockers, calcium channel blockers
Classification of AV (Heart) Block
1. First-Degree Heart Block
- Definition: Delayed but uninterrupted conduction through the AV node
- ECG: P-R interval prolonged to >0.20 sec (normal: 0.16 sec)
- Every P wave is followed by a QRS complex
- Usually benign; often requires no treatment
2. Second-Degree Heart Block
There are two subtypes:
Mobitz Type I (Wenckebach):
- Progressive prolongation of P-R interval with each beat until one QRS is dropped (non-conducted P wave)
- After the dropped beat, P-R interval resets and the cycle repeats
- Caused by abnormality of the AV node
- Usually benign
Mobitz Type II:
- P-R interval remains fixed, but periodically a P wave is not followed by a QRS (e.g., 2:1, 3:1 block)
- Caused by abnormality of the Bundle of His-Purkinje system
- More serious; may progress to complete heart block
- Pacemaker implantation often required
3. Third-Degree (Complete) Heart Block
- No conduction from atria to ventricles
- Atria and ventricles beat independently (AV dissociation)
- ECG: P waves and QRS complexes are completely dissociated
- Ventricular rate is driven by a ventricular escape pacemaker: 20-40 beats/min
- Patient presents with syncope, dizziness, or Stokes-Adams attacks
- Definitive treatment: Permanent pacemaker implantation
ECG Summary
| Block Type | P-R Interval | QRS | Key Feature |
|---|---|---|---|
| 1st degree | Prolonged (>0.20s) | Normal | All P waves conducted |
| 2nd degree (Mobitz I) | Progressively prolonged | Dropped beat | Wenckebach pattern |
| 2nd degree (Mobitz II) | Fixed (normal/prolonged) | Dropped beat | Fixed ratio (2:1, 3:1) |
| 3rd degree (Complete) | No relation | Slow escape rhythm | P-QRS dissociation |
Sources: Costanzo Physiology 7th Edition; Guyton and Hall Textbook of Medical Physiology

002e1264-55c9-455f-9547-990930319b50.jpeg
3rd and 4th question give to answers for university examination
Finding Sources
Finding Sources
Finding Sources
Finding Sources
Define cardican output, describe the factors affecting cardiac output in detail mention ways to measure it
Reading File
Finding Sources
Finding Sources
Reading File
Finding Sources
Reading File
Finding Sources
Finding Sources
Reading File
Reading File
Finding Sources
Finding Sources
Finding Sources
Reading File
Finding Sources
Reading File
Loading Image
I now have all the core content needed. Let me compile the full, exam-ready answer.
Q3: Cardiac Output — Definition, Factors, and Measurement
DEFINITION
Cardiac Output (CO) is defined as the total volume of blood ejected by the left ventricle per minute.
Formula:
Cardiac Output = Stroke Volume × Heart Rate
| Parameter | Normal Value |
|---|---|
| Cardiac Output | ~5000 mL/min (5 L/min) |
| Stroke Volume | ~70 mL/beat |
| Heart Rate | ~72 beats/min |
Ejection Fraction (EF) = Stroke Volume / End-Diastolic Volume = 70/140 = ~0.5 (50%)
Cardiac Index = Cardiac Output / Body Surface Area = ~3.2 L/min/m² (normalizes CO for body size)
- End-Diastolic Volume (EDV): Volume in ventricle at end of diastole (~140 mL)
- End-Systolic Volume (ESV): Volume remaining after ejection (~70 mL)
- Stroke Volume = EDV - ESV
FACTORS AFFECTING CARDIAC OUTPUT
Cardiac output is determined by two main variables: Stroke Volume and Heart Rate. Stroke volume is itself governed by three factors: preload, afterload, and contractility.
A. FACTORS AFFECTING STROKE VOLUME
1. PRELOAD (End-Diastolic Volume / Venous Return)
- Preload is the degree of stretching of the ventricular muscle fibers just before contraction - it corresponds to the end-diastolic volume (EDV)
- The relationship between preload and stroke volume is explained by the Frank-Starling Law of the Heart
Frank-Starling Law:
The volume ejected by the ventricle in systole is directly proportional to the end-diastolic volume (venous return).
- As venous return increases → EDV increases → ventricular fibers are stretched → increased overlap of actin-myosin filaments → greater cross-bridge formation → greater force of contraction → increased stroke volume and cardiac output
- This ensures cardiac output equals venous return in the steady state
- In the physiologic range, the relationship is nearly linear; only at very high EDV does the curve flatten
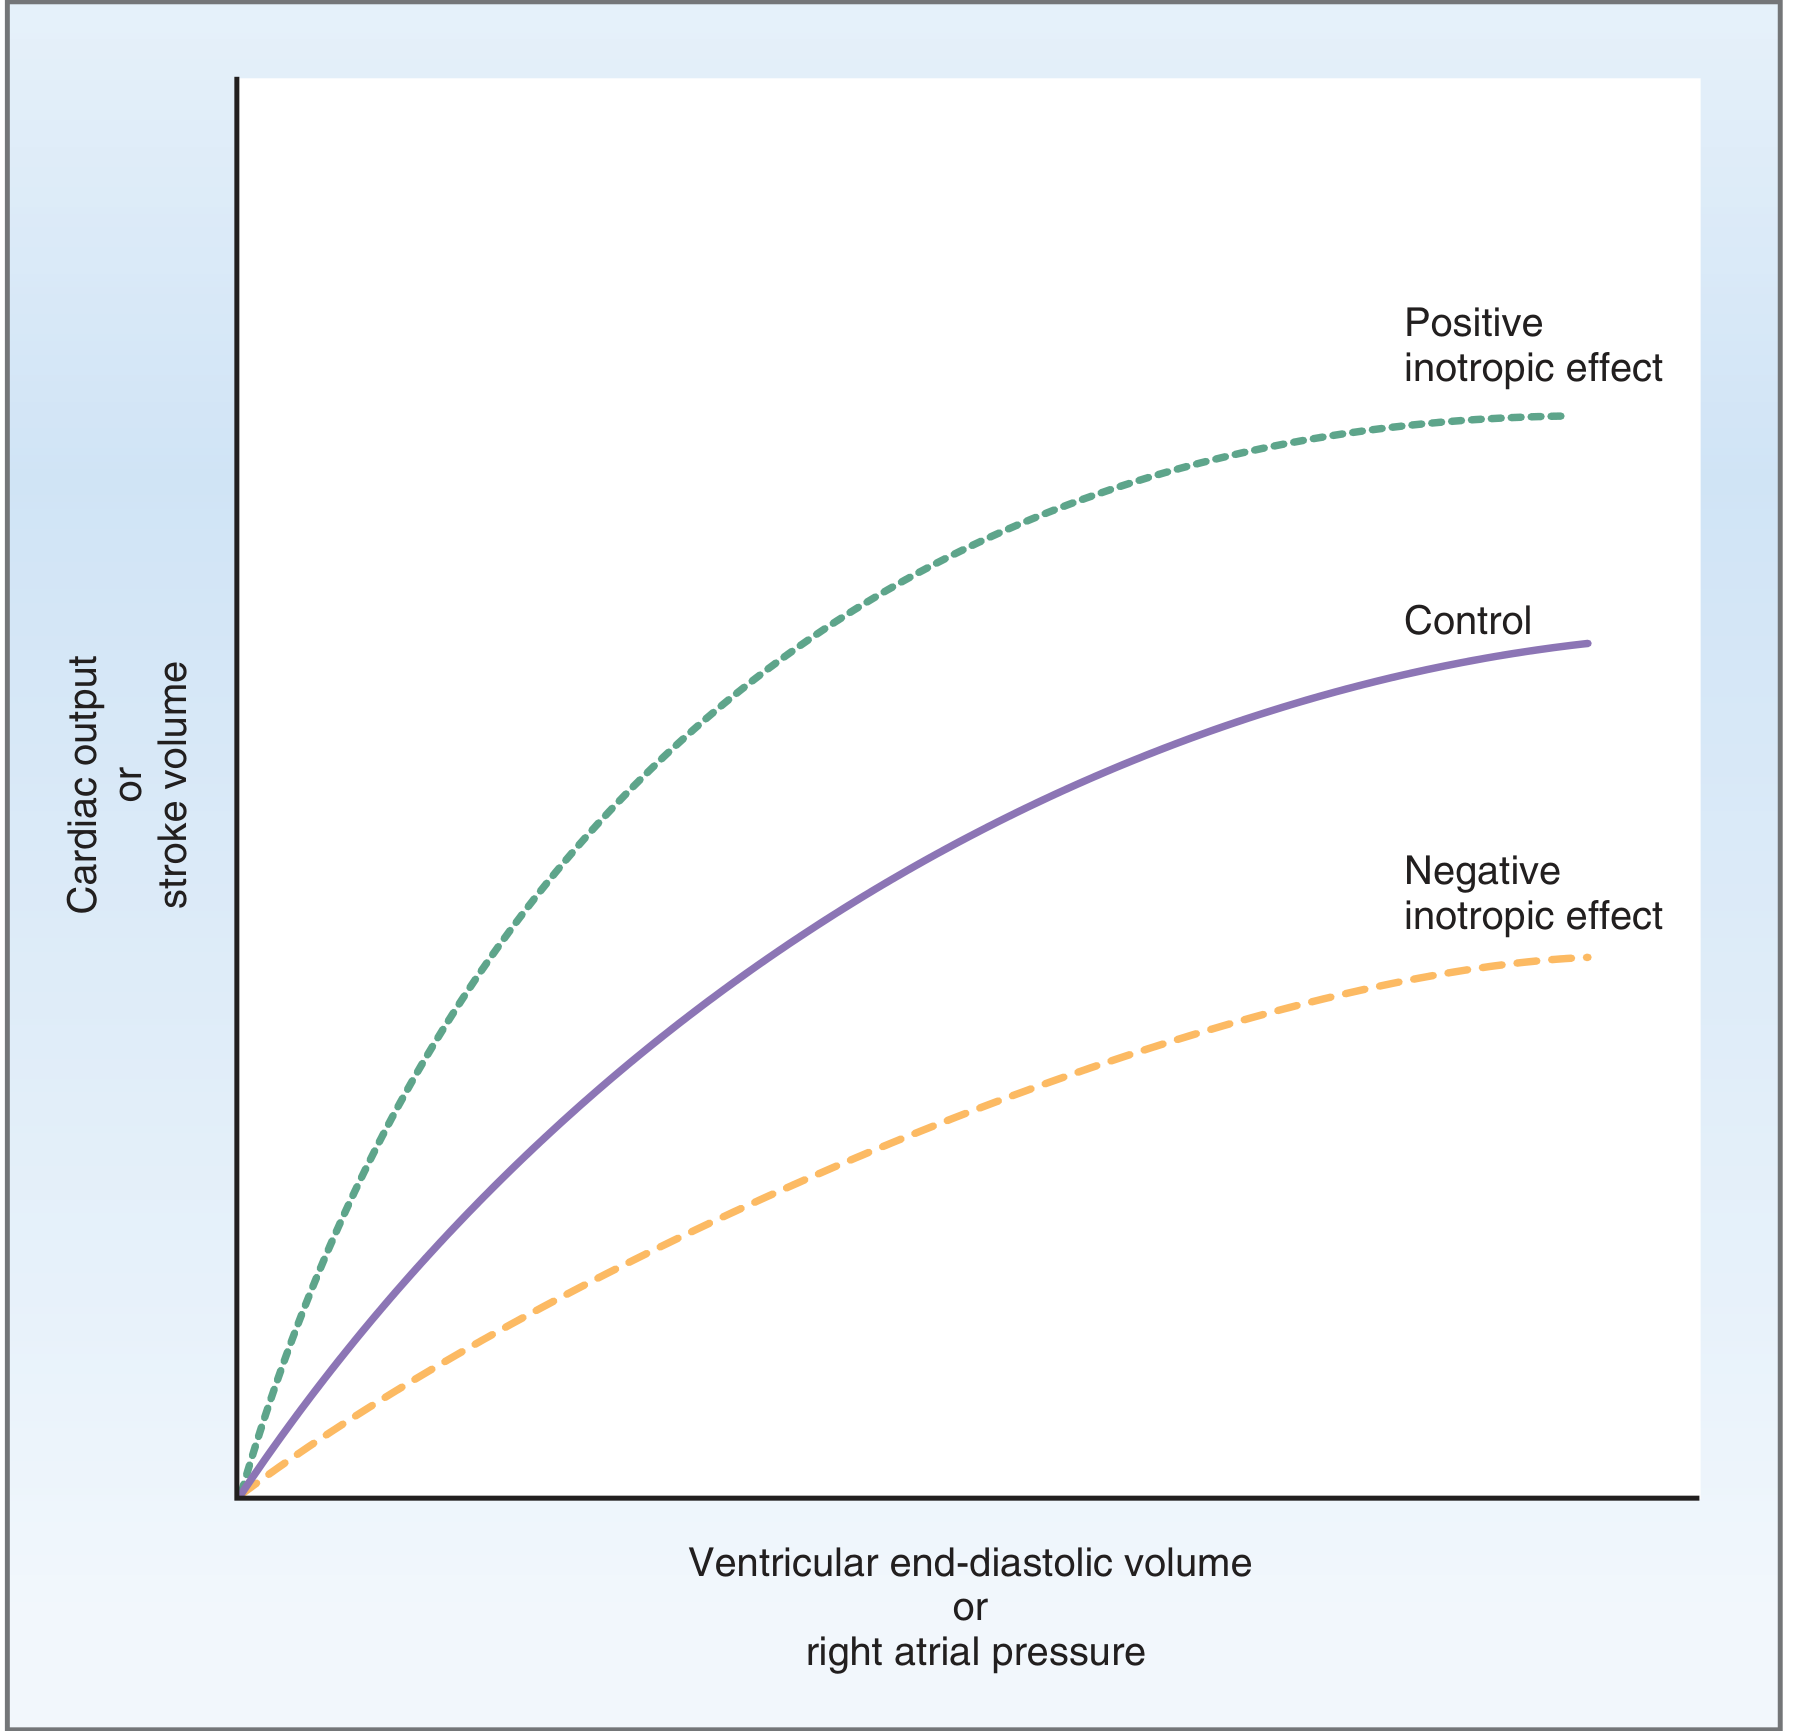
Fig. 4.22 - Frank-Starling Relationship. Positive inotropic agents shift the curve upward; negative inotropic agents shift it downward. (Costanzo Physiology)
Factors increasing preload (↑ CO):
- Increased venous return (exercise, lying down, IV fluids)
- Increased blood volume
- Venoconstriction
Factors decreasing preload (↓ CO):
- Hemorrhage, dehydration
- Standing up (venous pooling)
- Vasodilators (nitrates)
2. AFTERLOAD (Aortic Pressure / Resistance to Ejection)
- Afterload is the resistance or pressure against which the ventricle must pump to eject blood - essentially the aortic pressure / total peripheral resistance (TPR)
- An increase in afterload increases the work the ventricle must do to open the aortic valve
Relationship:
- ↑ Afterload → ↑ ESV (less blood ejected) → ↓ Stroke Volume → ↓ Cardiac Output
- ↓ Afterload → ↓ ESV (more blood ejected) → ↑ Stroke Volume → ↑ Cardiac Output
Clinical significance:
- In hypertension, high afterload reduces cardiac output over time
- Vasodilator drugs (e.g., ACE inhibitors) reduce afterload and improve CO in heart failure
3. CONTRACTILITY (Inotropy)
- Contractility (inotropic state) is the intrinsic ability of the myocardium to develop force and shorten, independent of preload and afterload
- It is determined by intracellular Ca²+ concentration - more Ca²+ → more cross-bridge cycling → greater force
Positive inotropic agents (↑ contractility → ↑ CO):
- Sympathetic stimulation / Catecholamines (norepinephrine, epinephrine) - act via β1 receptors → ↑ cAMP → ↑ Ca²+
- Digitalis (cardiac glycosides) - inhibit Na⁺/K⁺ ATPase → ↑ intracellular Na⁺ → ↓ Na⁺/Ca²+ exchange → ↑ Ca²+
- Increased heart rate itself (Treppe/Staircase phenomenon)
Negative inotropic agents (↓ contractility → ↓ CO):
- Parasympathetic stimulation (acetylcholine)
- Beta-blockers, calcium channel blockers
- Heart failure, myocardial ischemia, acidosis, hypoxia
B. FACTORS AFFECTING HEART RATE
Cardiac Output = Stroke Volume × Heart Rate, so heart rate directly affects CO.
1. Autonomic Nervous System
- Sympathetic stimulation (β1 receptors): ↑ heart rate (positive chronotropy) → ↑ CO
- Parasympathetic (vagal) stimulation: ↓ heart rate (negative chronotropy) → ↓ CO
2. Hormones
- Epinephrine, norepinephrine: ↑ heart rate and contractility
- Thyroid hormones: ↑ heart rate (hyperthyroidism → ↑ CO)
3. Temperature
- Fever / hyperthermia: ↑ heart rate → ↑ CO
- Hypothermia: ↓ heart rate → ↓ CO
4. Starling's Law on Heart Rate
- At very high heart rates, diastolic filling time decreases → EDV falls → stroke volume falls → CO may actually decrease (inverse relationship at extremes)
5. Age and Physical Fitness
- Athletes have higher stroke volume (due to cardiac hypertrophy) with lower resting heart rate but normal or higher CO
- CO declines with age due to reduced compliance and contractility
Summary Table: Factors Affecting Cardiac Output
| Factor | Effect on CO | Mechanism |
|---|---|---|
| ↑ Venous return / Preload | ↑ | Frank-Starling (↑ EDV → ↑ SV) |
| ↑ Afterload (TPR, BP) | ↓ | ↑ ESV → ↓ SV |
| ↑ Contractility | ↑ | ↑ Ca²+, ↑ force of ejection |
| ↑ Heart rate (moderate) | ↑ | Direct (CO = HR × SV) |
| ↑ Heart rate (extreme) | ↓ | Reduced filling → ↓ EDV |
| Sympathetic stimulation | ↑ | ↑ HR + ↑ contractility |
| Parasympathetic stimulation | ↓ | ↓ HR + ↓ contractility |
| Exercise | ↑ | ↑ HR, ↑ SV (can reach 20-25 L/min) |
| Hemorrhage | ↓ | ↓ Venous return → ↓ EDV |
| Positive inotropes (digoxin) | ↑ | ↑ intracellular Ca²+ |
| Negative inotropes (β-blockers) | ↓ | ↓ HR and contractility |
WAYS TO MEASURE CARDIAC OUTPUT
1. Fick's Principle (Direct Fick Method)
The gold standard for measuring cardiac output.
Principle: In steady state, the O₂ consumed by the body = O₂ added to blood as it passes through the lungs.
Formula:
Cardiac Output = O₂ Consumption / (O₂ content of pulmonary vein - O₂ content of pulmonary artery)
Or equivalently:
CO = O₂ Consumption / (Arterial O₂ content - Venous O₂ content)
Example:
- O₂ consumption = 250 mL/min
- Arterial O₂ content = 0.20 mL/mL blood
- Venous O₂ content = 0.15 mL/mL blood
CO = 250 / (0.20 - 0.15) = 250 / 0.05 = 5000 mL/min
Requirements:
- Right heart catheterization (to sample mixed venous blood from pulmonary artery)
- Measurement of O₂ consumption (spirometry)
Limitation: Invasive; requires steady state.
2. Indicator Dilution Method
Principle: A known quantity of indicator (dye, such as indocyanine green) is injected into a central vein, and its concentration is measured downstream in an artery over time.
Formula:
CO = Amount of indicator injected / (Mean concentration × Duration of curve)
- The area under the concentration-time curve is used to calculate CO
- Thermodilution is the most widely used clinical variant - cold saline (indicator) is injected into right atrium, temperature change detected in pulmonary artery by a thermistor (Swan-Ganz catheter)
- Limitation: Errors with intracardiac shunts, tricuspid regurgitation, rapid IV fluids
3. Echocardiography (Non-Invasive)
- 2D echocardiography: Measures EDV and ESV; calculates stroke volume and ejection fraction
- Doppler echocardiography: Measures blood flow velocity in the aorta; CO = Velocity Time Integral × Aortic cross-sectional area × Heart Rate
- Advantage: Non-invasive, bedside, widely available
4. Pulse Contour Analysis / Arterial Waveform Analysis
- Continuous CO measurement from the arterial pressure waveform
- Based on the principle that pulse pressure (systolic - diastolic) is proportional to stroke volume
- Devices: PiCCO, LiDCO, FloTrac
- Minimally invasive
5. Impedance Cardiography (Thoracic Bioimpedance)
- Measures changes in thoracic electrical impedance caused by pulsatile aortic blood flow
- Non-invasive, continuous measurement
- Less accurate in critical illness
6. Magnetic Resonance Imaging (MRI)
- Most accurate non-invasive method for measuring stroke volume and CO
- Phase-contrast MRI measures flow velocity in the aorta
- Used as a reference standard in research
Sources: Costanzo Physiology 7th Edition; Guyton and Hall Textbook of Medical Physiology; Miller's Anesthesia 10th Edition
Describe the cardiac cycle phases with pressure-volume curve diagram
Finding Sources
Finding Sources
Reading File
Reading File
Reading File
Reading File
Reading File
Loading Image
Reading File
Reading File
Loading Image
I now have everything needed - both the Wiggers diagram and the pressure-volume loop diagram. Here is the complete exam answer:
Cardiac Cycle: Phases with Pressure-Volume Curve
DEFINITION
The cardiac cycle is the sequence of electrical and mechanical events that occur during one complete heartbeat - from the beginning of one contraction to the beginning of the next.
- Duration: ~0.8 seconds at a heart rate of 75 beats/min
- Systole (contraction): ~0.3 seconds
- Diastole (relaxation): ~0.5 seconds
The cycle is divided into 7 phases (A through G), best understood using the Wiggers Diagram below:
WIGGERS DIAGRAM
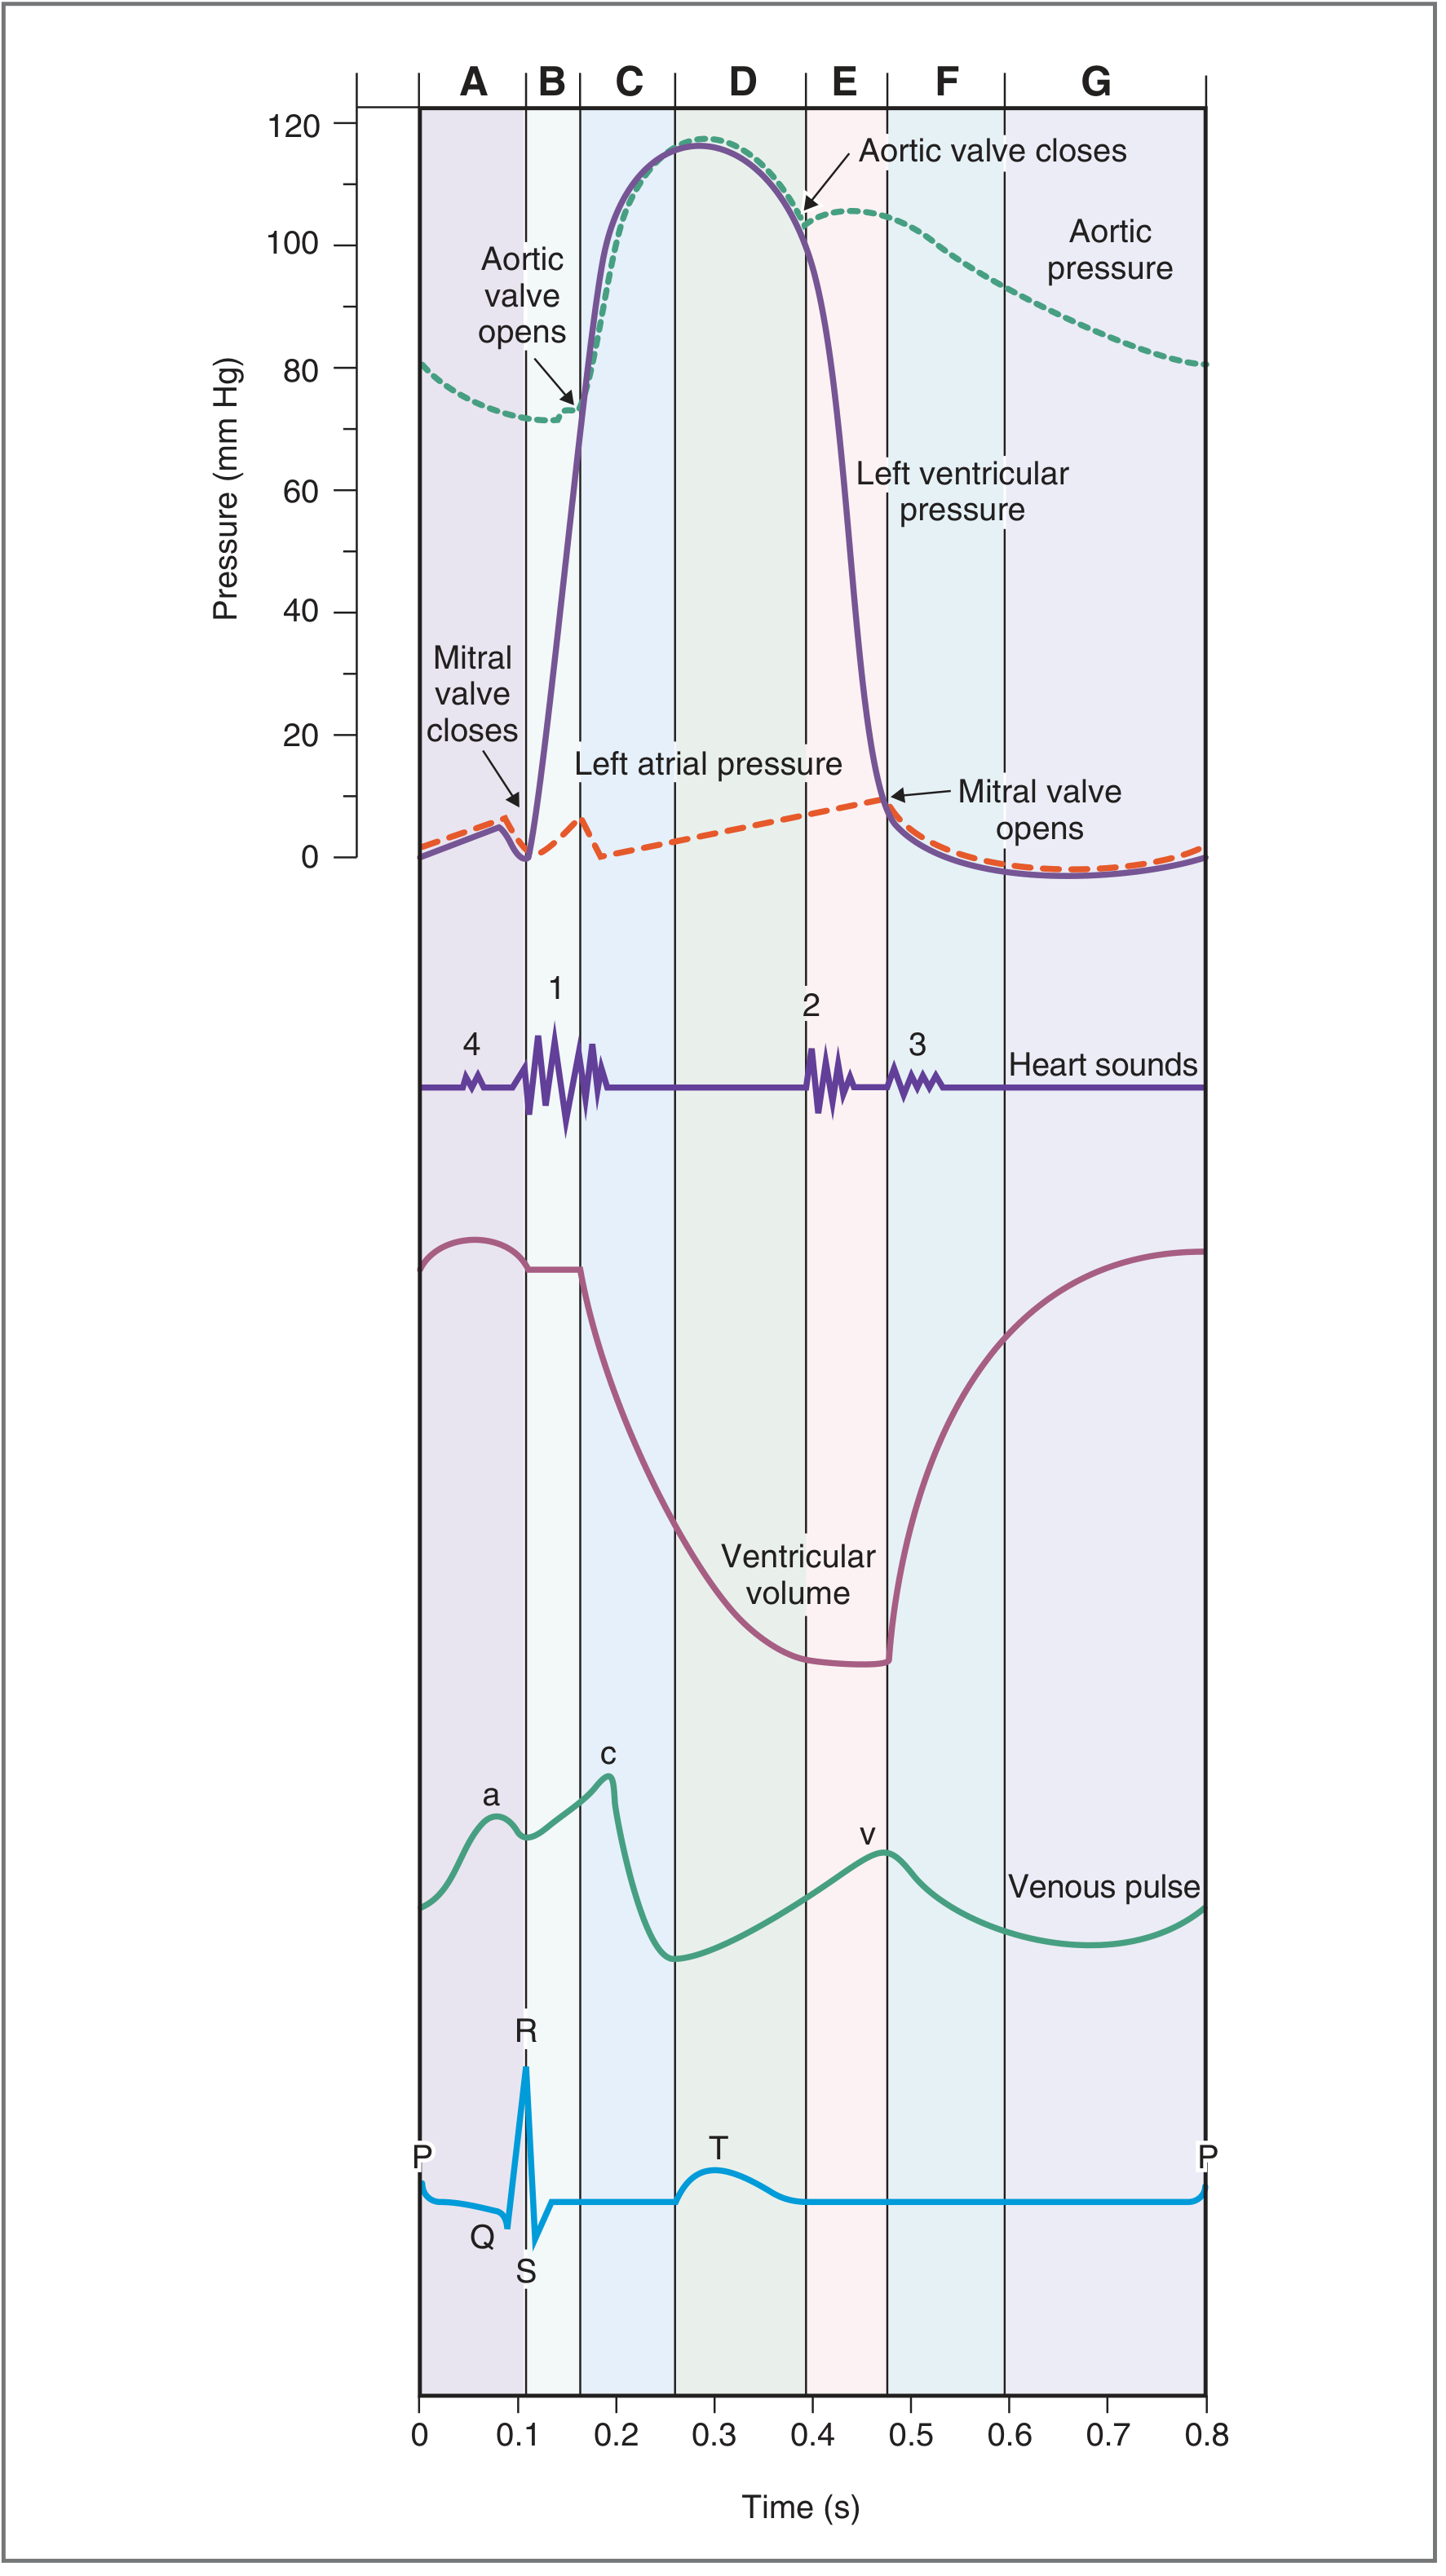
Fig. 4.25 - The Cardiac Cycle. A = Atrial Systole; B = Isovolumetric Ventricular Contraction; C = Rapid Ventricular Ejection; D = Reduced Ventricular Ejection; E = Isovolumetric Ventricular Relaxation; F = Rapid Ventricular Filling; G = Reduced Ventricular Filling (Diastasis). (Costanzo Physiology 7th Ed.)
THE SEVEN PHASES OF THE CARDIAC CYCLE
PHASE A — Atrial Systole
| Parameter | Event |
|---|---|
| ECG | P wave (atrial depolarization) |
| Valves | Mitral valve OPEN; Aortic valve CLOSED |
| Ventricle | Relaxed; filling from atrium |
| Heart Sound | S4 (not audible in normal adults) |
- The atria contract following the P wave
- Atrial contraction actively ejects blood into the ventricle through the open mitral valve
- This contributes the final ~20% of ventricular filling (called the "atrial kick")
- Ventricular volume rises to its maximum = End-Diastolic Volume (EDV ~140 mL)
- Left atrial pressure briefly rises, seen as the "a" wave of the venous pulse
- The ventricular pressure shows a small "blip" due to this added volume
PHASE B — Isovolumetric Ventricular Contraction
| Parameter | Event |
|---|---|
| ECG | QRS complex (ventricular depolarization) |
| Valves | Both valves CLOSED |
| Ventricle | Contracting; pressure rising sharply |
| Heart Sound | S1 ("lub") - closure of mitral (then tricuspid) valve |
- Ventricular contraction begins with the QRS complex
- As ventricular pressure rises and exceeds left atrial pressure, the mitral valve snaps shut - producing S1
- The aortic valve remains closed because ventricular pressure has not yet reached aortic pressure (~80 mmHg)
- Volume remains constant (all valves closed) - hence "isovolumetric"
- Ventricular pressure rises dramatically from ~0 to ~80 mmHg
PHASE C — Rapid Ventricular Ejection
| Parameter | Event |
|---|---|
| ECG | ST segment |
| Valves | Aortic valve OPENS; Mitral valve still closed |
| Ventricle | Contracting maximally; pressure at peak |
| Heart Sound | None |
- When ventricular pressure exceeds aortic pressure (~80 mmHg), the aortic valve opens
- Blood is rapidly ejected into the aorta - most of the stroke volume (~70%) is ejected here
- Left ventricular pressure and aortic pressure both rise to their maximum (~120 mmHg = systolic pressure)
- Ventricular volume falls steeply
- Atrial filling begins: left atrial pressure starts slowly rising as pulmonary venous return enters the atrium
PHASE D — Reduced Ventricular Ejection
| Parameter | Event |
|---|---|
| ECG | T wave (ventricular repolarization begins) |
| Valves | Aortic valve still OPEN; Mitral valve still CLOSED |
| Ventricle | Beginning to relax; pressure falling |
| Heart Sound | None |
- Ventricular repolarization begins (T wave on ECG)
- Ventricle begins relaxing → ventricular pressure falls
- Blood continues to be ejected (aortic valve still open), but at a slower rate
- Ventricular volume reaches its minimum = End-Systolic Volume (ESV ~70 mL)
- Aortic pressure begins to fall as blood runs off into the peripheral arteries faster than it is being added
Stroke Volume = EDV - ESV = 140 - 70 = 70 mL
PHASE E — Isovolumetric Ventricular Relaxation
| Parameter | Event |
|---|---|
| ECG | After T wave |
| Valves | Both valves CLOSED |
| Ventricle | Relaxing rapidly; pressure falling |
| Heart Sound | S2 ("dub") - closure of aortic (then pulmonic) valve |
- When ventricular pressure falls below aortic pressure, the aortic valve closes → produces S2
- The aortic valve closes slightly before the pulmonic valve
- During inspiration, splitting of S2 is heard (P2 delayed due to ↑ right heart filling)
- Dicrotic notch (incisura) appears on the aortic pressure curve at the moment of aortic valve closure
- Both valves are now closed → ventricular volume is constant (isovolumetric)
- Ventricular pressure falls rapidly from ~80 mmHg to near zero
- The mitral valve will open once ventricular pressure falls below atrial pressure
PHASE F — Rapid Ventricular Filling
| Parameter | Event |
|---|---|
| ECG | Isoelectric period (between T and next P wave) |
| Valves | Mitral valve OPENS; Aortic valve closed |
| Ventricle | Relaxed; filling rapidly |
| Heart Sound | S3 (normal in children; pathological in adults >40 years) |
- When ventricular pressure falls below left atrial pressure, the mitral valve opens
- Blood rushes rapidly from the left atrium into the relaxed, compliant ventricle
- Ventricular volume increases rapidly - this is the most rapid phase of filling (~70-80% of filling occurs here)
- Ventricular pressure remains low due to high compliance
- S3 is caused by this rapid rush of blood into the ventricle
- S3 in adults: suggests volume overload (heart failure, mitral regurgitation)
- Aortic pressure continues to fall as blood runs off into the arterial tree
PHASE G — Reduced Ventricular Filling (Diastasis)
| Parameter | Event |
|---|---|
| ECG | Approaching next P wave |
| Valves | Mitral valve OPEN; Aortic valve CLOSED |
| Ventricle | Filling slowly |
| Heart Sound | None |
- This is the longest phase of the cardiac cycle
- Ventricular filling continues at a slow rate as atrial and ventricular pressures equilibrate
- Ventricular volume gradually increases toward EDV
- At the end of this phase, atrial systole (Phase A) occurs again → the cycle repeats
- Important: With tachycardia (↑ heart rate), diastasis is the first phase to be shortened, which reduces EDV and stroke volume
Summary Table of the Cardiac Cycle
| Phase | Duration | Valves | Volume | Key Event | Heart Sound |
|---|---|---|---|---|---|
| A - Atrial Systole | 0.1s | Mitral open | ↑ to EDV | Atrial kick | S4 |
| B - Isovolumetric Contraction | 0.05s | All closed | Constant | Pressure ↑↑ | S1 |
| C - Rapid Ejection | 0.09s | Aortic open | ↓↓ rapidly | Most SV ejected | - |
| D - Reduced Ejection | 0.13s | Aortic open | ↓ to ESV | Pressure ↓ | - |
| E - Isovolumetric Relaxation | 0.08s | All closed | Constant | Pressure ↓↓ | S2 |
| F - Rapid Filling | 0.11s | Mitral open | ↑↑ rapidly | 70-80% filled | S3 |
| G - Reduced Filling (Diastasis) | 0.19s | Mitral open | ↑ slowly | Near-equilibrium | - |
Total duration: ~0.8 seconds (at HR 75 bpm)
LEFT VENTRICULAR PRESSURE-VOLUME (P-V) LOOP
The pressure-volume loop is a graphical representation of left ventricular pressure (y-axis) plotted against ventricular volume (x-axis) over one complete cardiac cycle.
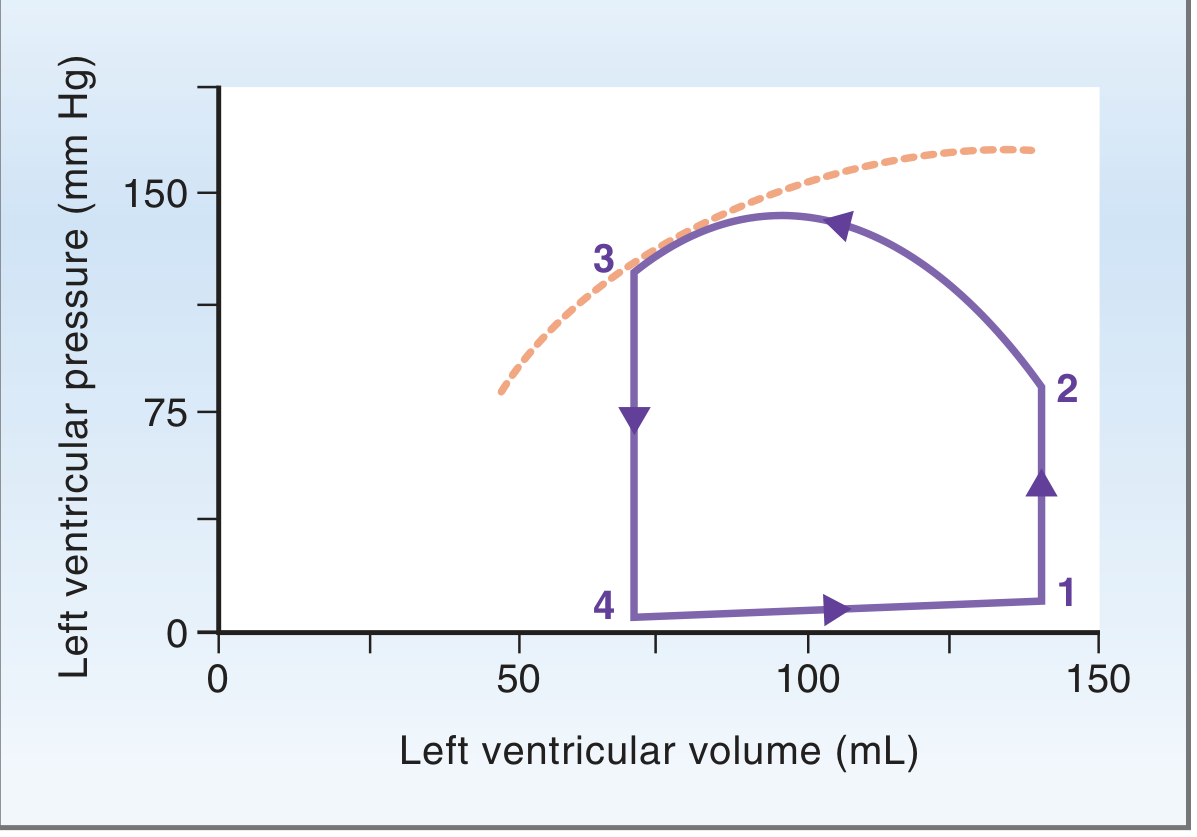
Fig. 4.23 - Left Ventricular Pressure-Volume Loop. The loop is traversed counter-clockwise. Dashed line = systolic pressure-volume curve (maximum developed pressure). (Costanzo Physiology 7th Ed.)
Understanding the Loop (Counter-clockwise traversal):
Point 1 → Point 2: Isovolumetric Contraction
- Starts at Point 1 = End of diastole (EDV = 140 mL, pressure ~5 mmHg)
- All valves closed → ventricular pressure rises sharply with no change in volume
- Represented as a vertical line going upward on the right side of the loop
- Ends at Point 2 when ventricular pressure = aortic pressure (~80 mmHg) → aortic valve opens
Point 2 → Point 3: Ventricular Ejection
- Aortic valve opens → blood ejected into aorta
- Volume decreases from 140 mL (EDV) to 70 mL (ESV)
- Pressure rises to peak (~120 mmHg) then falls
- Represented as the curved top portion of the loop
- Ends at Point 3 = End of systole (ESV ~70 mL) - this point touches the systolic pressure-volume curve (dashed line)
- The width of the loop = Stroke Volume (70 mL)
Point 3 → Point 4: Isovolumetric Relaxation
- Aortic valve closes → both valves closed → pressure falls sharply with no change in volume
- Represented as a vertical line going downward on the left side of the loop
- Ends at Point 4 when ventricular pressure falls below atrial pressure → mitral valve opens
Point 4 → Point 1: Ventricular Filling (Diastole)
- Mitral valve opens → ventricle fills passively then actively (atrial systole)
- Volume increases from ESV (70 mL) back to EDV (140 mL) at low pressure
- Represented as the flat bottom portion of the loop
Key Information from the P-V Loop:
| Value | How to read it |
|---|---|
| Stroke Volume | Width of the loop (EDV - ESV) |
| EDV | Rightmost point of loop (Point 1) |
| ESV | Leftmost point of loop (Point 3/4) |
| Cardiac Work | Area enclosed within the loop |
| Ejection Fraction | Stroke Volume / EDV |
| Preload | EDV (position of Point 1 on x-axis) |
| Afterload | Height of Point 2 (aortic pressure) |
Effects on the P-V Loop:
| Change | Effect on Loop |
|---|---|
| ↑ Preload (↑ venous return) | Loop shifts right; wider (↑ SV) |
| ↑ Afterload (↑ aortic pressure) | Loop shifts up; narrower (↓ SV, ↑ ESV) |
| ↑ Contractility | Loop shifts left and widens; Point 3 moves leftward (↓ ESV, ↑ SV) |
| Heart failure | Small, narrow loop; ↑ ESV, ↓ SV, ↓ EF |
Sources: Costanzo Physiology 7th Edition; Medical Physiology (Boron & Boulpaep)
This is a shared conversation. Sign in to Orris to start your own chat.