
DCLD with portal hypertension with moderate ascites with UGI bleed
portal hypertension varices management algorithm cirrhosis
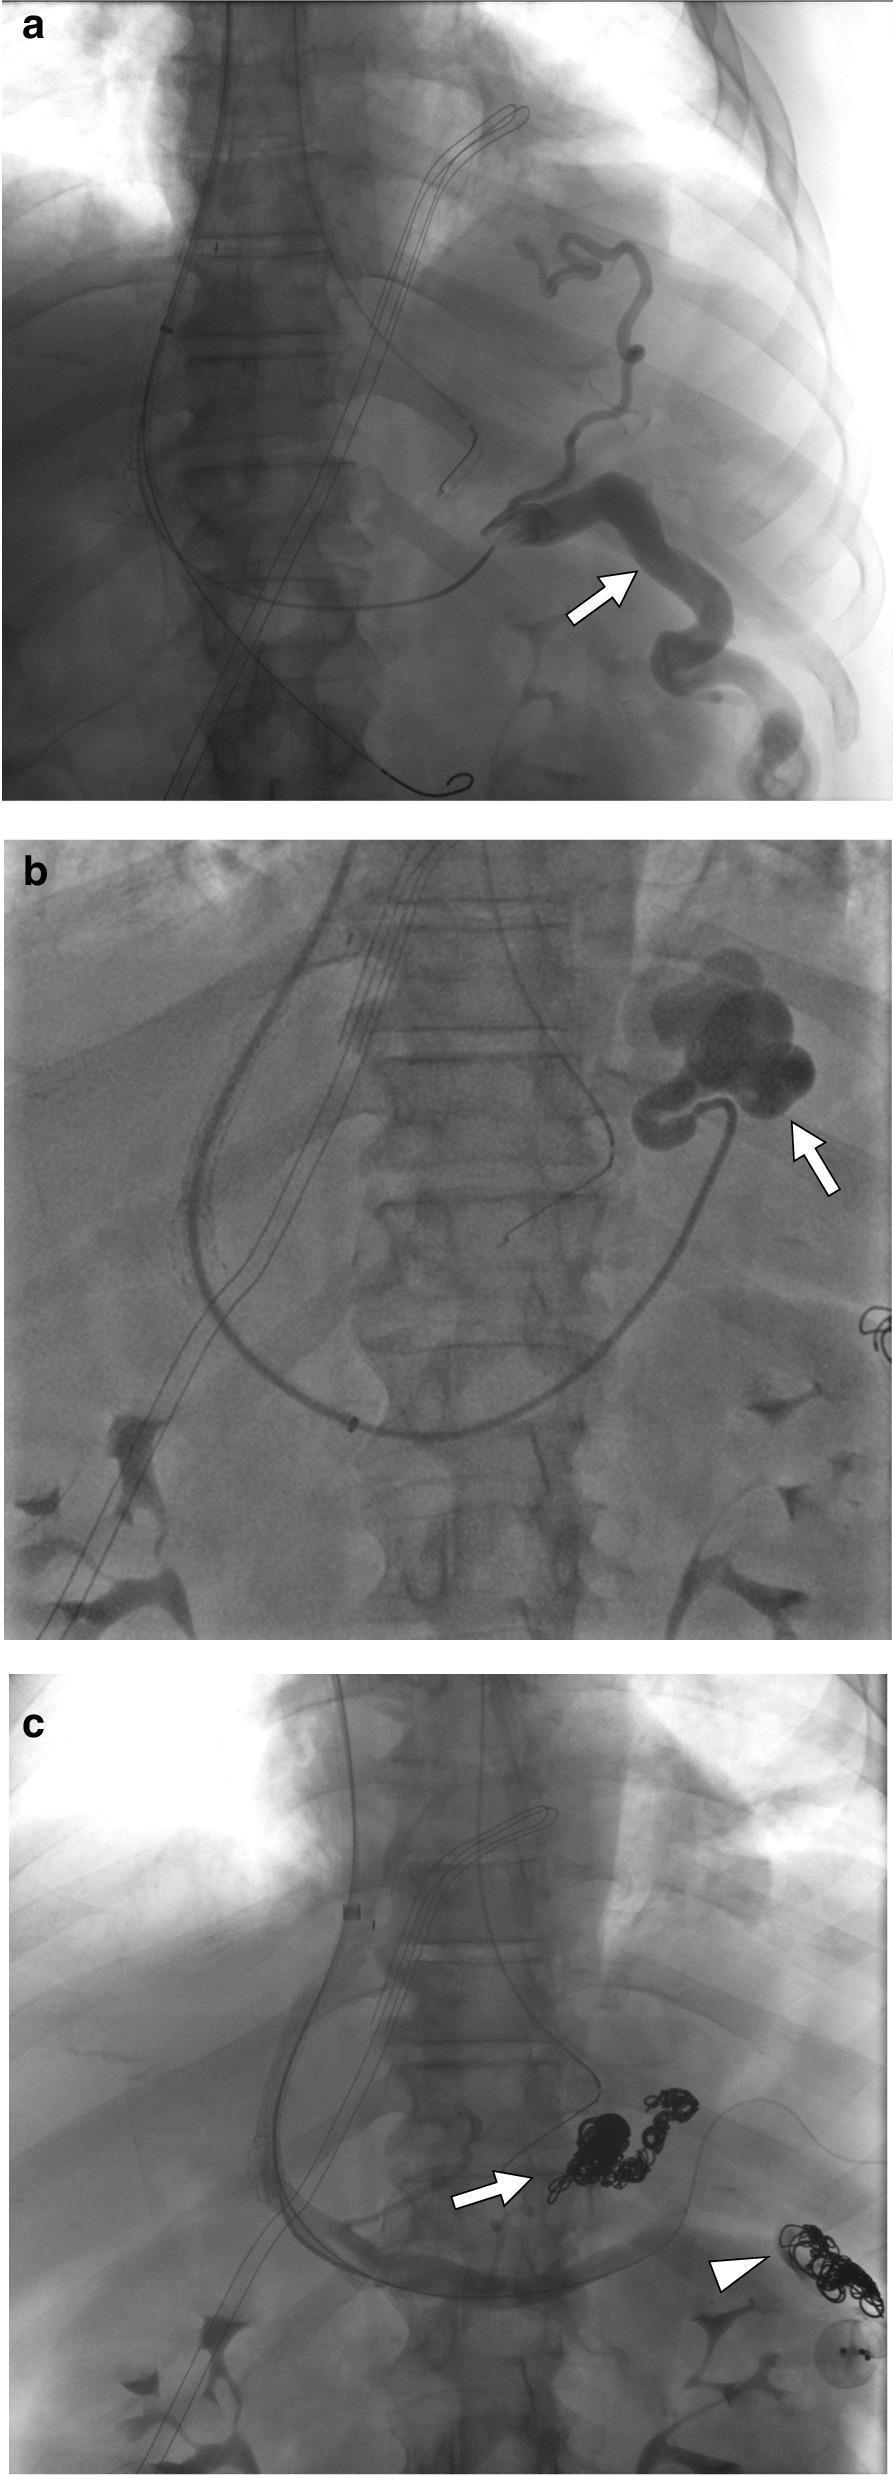
This set of three fluoroscopic angiograms (a, b, and c) documents the interventional management of portal hypertension complications in a patient with cirrhosis. Image (a) is a post-TIPS (Transjugular Intrahepatic Portosystemic Shunt) angiogram demonstrating a dilated, tortuous left testicular vein (arrow) originating from the splenic vein, contributing to a clinically significant varicocele. Image (b) shows contrast enhancement of large, bulbous gastric varices (arrow) as a manifestation of portosystemic collateralization. Image (c) displays the result of therapeutic embolization; radiopaque embolic coils are clearly visible within the gastric varices (arrow) and the varicocele (arrowhead). The absence of contrast filling in these areas in the final angiogram indicates successful vascular occlusion. This sequence illustrates the use of TIPS and subsequent targeted embolization to manage symptomatic varices and ectopic venous congestion associated with portal hypertension. Educational concepts include vascular anatomy, complications of cirrhosis, and the radiographic appearance of embolic materials.
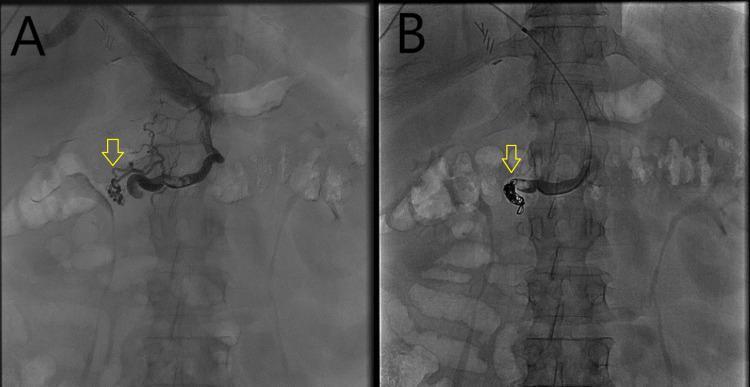
Dual-panel fluoroscopic imaging of the abdomen demonstrating the interventional management of ectopic varices in a patient with portal hypertension. Figure A (pre-embolization) shows an anteroposterior fluoroscopic view with a contrast-enhanced cluster of dilated, tortuous, and irregular venous structures (indicated by a yellow arrow) in the duodenal region. These duodenal varices are supplied by a portosystemic shunt involving the superior mesenteric vein. Figure B (post-embolization) illustrates the results of transhepatic coil embolization. Dense, radiopaque metallic coils are now visible within the variceal nest (indicated by the yellow arrow), effectively occluding the abnormal vessels. A catheter used for the intervention is visible traversing the mid-abdomen. These images highlight the role of interventional radiology in treating rare sites of variceal bleeding associated with cirrhosis and portal hypertension when conventional endoscopic therapy is insufficient.
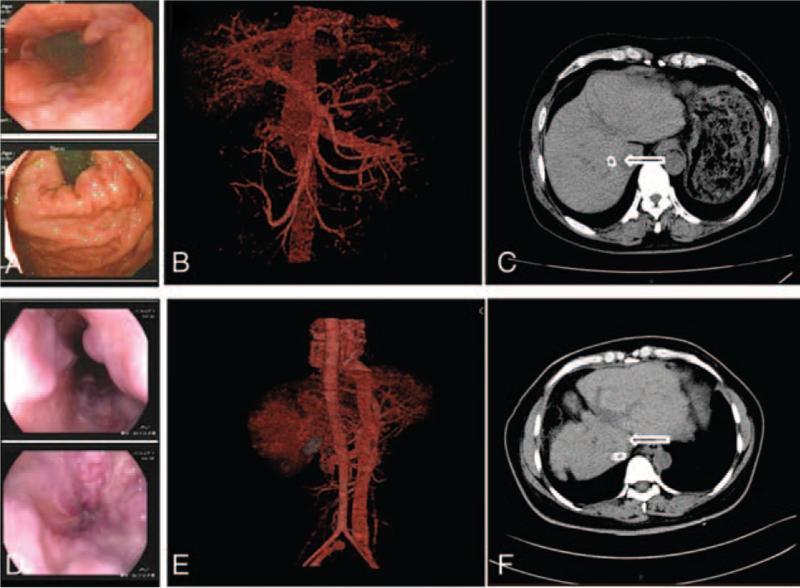
This composite clinical figure presents a comparative study of two patients (Case 1: A-C; Case 2: D-F) undergoing management for portal hypertension and liver cirrhosis. Panels A and D show endoscopic views of the middle/lower esophagus and gastric fundus, identifying prominent, tortuous varicose veins (esophageal and gastric varices) and signs of portal hypertensive gastropathy. Panels B and E demonstrate 3D reconstructed abdominal angiographies (CT angiography), highlighting significant vascular abnormalities including a widened portal vein, collateral venous circulation around the stomach and spleen, and abnormal perfusion shadows in the right hepatic lobe. Panels C and F are axial abdominal CT scans obtained after transjugular intrahepatic portosystemic shunt (TIPS) placement. White arrows in the CT images indicate the successful positioning of the intrahepatic stents within the liver parenchyma, designed to decompress the portal pressure. The images collectively illustrate the diagnostic progression from direct visualization of varices to vascular mapping and post-interventional radiological verification of shunt placement in patients with complications of chronic liver disease.
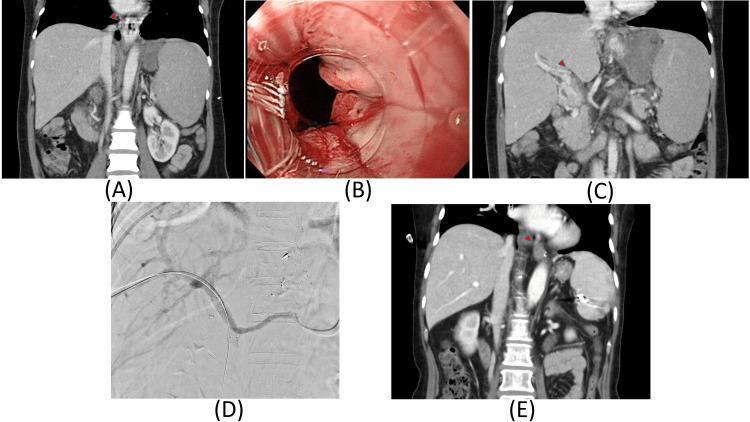
A composite medical image illustrating the diagnosis and treatment of portal hypertension. (A) Coronal CT scan shows splenomegaly and prominent esophageal varices in the absence of liver cirrhosis. (B) Endoscopic view (EGD) of the gastroesophageal junction reveals dilated, tortuous esophageal varices with a 'white nipple sign,' indicating a recent hemorrhage and fibrin clot formation. (C) Coronal CT scan highlights portal vein thrombosis, characterized by a filling defect in the portal venous system, which serves as the etiology for pre-hepatic portal hypertension. (D) Intraoperative fluoroscopic image demonstrates the placement of a portal vein stent via an interventional radiology approach. (E) Follow-up coronal CT scan displays the successful resolution of previously noted esophageal varices and restoration of vascular flow following the stenting procedure. This series provides an educational overview of non-cirrhotic portal hypertension management, from diagnostic imaging and endoscopic stigmata of bleeding to therapeutic intervention and radiological follow-up.
esophageal varices endoscopy band ligation bleeding
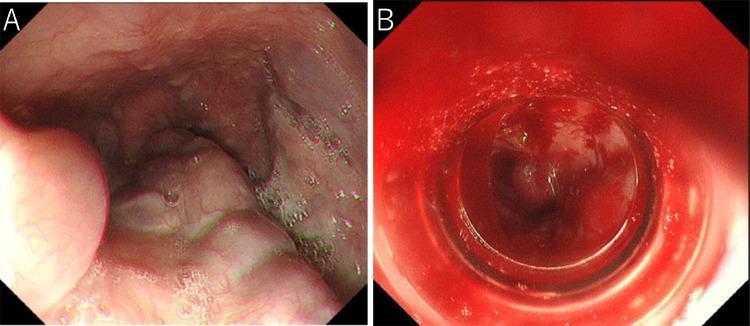
A pair of endoscopic clinical photographs illustrating the esophagus before and after endoscopic variceal ligation (EVL). Image A shows moderately enlarged, beads-like (F2) esophageal varices protruding into the esophageal lumen. The varices appear as dilated, tortuous, and nodular-shaped venous structures with an irregular surface, typical of severe portal hypertension. Image B demonstrates the immediate post-EVL state, characterized by significant oozing hemorrhage and fresh blood pooling within the lumen, which obscures the underlying mucosal details. This side-by-side comparison highlights the clinical presentation of esophageal varices and the potential complication of immediate post-procedural bleeding during or after band ligation. The educational focus is on identifying variceal morphology and recognizing complications of therapeutic endoscopy in the management of portal hypertension.
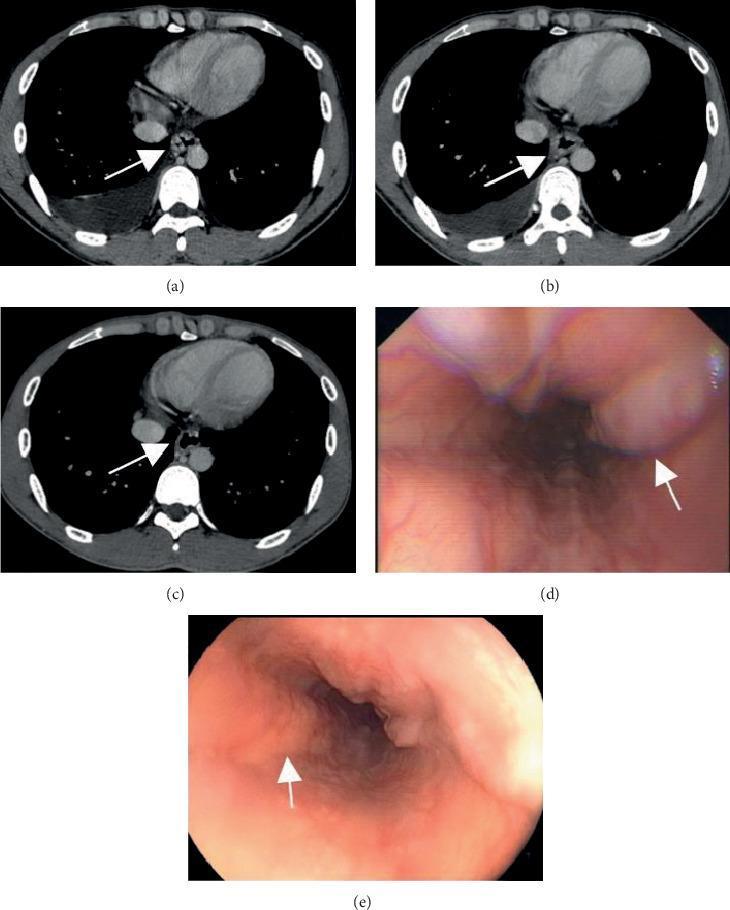
This composite figure demonstrates the efficacy of endoscopic band ligation (EBL) for severe esophageal varices through longitudinal diagnostic imaging and endoscopy. Panes (a), (b), and (c) are axial contrast-enhanced CT scans at the level of the distal esophagus. Image (a) shows the baseline state with prominent, dilated esophageal varices (arrowed). Sequential scans at 1 week (b) and 1 month (c) post-treatment demonstrate progressive attenuation and reduction in the diameter of the variceal vessels. Panes (d) and (e) provide direct endoscopic visualization of the esophageal lumen. Image (d) illustrates baseline severe esophageal varices characterized by large, tortuous protrusions into the lumen (arrowed). Image (e), captured 1 month after endotherapy, shows a significant therapeutic response, with a reduction in variceal size and a smoother, less congested esophageal mucosal lining. This comparison highlights the role of both cross-sectional imaging (CTPV) and direct endoscopy in monitoring treatment outcomes for portal hypertension complications.
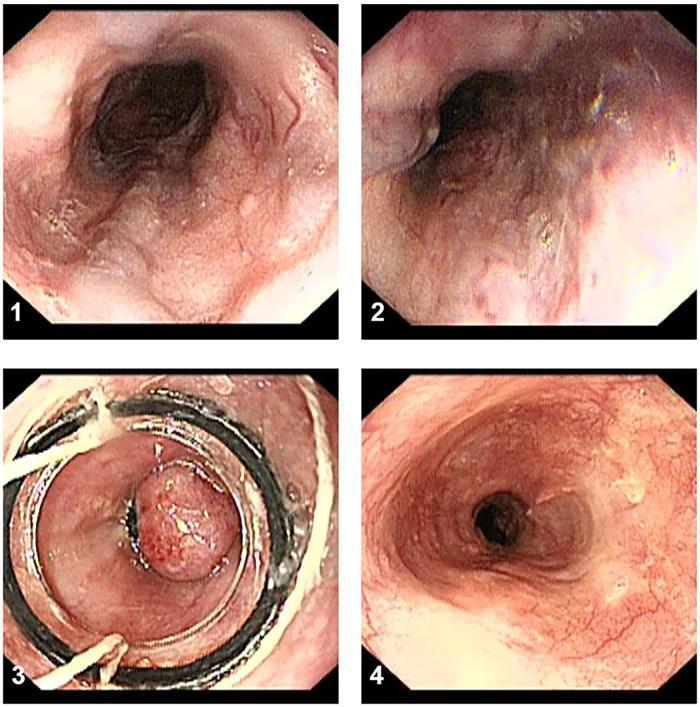
This set of four endoscopic images illustrates the stages of Endoscopic Variceal Ligation (EVL) for the management of esophageal varices. (1, 2) Baseline diagnostic images show multiple, large, tortuous, serpentine esophageal varices with visible 'red signs' (cherry red spots), indicating a high risk of imminent hemorrhage. (3) Procedural view showing the application of multiband ligators; a variceal cord is successfully suctioned into the ligator cap and strangulated with an elastic rubber band, forming a polypoid pseudo-polyp. (4) Follow-up surveillance endoscopy performed 3 months post-procedure demonstrates successful eradication of the varices. The esophageal lumen is patent with a smoother mucosal surface and visible white scarring (fibrosis) at the previous ligation sites, which represents healed tissue and reduced vascular engorgement. This sequence serves as a clinical guide for gastroenterology training in the identification, interventional treatment, and post-procedural healing of portal hypertension-induced variceal disease.
DCLD - Portal Hypertension - Moderate Ascites - UGI Bleed
Overview
I. IMMEDIATE RESUSCITATION (UGI Bleed - First Priority)
A. Airway & Hemodynamics
- Two large-bore IV lines immediately
- Secure the airway (intubation if altered consciousness, massive hematemesis, or aspiration risk)
- Volume resuscitation - cautious fluid resuscitation to prevent re-bleeding from increased portal pressure
- Target SBP ~90-100 mmHg (avoid aggressive over-resuscitation)
B. Blood Transfusion Strategy
- Restrictive transfusion: Target Hb 7-8 g/dL (not higher - liberal transfusion increases portal pressure and rebleeding risk)
- Note: INR is NOT a reliable indicator of coagulation in cirrhosis - avoid over-correcting coagulopathy empirically
- There are no current recommendations for routine platelet or coagulation factor administration
C. Antibiotic Prophylaxis (MANDATORY)
- Cirrhotic patients who bleed are at high risk of bacterial infections including SBP
- Ceftriaxone 1 g IV every 24 hours x 7 days (standard recommendation from AASLD guidelines)
- RCTs have shown antibiotic prophylaxis reduces infections, recurrent bleeding, and death
- (Mulholland and Greenfield's Surgery, 7e)
II. PHARMACOLOGICAL CONTROL OF VARICEAL BLEEDING
Vasoactive Agents
| Drug | Dose | Duration |
|---|---|---|
| Octreotide (1st line, widely available) | 50 mcg IV bolus (can repeat in first hour), then 50 mcg/hr infusion | 2-5 days |
| Terlipressin (vasopressin analog) | First 48 hrs: 2 mg IV every 4 hrs until bleeding controlled; then 1 mg IV every 4 hrs | 2-5 days |
| Somatostatin | 250 mcg IV bolus (repeat in 1st hr if ongoing), then 250-500 mcg/hr infusion | 2-5 days |
| Vasopressin (last resort) | 0.2-0.4 U/min IV + nitroglycerin (always co-administer to prevent cardiac events) | 24 hrs |
III. ENDOSCOPIC MANAGEMENT
Endoscopic Variceal Ligation (EVL) - First-Line
- EVL is the preferred endoscopic treatment for esophageal varices
- A varix is drawn into the ligator by suction, and an O-ring is applied (see diagram below)
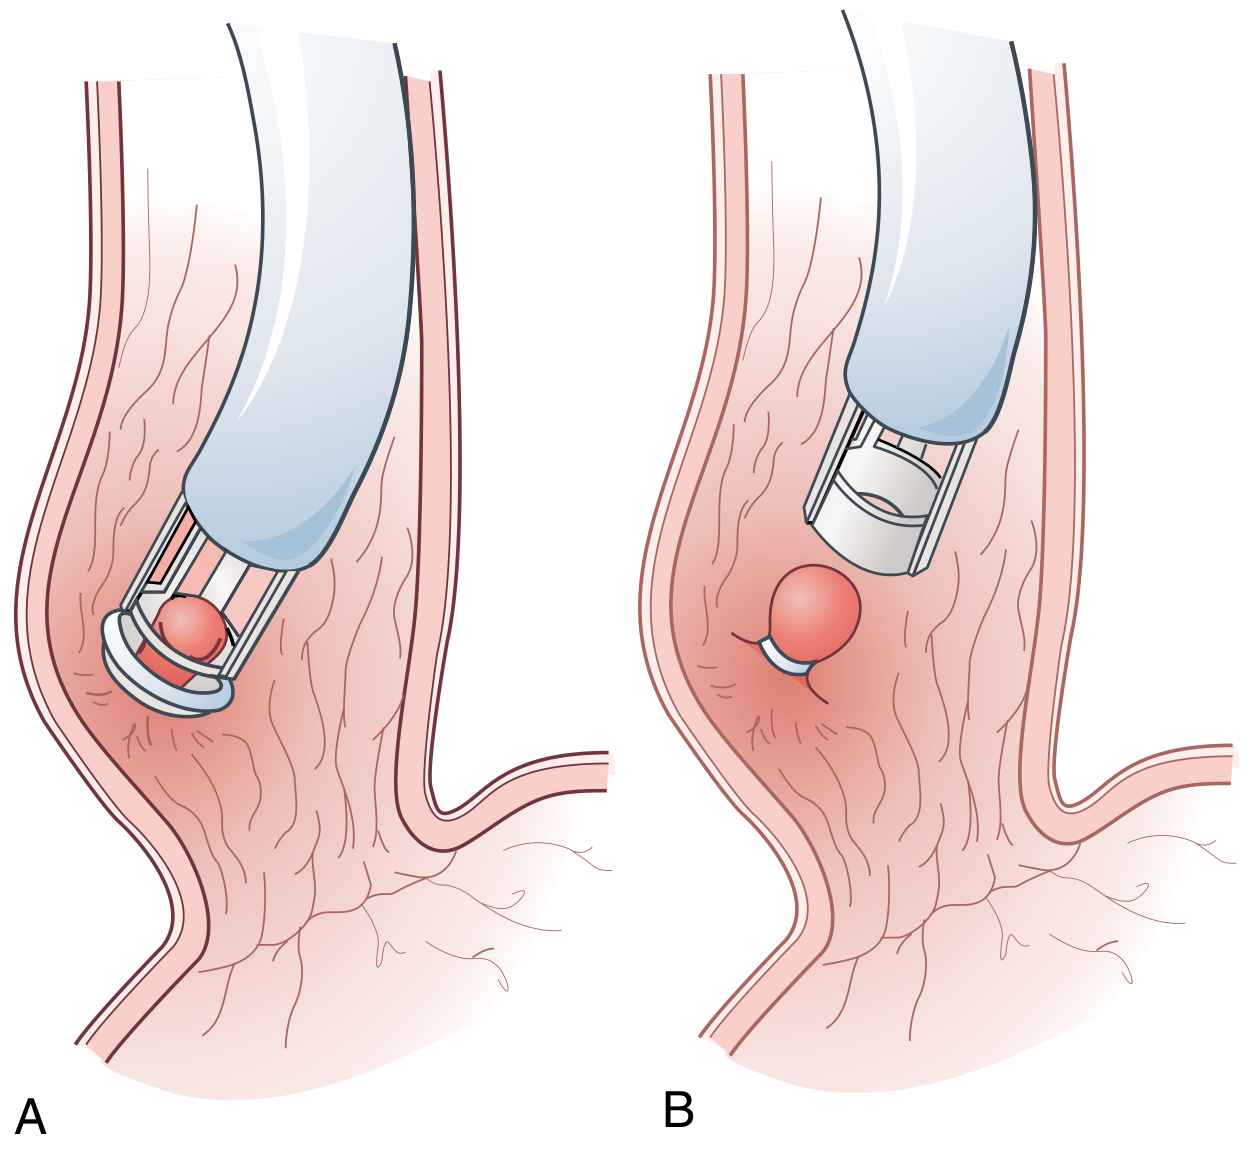
- Rebleeding occurs in ~50% of patients within the first year with endoscopic therapy alone
- Requires combination with pharmacotherapy (vasoactive agents) for best results
Endoscopic Sclerotherapy
- Alternative if EVL not available, but more complications
Real-world endoscopy progression:
IV. MANAGEMENT OF MODERATE ASCITES
Diagnostic Paracentesis
- Perform diagnostic paracentesis in all new or worsening ascites
- Check: protein, cell count, culture, pH, glucose, albumin
- SAAG >1.1 g/dL confirms portal hypertension as cause
Medical Management
- Low-sodium diet: upper limit 2,000 mg/day (45-90 mEq/day)
- Fluid restriction 1,000-1,500 mL/day if hyponatremia (Na <125 mEq/L)
- Spironolactone (aldosterone antagonist) + Furosemide in combination
- Starting ratio: spironolactone 100 mg : furosemide 40 mg daily
- Maximum doses: spironolactone 400 mg/day + furosemide 160 mg/day
- Monitor for: azotemia, hyponatremia, encephalopathy, hypokalemia/hyperkalemia
- ACE inhibitors and ARBs (worsen hemodynamics, increase mortality)
- NSAIDs (inhibit prostaglandins, impair renal function)
- Propranolol in refractory ascites (may decrease survival)
Large-Volume Paracentesis (LVP)
- Indicated for: tense or refractory ascites
- Must be combined with albumin infusion (6-8 g albumin per liter of ascites removed) to prevent post-paracentesis circulatory dysfunction
- (Mulholland and Greenfield's Surgery 7e; Sleisenger and Fordtran)
V. PREVENTION OF HEPATIC ENCEPHALOPATHY
- Lactulose orally or via NG tube (titrate to 2-3 soft stools/day)
- Rifaximin - recommended in combination with lactulose for prevention of recurrent HE (Grade IA recommendation)
- Clear blood from the bowel (lactulose helps)
- Avoid sedatives/opioids where possible
- (Current Surgical Therapy 14e)
VI. ESCALATION - SALVAGE THERAPY FOR REBLEEDING
Balloon Tamponade
- Sengstaken-Blakemore tube as a bridge (temporary hemostasis) if endoscopic therapy fails
- Should not remain inflated >24 hours
TIPS (Transjugular Intrahepatic Portosystemic Shunt)
- Indicated for: endoscopic treatment failure, recurrent bleeding, patients with refractory ascites + variceal bleed
- TIPS vs. endoscopy: Fewer rebleeds (19% vs 47%), but higher encephalopathy (34% vs less)
- Major limitation: shunt stenosis/thrombosis in up to 50% at 1 year (lower with PTFE-covered stents)
- Pre-emptive early TIPS (within 72 hours) shown to improve survival in high-risk patients (Child B/C)
Liver Transplantation
- Definitive treatment for decompensated cirrhosis
- Transplantation candidates should be listed early - patients should not be allowed to become too high-risk operatively
VII. SECONDARY PROPHYLAXIS (After Acute Bleed Stabilized)
- Non-selective beta-blockers (NSBBs): Propranolol or Carvedilol (preferred) - reduce portal pressure by reducing cardiac output and splanchnic vasodilation
- Repeated EVL sessions every 2-4 weeks until variceal eradication
- Combination of NSBB + EVL - most effective for secondary prophylaxis
- TIPS for NSBB + EVL failures
VIII. CHILD-PUGH / MELD ASSESSMENT
| Parameter | 1 pt | 2 pts | 3 pts |
|---|---|---|---|
| Bilirubin | <2 mg/dL | 2-3 | >3 |
| Albumin | >3.5 | 2.8-3.5 | <2.8 |
| INR | <1.7 | 1.7-2.3 | >2.3 |
| Ascites | None | Mild-moderate | Tense/refractory |
| Encephalopathy | None | Grade 1-2 | Grade 3-4 |
Key Points Summary
| Issue | First-Line Action |
|---|---|
| UGI Bleed - hemostasis | Octreotide/Terlipressin + EVL within 12 hrs |
| Infection prevention | Ceftriaxone 1g IV x 7 days |
| Transfusion target | Hb 7-8 g/dL (restrictive) |
| Moderate ascites | Spironolactone + Furosemide ± LVP with albumin |
| Encephalopathy prevention | Lactulose + Rifaximin |
| Rebleeding after endoscopy fails | TIPS |
| Long-term definitive | Liver transplant evaluation |