
Haemorrhagic shock/ hypovolemic shock 1. Cause in case of an accident 2. Stages of it 3. Describe the compensatory responses in compensatory stat. Give flowchart particularly of RAAS and Baro receptor 4. Describe other types of shock 5. Treatment of this particular shock with their physiological basis. Give flowchart of possible
hypovolemic hemorrhagic shock stages compensatory mechanisms flowchart
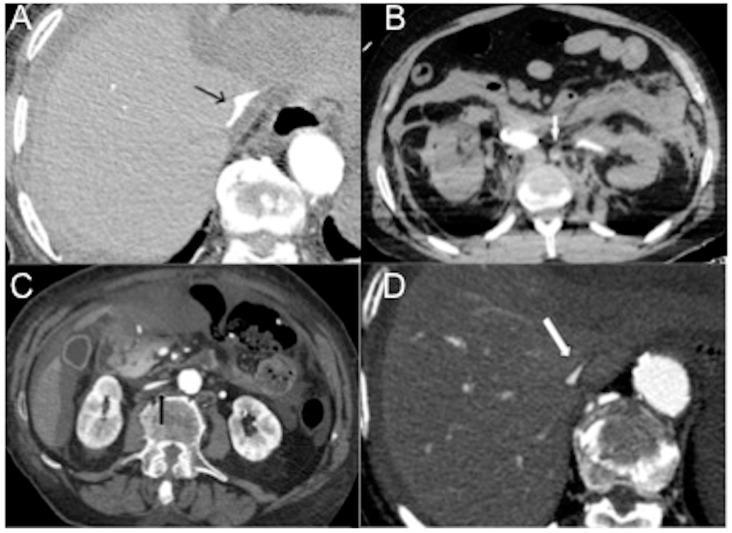
This set of four Contrast-Enhanced Computed Tomography (CECT) axial images illustrates the characteristic radiologic findings of hypovolemic shock across different subtypes. Image A demonstrates a 'slit-like' inferior vena cava (IVC) (arrow) at the level of the liver, signifying severe intravascular volume depletion. Image B shows a small-caliber, hypoenhanced aorta (arrow), a key feature of traumatic hemorrhagic shock following significant blood loss. Image C reveals a flat IVC (black arrow) associated with ascites, common in non-traumatic hypovolemic shock where circulating plasma volume is critically reduced. Image D exhibits a flat IVC with the 'halo sign' (white arrow), appearing as a low-attenuation ring around the vessel, often seen in traumatic hypovolemic shock such as severe burn injuries. Together, these diagnostic images highlight the vascular collapse of the IVC and aorta as primary indicators of inadequate perfusion and reduced cardiac preload, essential for identifying shock stages in emergency radiology.
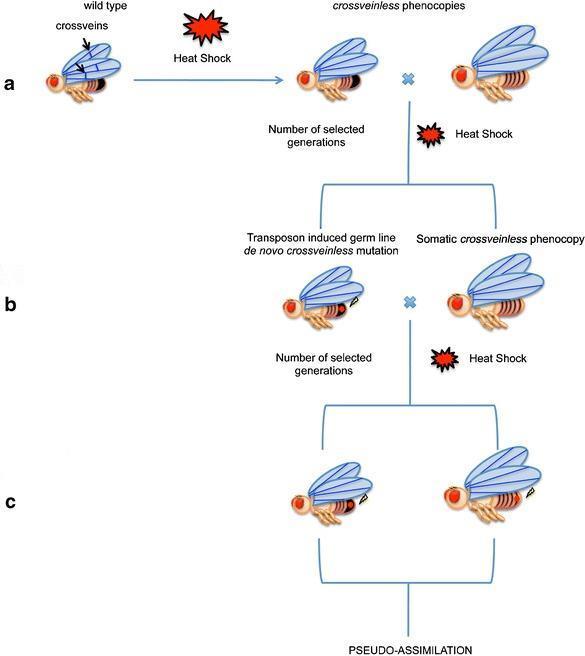
This pathophysiology diagram illustrates the process of genetic assimilation of stress-induced phenotypic traits, using Drosophila as a model organism. The flowchart is divided into three sequential stages: (a), (b), and (c). Stage (a) shows a 'wild type' fly characterized by distinct wing crossveins. Upon application of 'Heat Shock' (environmental stress), the phenotype shifts to 'crossveinless phenocopies,' which lack these wing structures. Stage (b) details the selection process over multiple generations. It distinguishes between a 'Transposon induced germ line de novo crossveinless mutation' and a 'Somatic crossveinless phenocopy.' Both groups are subjected to continued heat shock and selection. Stage (c) demonstrates the culmination of this process, termed 'PSEUDO-ASSIMILATION,' where the trait becomes fixed in the population. The diagram explains the interplay between environmental stressors, transposon activation, and natural selection in converting a transient somatic response into a heritable genetic trait. This model is relevant to understanding epigenetic mechanisms, stress response, and evolutionary biology.
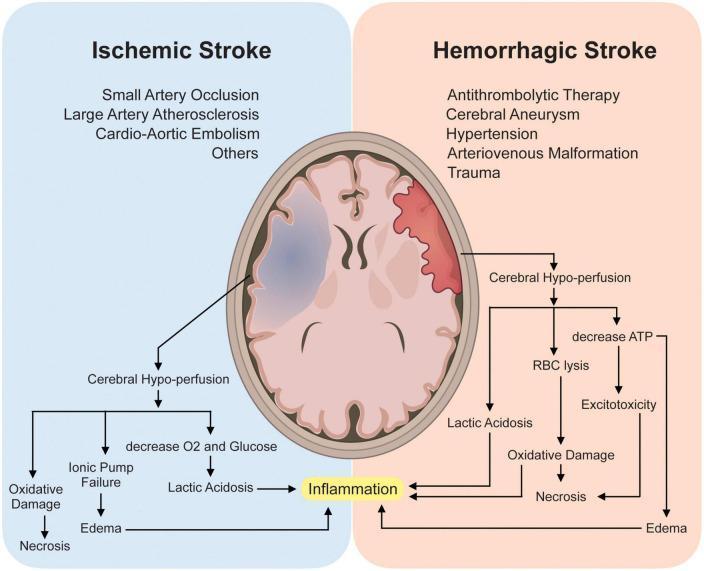
This medical infographic and pathophysiology flowchart compare Ischemic and Hemorrhagic stroke mechanisms. At the top, two axial brain illustrations highlight affected regions: a blue-shaded area in the left hemisphere represents ischemia, while a red-shaded area in the right hemisphere represents hemorrhage. Listed etiologies for Ischemic Stroke include small artery occlusion, large artery atherosclerosis, and cardio-aortic embolism. Hemorrhagic causes include antithrombolytic therapy, aneurysm, hypertension, arteriovenous malformation, and trauma. Below the illustrations, a logic flow depicts both conditions leading to cerebral hypo-perfusion. The ischemic pathway outlines oxygen/glucose deprivation, ionic pump failure, and lactic acidosis. The hemorrhagic pathway highlights red blood cell (RBC) lysis and ATP depletion. Both pathways converge on common secondary brain injury mechanisms: neuroinflammation, excitotoxicity, oxidative damage, and cerebral edema, all of which terminate in neuronal necrosis. This diagram serves as an educational tool for neurology students to understand the diverging initiating events and converging molecular outcomes of different stroke types.
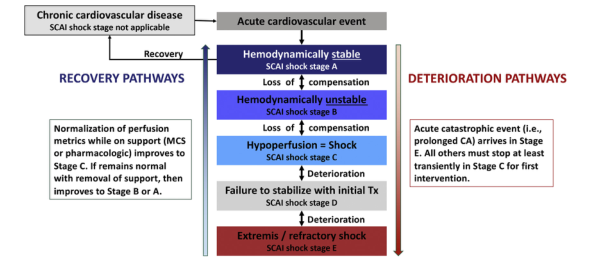
Summary : This flowchart illustrates the progression and recovery pathways of patients experiencing acute cardiovascular events, using the SCAI shock staging system (Stages A–E). It details both recovery and deterioration routes, criteria for stage transitions, and the impact of interventions. flowchart: # Nodes : • Chronic cardiovascular disease (rectangle): "SCAI shock stage not applicable" • Acute cardiovascular event (rectangle) • Hemodynamically stable (rectangle): "SCAI shock stage A" • Hemodynamically unstable (rectangle): "SCAI shock stage B" • Hypoperfusion = Shock (rectangle): "SCAI shock stage C" • Failure to stabilize with initial Tx (rectangle): "SCAI shock stage D" • Extremis / refractory shock (rectangle): "SCAI shock stage E" • Recovery pathway annotation (rectangle): "Normalization of perfusion metrics while on support (MCS or pharmacologic) improves to Stage C. If remains normal with removal of support, then improves to Stage B or A." • Deterioration pathway annotation (rectangle): "Acute catastrophic event (i.e., prolonged CA) arrives in Stage E. All others must stop at least transiently in Stage C for first intervention." # Connectors : • Arrow from "Chronic cardiovascular disease" to "Acute cardiovascular event" • Arrow from "Acute cardiovascular event" down through each SCAI shock stage (A → B → C → D → E), labeled with "Loss of compensation" or "Deterioration" at each transition. • Upward arrow labeled "Recovery" from "Acute cardiovascular event" to "Chronic cardiovascular disease" • Upward arrows on the left side labeled "RECOVERY PATHWAYS" indicating improvement from lower to higher (better) stages. • Downward arrows on the right side labeled "DETERIORATION PATHWAYS" indicating worsening from higher to lower (worse) stages. • Annotations on both sides explaining criteria for recovery and deterioration. # Layout : • Central vertical column with SCAI shock stages (A–E) in descending order. • Left side: Recovery pathways and annotation box. • Right side: Deterioration pathways and annotation box. • Arrows indicate direction of patient progression (up for recovery, down for deterioration). # Analysis : • The diagram visually separates recovery and deterioration pathways for patients with acute cardiovascular events. • Recovery is possible at any stage if perfusion normalizes, with potential to move up to less severe stages. • Deterioration is stepwise, with each loss of compensation or failure to stabilize leading to a worse SCAI shock stage. • Catastrophic events can cause immediate transition to the most severe stage (E), but all other deteriorations must pass through stage C for intervention. • The flowchart emphasizes the importance of early intervention at stage C and the potential for reversal with appropriate support.
RAAS renin angiotensin aldosterone system shock baroreceptor reflex sympathetic nervous response
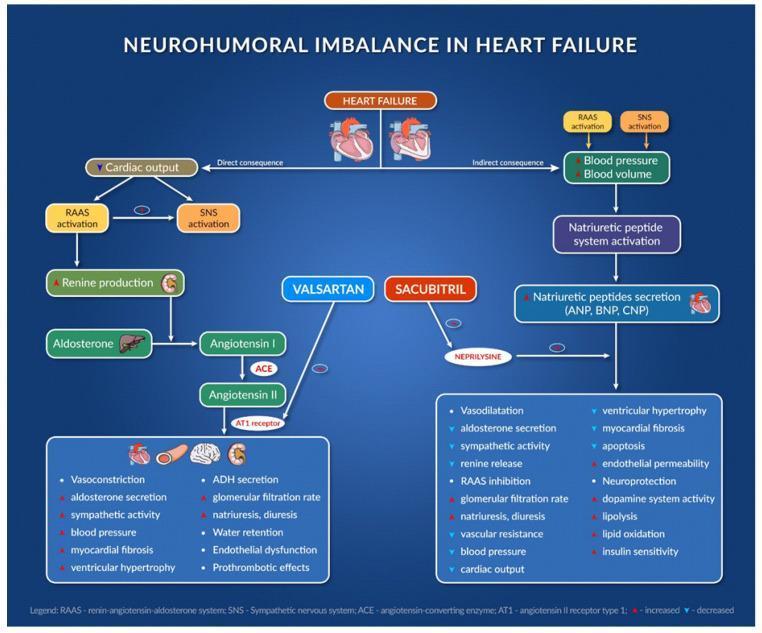
A complex pathophysiology diagram and pharmacological flowchart titled 'Neurohumoral Imbalance in Heart Failure'. It illustrates the interaction between the Renin-Angiotensin-Aldosterone System (RAAS), the Sympathetic Nervous System (SNS), and the Natriuretic Peptide (NP) system in the context of heart failure. The left side of the diagram outlines the RAAS cascade: Renin production leads to Angiotensin I, which is converted to Angiotensin II by ACE, ultimately binding to the AT1 receptor to cause deleterious effects like vasoconstriction, myocardial fibrosis, and water retention. The right side shows the NP system (ANP, BNP, CNP) which promotes diuresis and vasodilation. Centrally, the diagram depicts the pharmacological intervention of the ARNI class: Valsartan (an ARB) inhibiting the AT1 receptor, and Sacubitril (a neprilysin inhibitor) preventing the breakdown of natriuretic peptides. A comparison list at the bottom contrasts the pathological effects of uncontrolled RAAS/SNS activation against the beneficial physiological outcomes of ARNI therapy, including reduced ventricular hypertrophy, increased insulin sensitivity, and improved cardiac output. The diagram uses standard medical icons for the heart, kidneys, and liver to indicate anatomical sites of hormone production and action.
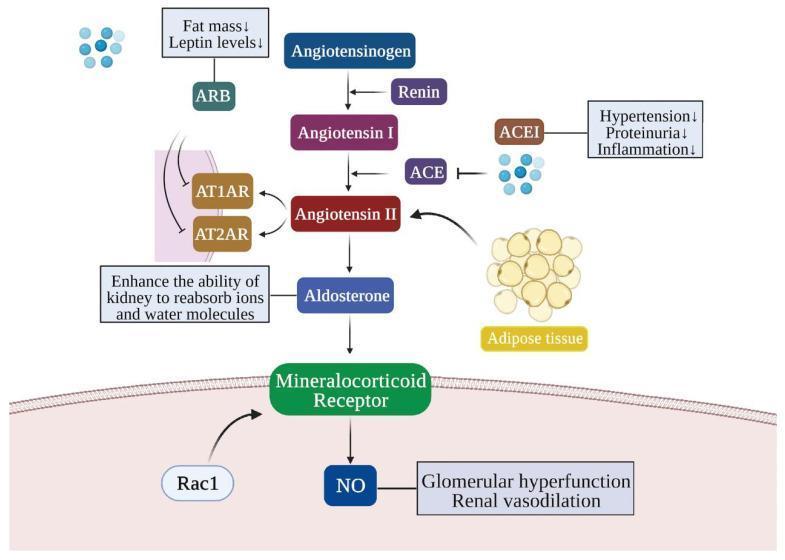
This pathophysiology diagram illustrates the Renin-Angiotensin-Aldosterone System (RAAS) pathway and its role in obesity-related kidney injury, highlighting pharmaceutical intervention points. The central pathway shows the enzymatic conversion of Angiotensinogen to Angiotensin I by Renin, and Angiotensin I to Angiotensin II via Angiotensin-Converting Enzyme (ACE). Angiotensin II acts on receptors AT1AR and AT2AR, facilitating kidney reabsorption of ions and water. The diagram specifically notes that adipose tissue contributes to increased Angiotensin II levels. Further down the cascade, Angiotensin II stimulates Aldosterone, which activates the Mineralocorticoid Receptor (supported by Rac1). This activation leads to the production of Nitric Oxide (NO), contributing to glomerular hyperfunction and renal vasodilation. Two major drug classes are highlighted: ACE Inhibitors (ACEI), which block the ACE enzyme to reduce hypertension, proteinuria, and inflammation; and Angiotensin Receptor Blockers (ARB), which inhibit AT1AR/AT2AR receptors and are associated with decreased fat mass and leptin levels.
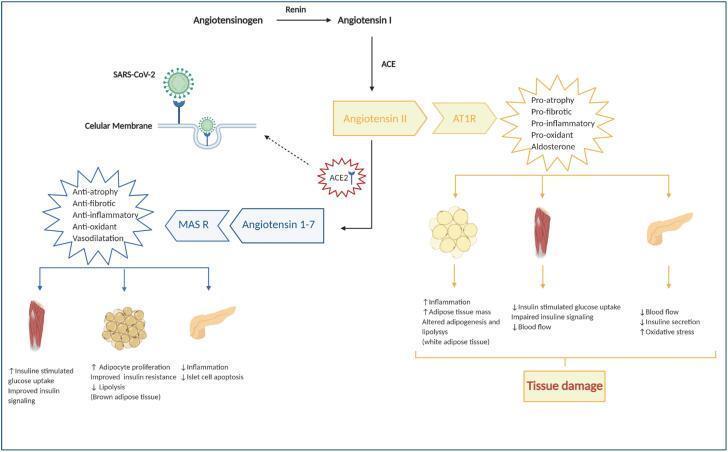
A pathophysiology diagram illustrating the Renin-Angiotensin-Aldosterone System (RAAS) and its deregulation in the context of COVID-19. The diagram outlines two competing metabolic pathways starting from Angiotensinogen. The primary pathway involves Renin converting Angiotensinogen to Angiotensin I, followed by ACE converting it to Angiotensin II. Binding of Angiotensin II to the AT1R receptor triggers pro-atrophy, pro-fibrotic, pro-inflammatory, and pro-oxidant effects, leading to tissue damage in white adipose tissue (increased inflammation and mass), skeletal muscle (impaired insulin signaling and blood flow), and the pancreas (reduced insulin secretion and blood flow). A counter-regulatory pathway shows ACE2 converting Angiotensin II into Angiotensin 1-7, which binds to the MAS receptor (MAS R) to produce protective anti-inflammatory, anti-fibrotic, and vasodilatory effects, improving insulin signaling in muscle and brown adipose tissue while reducing islet cell apoptosis in the pancreas. Critically, the diagram shows SARS-CoV-2 binding to the ACE2 receptor on the cellular membrane, inhibiting this protective pathway and shifting the balance toward tissue damage and systemic inflammation.
Haemorrhagic (Hypovolaemic) Shock - Complete Notes
1. Causes in Case of an Accident (Trauma)
- Scalp lacerations (highly vascular; can lose >500 mL)
- Limb amputations or major vessel lacerations
- Open fractures
- Chest (haemothorax): Rib fractures, aortic or great vessel injury - up to 2-3 L can accumulate
- Abdomen (haemoperitoneum): Splenic laceration (most common solid organ injury), hepatic injury, mesenteric vessel tears, bowel injury
- Pelvis: Pelvic ring fractures - can accommodate 3-4 L of blood; associated with massive venous plexus bleeding
- Long bone fractures: Femur fracture - approximately 1-1.5 L; tibia - 0.5 L; each humerus - 0.3 L
- Retroperitoneum: Aortic or vena cava injury
- Tension pneumothorax (obstructive component)
- Cardiac tamponade (haemopericardium from penetrating injury)
- Spinal cord injury (superimposed neurogenic shock)
- Burns (plasma loss, not blood loss - hypovolaemic but not haemorrhagic)
2. Stages of Haemorrhagic Shock
ATLS Classification (by volume of blood loss)
| Feature | Class I | Class II | Class III | Class IV |
|---|---|---|---|---|
| Blood loss (%) | 0-15% | 15-30% | 30-40% | >40% |
| Blood loss (adult, ~5L total) | <750 mL | 750-1500 mL | 1500-2000 mL | >2000 mL |
| Pulse (beats/min) | <100 | >100 | >120 | >140 |
| Blood pressure | Normal | Normal | Decreased | Decreased |
| Pulse pressure | Normal | Decreased | Decreased | Decreased |
| Respiratory rate | 14-20/min | 20-30/min | 30-40/min | >35/min |
| Urine output (mL/hr) | >30 | 20-30 | 5-15 | Negligible |
| Mental status | Slightly anxious | Mildly anxious | Anxious/Confused | Confused/Lethargic |
| Fluid replacement | Crystalloid | Crystalloid | Crystalloid + Blood | Crystalloid + Blood |
Note: The ATLS thresholds are recognised as somewhat arbitrary. Children compensate more effectively (higher cardiac reserve) and decompensate suddenly. Elderly patients decompensate at lower volumes due to reduced cardiac reserve and baseline use of beta-blockers/antihypertensives.
Pathophysiological Stages (Robbins & Kumar)
-
Nonprogressive (Compensated) Stage
- Reflex compensatory mechanisms activated
- Vital organ perfusion is maintained
- Reversible with correction of cause
-
Progressive Stage
- Compensatory mechanisms overwhelmed
- Widespread tissue hypoperfusion
- Anaerobic glycolysis → lactic acidosis → metabolic acidosis
- Arteriolar dilation, microvascular pooling
- Risk of DIC from endothelial injury
- Vital organs (kidney, gut, brain, heart) begin to fail
-
Irreversible Stage
- Cellular injury so profound that survival is impossible even if haemodynamics are corrected
- Lysosomal enzyme leakage worsens shock
- Myocardial contractility deteriorates (↑ nitric oxide synthesis)
- Ischaemic gut allows translocation of intestinal bacteria → superimposed septic shock
- Acute kidney injury from ischaemia
- Death from multiple organ failure
3. Compensatory Responses in the Nonprogressive (Compensated) Stage
Overview of Compensatory Mechanisms
- Venous return → ↓ preload → ↓ cardiac output → ↓ blood pressure
- Renal perfusion pressure
- Oxygen delivery to tissues
A. BARORECEPTOR REFLEX - Flowchart
HAEMORRHAGE / BLOOD LOSS
        |
        ↓
↓ Mean Arterial Pressure (MAP) + ↓ Cardiac Output
        |
        ↓
AORTIC ARCH & CAROTID SINUS BARORECEPTORS
(mechanoreceptors detect ↓ wall stretch)
        |
        ↓
↓ Inhibitory afferent signals to cardiovascular centre
(↓ firing of glossopharyngeal CN IX and vagus CN X)
        |
        ↓
MEDULLARY CARDIOVASCULAR CENTRES ACTIVATED
(vasomotor centre + cardioacceleratory centre)
        |
    ____↓____
   |         |
   ↓         ↓
SYMPATHETIC    PARASYMPATHETIC
ACTIVATION     WITHDRAWAL
(↑ noradrenaline)   (↓ vagal tone)
   |         |
   ↓         ↓
• Tachycardia       • Further tachycardia
• ↑ Myocardial contractility
• Peripheral vasoconstriction
  (skin, gut, muscle → blood shunted
   to brain & heart)
• Adrenal medulla → ↑ Adrenaline + Noradrenaline
        |
        ↓
NET EFFECT:
↑ Heart Rate + ↑ Stroke Volume → ↑ Cardiac Output
↑ SVR → Restore MAP
Cutaneous vasoconstriction → Cold, clammy, pale skin
B. RAAS (Renin-Angiotensin-Aldosterone System) - Flowchart
HAEMORRHAGE
        |
        ↓
↓ Renal perfusion pressure
(↓ stretch of afferent arteriole)
        |
        ↓  Also triggered by:
JUXTAGLOMERULAR CELLS ← Sympathetic β₁ stimulation
        |                ← ↓ NaCl delivery to macula densa
        ↓
RENIN SECRETION
        |
        ↓
ANGIOTENSINOGEN (produced by liver)
        | (cleaved by Renin)
        ↓
ANGIOTENSIN I (Ang I)
        | (ACE - Angiotensin Converting Enzyme)
        | (mainly in pulmonary endothelium)
        ↓
ANGIOTENSIN II (Ang II)
        |
    ____↓_______________
   |                   |
   ↓                   ↓
ADRENAL CORTEX    VASCULAR SMOOTH MUSCLE
(Zona glomerulosa) (AT₁ receptors)
   |                   |
   ↓                   ↓
ALDOSTERONE       VASOCONSTRICTION
SECRETION         (↑ SVR → ↑ MAP)
   |
   ↓
RENAL DISTAL TUBULE & COLLECTING DUCT
   |
   ↓
↑ Na⁺ reabsorption → ↑ Water retention
↑ K⁺ excretion
   |
   ↓
↑ Blood volume → ↑ Preload → ↑ Cardiac Output

ADDITIONAL Ang II EFFECTS:
• Stimulates ADH (vasopressin) from posterior pituitary
• Stimulates thirst centre (hypothalamus)
• Noradrenaline release potentiation
• ↑ Splanchnic vasoconstriction
C. ADH (Vasopressin) Response
↓ Blood volume / ↓ BP detected by
hypothalamic osmoreceptors + baroreceptors
+ Ang II stimulation
        |
        ↓
POSTERIOR PITUITARY → ↑ ADH (Vasopressin) secretion
        |
    ____↓___________
   |               |
   ↓               ↓
RENAL COLLECTING  VASCULAR
DUCT (V2 receptor) (V1 receptor)
   |               |
   ↓               ↓
↑ Water retention  Splanchnic &
(aquaporin-2)      peripheral
↑ Concentrated urine vasoconstriction
D. Other Compensatory Mechanisms
| Mechanism | Trigger | Effect |
|---|---|---|
| Transcapillary fluid shift | ↓ Capillary hydrostatic pressure | Interstitial fluid moves into vascular compartment ("autotransfusion") |
| Splenic contraction | Sympathetic stimulation | Releases stored RBCs into circulation |
| Stress hyperglycaemia | Catecholamines, cortisol, glucagon | Glycogenolysis, gluconeogenesis - provides energy substrate |
| Tachypnoea | Hypoxia, acidosis | ↑ Respiratory rate compensates for metabolic acidosis (↓ PaCO₂) |
| Cerebral autoregulation | Intrinsic vessel tone | Maintains CBF despite ↓ MAP |
- Tachycardia (most sensitive early sign)
- Normal or slightly reduced BP (pulse pressure narrows first)
- Cool, pale, clammy skin (peripheral vasoconstriction)
- Oliguria (renal conservation of fluid)
- Anxious/restless mental state
4. Other Types of Shock
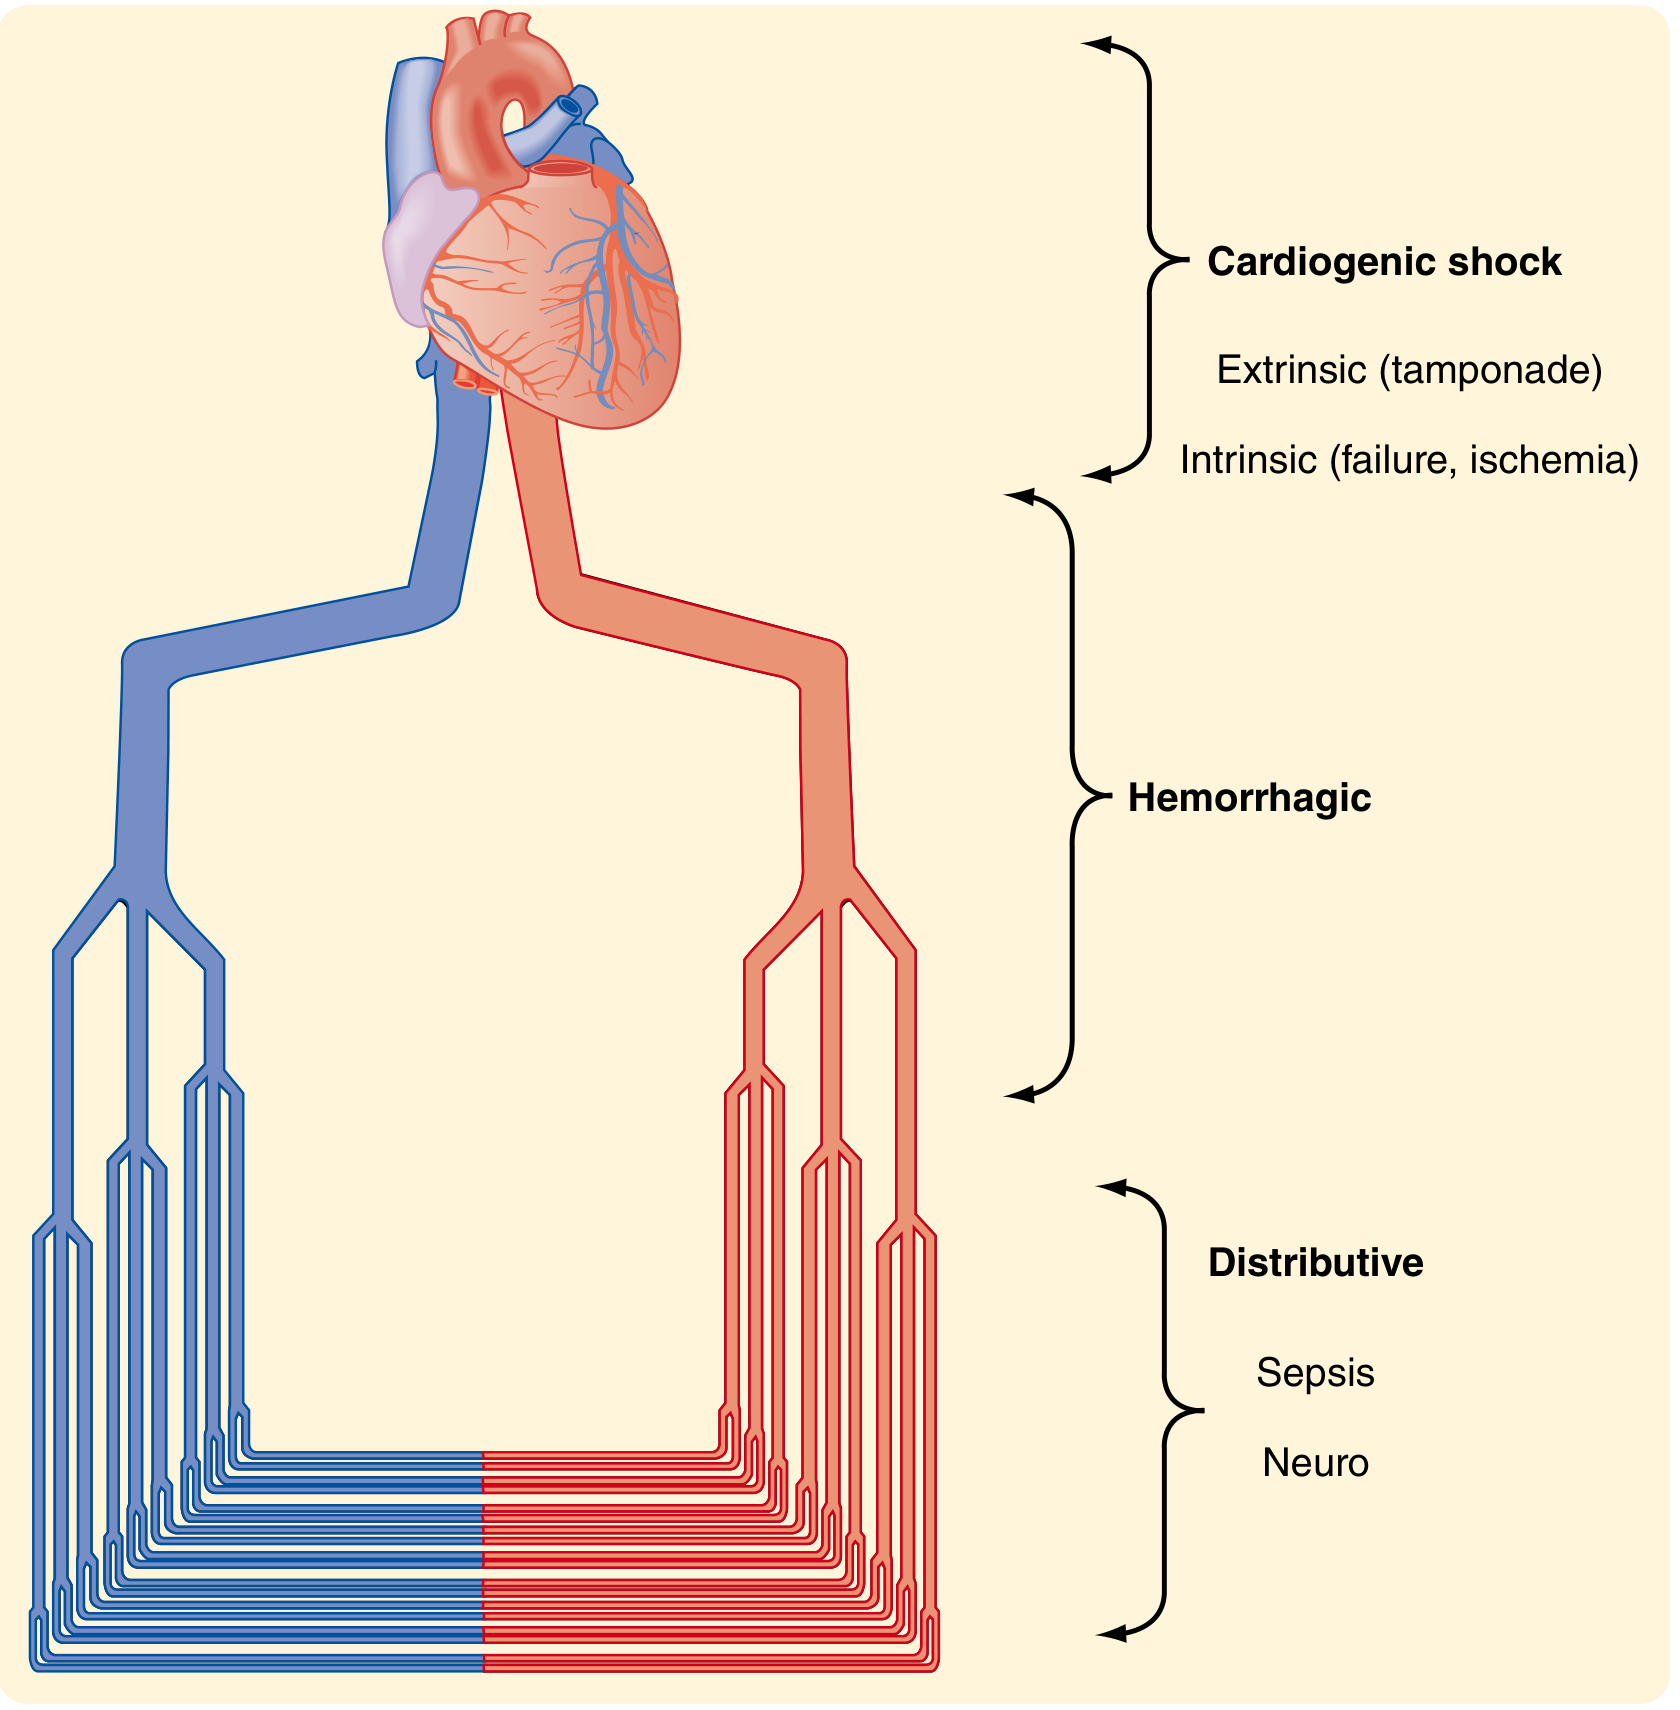
A. Cardiogenic Shock
| Feature | Detail |
|---|---|
| Definition | Inadequate tissue perfusion due to primary cardiac pump failure, despite adequate intravascular volume |
| Causes | Anterior wall MI (most common), arrhythmias (VT/VF), acute severe valvular disease (ruptured papillary muscle), myocarditis, cardiac tamponade (extrinsic), massive PE |
| Haemodynamics | ↓ CO, ↑ SVR, ↑ PAOP (wedge pressure), ↑ CVP, ↓ SvO₂ |
| Clinical features | Hypotension, tachycardia, JVP elevated (distinguishes from hypovolaemic), pulmonary oedema (crackles), S3 gallop, cool peripheries |
| Key difference from hypovolaemic | JVP raised (not flat); lungs congested, not clear |
B. Extracardiac Obstructive Shock
| Feature | Detail |
|---|---|
| Definition | External obstruction to cardiac filling or outflow impairs pump function |
| Causes | Cardiac tamponade (blood in pericardial sac), tension pneumothorax (↑ intrathoracic pressure compresses SVC/heart), massive pulmonary embolism, aortic coarctation, myxoma |
| Cardiac tamponade | Beck's triad: ↓ BP + ↑ JVP + muffled heart sounds; pulsus paradoxus |
| Tension pneumothorax | Tracheal deviation (late sign), ↑ JVP, absent breath sounds, haemodynamic collapse |
| Haemodynamics | ↓ CO, ↑ SVR, ↑ CVP, ↓ PAOP (in tamponade, PAOP & CVP equalise) |
| Treatment | Relieve obstruction: pericardiocentesis for tamponade; needle decompression then chest drain for tension pneumothorax |
C. Distributive Shock (the "warm shocks")
- Most common form of distributive shock
- Triggered by gram-positive bacteria (most common now), gram-negative, fungi
- Mechanism: Pattern recognition receptors (TLRs) detect PAMPs (LPS, peptidoglycan) → massive cytokine release (TNF-α, IL-1, IL-6) → ↑ NO synthesis → profound vasodilation → ↓ SVR → distributive hypoperfusion
- Also: endothelial activation, microvascular thrombosis (DIC), capillary leak
- Early presentation: WARM skin, flushed, bounding pulse (high CO initially) - distinguishes from other shocks
- Late: cardiovascular collapse, myocardial depression, MODS
- Haemodynamics: ↑ CO, ↓ SVR, ↓ PAOP initially; later ↓ CO as myocardium fails
- Spinal cord injury above T6 → loss of sympathetic vasomotor tone below lesion
- Mechanism: Loss of sympathetic efferents → profound vasodilation + bradycardia (unopposed vagal tone)
- Classic triad: Hypotension + Bradycardia + Warm dry skin (unlike all other shocks where skin is cold and clammy)
- Mechanism differs from haemorrhagic: it is NOT volume depletion, but redistribution
- Haemodynamics: ↓ CO, ↓ SVR, normal/↓ CVP
- Treatment: vasopressors (noradrenaline) + cautious fluids + spinal stabilisation
- IgE-mediated type I hypersensitivity → mast cell degranulation → histamine, leukotrienes, prostaglandins
- Mechanism: Massive vasodilation + ↑ capillary permeability + bronchospasm
- Triggers: bee stings, peanuts, latex, penicillin, contrast dye
- Features: urticaria, angioedema, bronchospasm, ↓ BP, ↑ HR
- Treatment: Adrenaline (IM) is the cornerstone
| Type | CO | SVR | PAOP | CVP | SvO₂ |
|---|---|---|---|---|---|
| Hypovolaemic | ↓ | ↑ | ↓ | ↓ | ↓ |
| Cardiogenic (LV MI) | ↓ | ↑ | ↑ | N/↑ | ↓ |
| Distributive (septic, early) | ↑ | ↓ | ↓ | ↓ | ↑ |
| Obstructive (tamponade) | ↓ | ↑ | ↑ = CVP | ↑ | ↓ |
5. Treatment of Haemorrhagic Shock - With Physiological Basis
Treatment Flowchart
PATIENT WITH SUSPECTED HAEMORRHAGIC SHOCK
(trauma victim: hypotension, tachycardia, pale, cold, clammy)
                |
                ↓
        PRIMARY SURVEY (ABCDE)
      Airway → Breathing → Circulation
                |
         _____ ↓ _____
        |             |
    EXTERNAL        INTERNAL
    HAEMORRHAGE     HAEMORRHAGE
        |             |
   Direct pressure   Identify source:
   Tourniquets       • FAST ultrasound
   Wound packing     • CXR / Pelvis XR
   Haemostatic       • CT Angiography
   dressings
                |
                ↓
      DEFINITIVE HAEMORRHAGE CONTROL
      (surgery, interventional radiology,
       pelvic binder, wound packing)
                |
                ↓
      ESTABLISH IV ACCESS (2 large-bore IVs)
      Baseline bloods: FBC, U&E, LFT, coagulation,
      Group & Crossmatch, ABG, Lactate
                |
         _____ ↓ ______
        |               |
    Class I-II         Class III-IV
    (Crystalloid)      (Blood products)
        |               |
   Warmed lactated  Activate MASSIVE
   Ringer's or      TRANSFUSION PROTOCOL
   Normal saline    1:1:1 ratio:
   1-2 L bolus      PRBC : FFP : Platelets
                |
                ↓
        PERMISSIVE HYPOTENSION
        (target SBP 80-90 mmHg until
         definitive haemostasis achieved)
         [Not in TBI or pregnancy]
                |
                ↓
        PREVENT "LETHAL TRIAD"
        Acidosis + Hypothermia + Coagulopathy
                |
       _________↓_________
      |          |         |
   Treat      Warm        Treat
   acidosis   patient +   coagulopathy
   (fix        fluids      (FFP, platelets,
   perfusion)              cryoprecipitate,
                           TXA)
                |
                ↓
        MONITOR ENDPOINTS
        • Urine output >0.5 mL/kg/hr
        • MAP >65 mmHg
        • ↓ Lactate / lactate clearance
        • Base deficit normalising
        • SvO₂ > 65%
        • Coagulation studies normalising
Treatment in Detail with Physiological Basis
A. Haemorrhage Control (Source Control)
- External: Direct pressure, tourniquets, haemostatic dressings (kaolin-based, e.g., QuikClot)
- Internal abdominal/thoracic: Emergency surgery (laparotomy, thoracotomy)
- Pelvic fractures: Pelvic binder (reduces pelvic volume, tamponades venous bleeding), angioembolisation
- Damage control surgery: Abbreviated initial surgery to stop haemorrhage and contamination, then ICU resuscitation, then definitive repair
B. Fluid Resuscitation
- Physiological basis: Replace depleted interstitial and intravascular fluid compartments. Only ~25% of infused crystalloid remains intravascular (remainder enters interstitium due to colloid osmotic pressure difference).
- Lactated Ringer's is preferred over normal saline to avoid hyperchloraemic metabolic acidosis.
- LR does NOT worsen lactic acidosis - lactate is metabolised to bicarbonate in the liver.
- Limitation: Large-volume crystalloid infusion causes dilutional coagulopathy, hypothermia, ARDS, abdominal compartment syndrome.
- Packed Red Blood Cells (PRBCs): Restore haemoglobin - directly increases oxygen-carrying capacity (CaO₂). Each unit raises Hb by ~1 g/dL.
- Fresh Frozen Plasma (FFP): Replaces all coagulation factors (I, II, V, VII, VIII, IX, X, XI). Physiological basis: massive haemorrhage + dilution consumes/dilutes clotting factors → consumptive and dilutional coagulopathy.
- Platelets: Dilutional thrombocytopenia occurs; platelets <50,000/mL impairs surgical haemostasis.
- Massive Transfusion Protocol (1:1:1): Evidence-based ratio of PRBC:FFP:Platelets mimics whole blood. Prevents "resuscitation coagulopathy."
- Cryoprecipitate: Concentrated source of fibrinogen and Factor VIII when FFP is insufficient.
- Physiological basis: Inhibits fibrinolysis by blocking plasminogen and plasmin binding to fibrin. Shock activates the fibrinolytic system → clots are lysed before haemostasis is established.
- Effective when given within 3 hours of injury.
- Primarily beneficial in severe haemorrhagic shock.
- Source: Mulholland's Surgery - "Recent support has emerged to suggest the addition of tranexamic acid (TXA) for patients suffering from exsanguinating haemorrhage."
C. Permissive Hypotension (Hypotensive Resuscitation)
- Physiological basis: Aggressive fluid resuscitation before haemostasis raises BP → dislodges soft clots → worsens bleeding. Maintaining SBP 80-90 mmHg (MAP ~50 mmHg) until surgical haemostasis is achieved reduces re-bleeding.
- Contraindicated in traumatic brain injury (TBI), spinal cord injury, and pregnancy (these organs require higher perfusion pressure).
D. Treating the "Lethal Triad"
          LETHAL TRIAD
         _____|_______
        |      |      |
   Acidosis  Hypo-  Coagulopathy
             thermia
        |      |      |
        ↓      ↓      ↓
   Fix    Warm   FFP + platelets
   source  IV    + cryoprecipitate
   of shock fluids + TXA
   (not    + forced
   bicarb  air
   alone)  warming
- Acidosis: Best treated by restoring perfusion (fixing cause). Sodium bicarbonate corrects pH but does NOT fix the underlying problem; can paradoxically worsen intracellular acidosis. THAM (tromethamine) is an alternative buffer that buffers CO₂ without generating it.
- Hypothermia: Room-temperature crystalloids + open body cavities = rapid heat loss. Use warmed fluids, forced-air warming blankets. Hypothermia worsens coagulopathy (enzyme function is temperature-dependent).
- Coagulopathy: Dilutional + consumptive. Correct with 1:1:1 resuscitation, TXA, avoid excessive crystalloids.
E. Vasopressors
- Used when volume resuscitation alone is insufficient to restore MAP
- Noradrenaline (norepinephrine): First-line vasopressor - acts on α₁ receptors → vasoconstriction → ↑ SVR → ↑ MAP
- Vasopressin (ADH): Adjunct vasopressor; acts on V1 receptors; endogenous levels are depleted in prolonged shock; "vasopressin-deficiency" state
- Physiological basis: Vasopressors restore perfusion pressure to vital organs when CO is being restored; they do NOT replace volume.
F. Monitoring Endpoints
| Parameter | Target | Physiological basis |
|---|---|---|
| Urine output | >0.5 mL/kg/hr | Surrogate of renal perfusion; aldosterone suppression with adequate volume |
| MAP | >65 mmHg | Minimum to maintain cerebral/renal autoregulation |
| Lactate clearance | ↓ by >10%/2hr; <2 mmol/L | Marker of tissue perfusion and oxygen debt repayment |
| Base deficit | Normalising (0 ± 2) | Reflects metabolic acidosis reversal |
| SvO₂ / ScvO₂ | >65% / >70% | Oxygen extraction ratio reflects supply-demand balance |
Radiology of Hypovolaemic Shock (CT findings)
- Flat/slit-like IVC (↓ preload, volume depletion)
- Small-calibre, hypo-enhancing aorta (in traumatic haemorrhagic shock)
- "Shock bowel" - hyperenhancing bowel wall with dilated fluid-filled loops
- Adrenal hyperenhancement (stress response)
Summary: Physiological Basis of Each Treatment
| Treatment | Physiological Target | Mechanism |
|---|---|---|
| Haemorrhage control | Stop blood loss | Ends the primary insult |
| Crystalloid | ↑ Intravascular volume | Raises preload → ↑ CO (Frank-Starling) |
| PRBCs | ↑ O₂ carrying capacity | Restores CaO₂ = Hb × 1.34 × SaO₂ |
| FFP | Replace clotting factors | Prevents/reverses coagulopathy |
| Platelets | Restore haemostasis | Enables primary platelet plug |
| TXA | Block fibrinolysis | Preserves formed clots |
| Permissive hypotension | Reduce hydrostatic clot disruption | Protects newly formed clots |
| Vasopressors | ↑ SVR/MAP | Restores perfusion pressure |
| Warming | Restore enzyme function | Coagulation factors work optimally at 37°C |
| Correct acidosis (source) | Restore metabolic environment | Coagulation cascade pH-dependent |
- Robbins, Cotran & Kumar: Pathologic Basis of Disease - Shock, Stages, Morphology
- Sabiston Textbook of Surgery - ATLS Classes, Haemorrhagic Shock, RAAS
- Mulholland and Greenfield's Surgery (7e) - Neuroendocrine Response, Fluid Therapy, Lethal Triad
- Robbins & Kumar Basic Pathology - Shock Types and Pathogenesis