
COMPLIANCE OF RESPIRATORY SYSTEM
respiratory compliance lung pressure volume curve
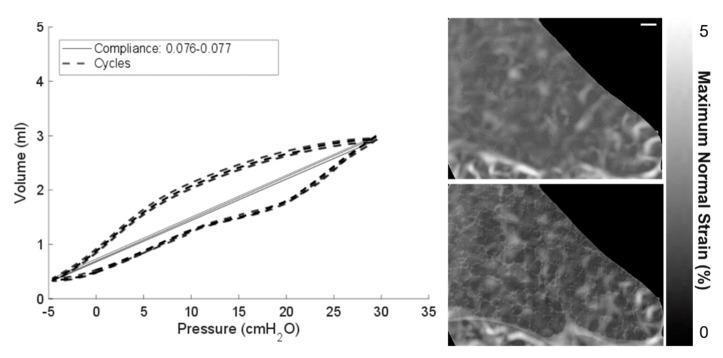
This composite educational graphic details lung mechanical ventilation reliability and tissue strain analysis using digital volume correlation (DVC). The left panel displays a Pressure-Volume (P-V) curve plot, showing the relationship between Pressure (cmH2O, x-axis from -5 to 35) and Volume (ml, y-axis from 0 to 5). Four ventilation cycles are overlaid as dashed lines, demonstrating sigmoidal hysteretic loops characteristic of respiratory compliance. A solid grey line indicates a consistent compliance range of 0.076–0.077. The right panel consists of two vertically stacked DVC strain field images of lung tissue within an intact thorax, labeled with a 200 µm scale bar. The top image shows the unfiltered strain field, while the bottom image shows the same field after Paganin filtering. The filtered version displays improved contrast between tissue and air by reducing noise within tissue boundaries. Both images include a grayscale color bar indicating 'Maximum Normal Strain (%)' ranging from 0 to 5. This figure illustrates the application of biomedical engineering principles to visualize local lung tissue deformation and characterize pulmonary mechanics during mechanical loading.
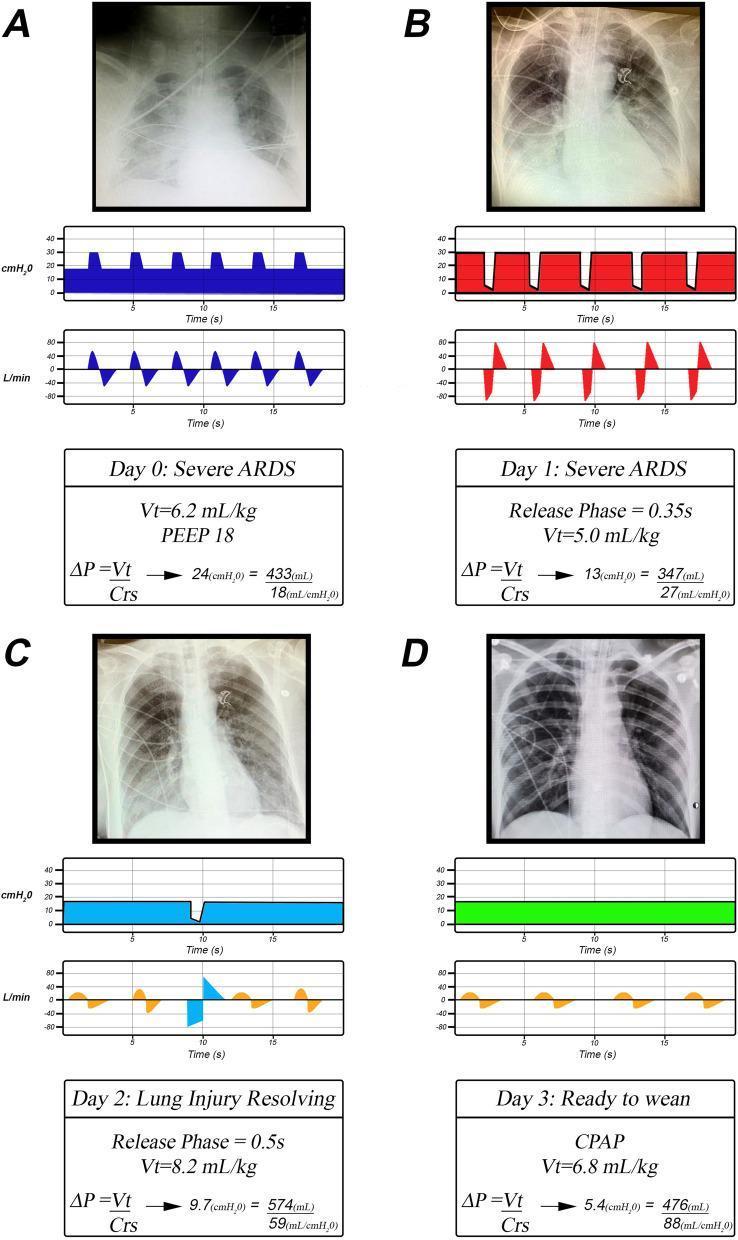
This four-panel comparison chart illustrates the clinical and physiological progression of a patient with Acute Respiratory Distress Syndrome (ARDS) over four days, comparing conventional low tidal volume (VT) ventilation with the Time-Controlled Adaptive Ventilation (TCAV) method for Airway Pressure Release Ventilation (APRV). Each panel (A-D) includes a chest X-ray, ventilator pressure/time and flow/time waveforms, and corresponding respiratory mechanics data. Panel A (Day 0) shows severe ARDS with diffuse bilateral opacities and low respiratory system compliance (Crs = 18 mL/cmH2O). Panel B (Day 1) demonstrates initial lung recruitment following the transition to APRV, characterized by a prolonged inspiratory phase and a brief 0.35s release phase. Panel C (Day 2) shows resolving lung injury with clearing X-ray findings, improved compliance (Crs = 59 mL/cmH2O), and the emergence of spontaneous breathing efforts (gold waves on flow curve). Panel D (Day 3) depicts near-complete resolution with restored lung volume on X-ray and high compliance (Crs = 88 mL/cmH2O), transitioning to continuous positive airway pressure (CPAP) for weaning. The sequence highlights how extending inspiratory time and stabilizing the lung can progressively 'unshrink' the functional lung unit.
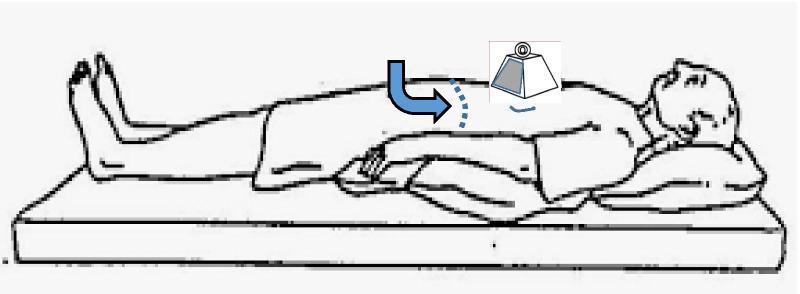
This medical illustration demonstrates maneuvers used for the local modification of chest wall compliance in patients with severe respiratory distress, such as late-phase COVID-19 ARDS. The diagram shows a patient in a supine position on a flat examination surface. Two distinct clinical interventions are illustrated: 1) Sternal weighting, represented by a physical weight placed directly over the sternum to apply downward compressive force; and 2) A 'belly push' maneuver, indicated by a curved blue arrow showing sustained downward and inward pressure applied to the mid-upper abdomen. These external forces aim to modify respiratory system mechanics by reducing end-expiratory lung volumes, potentially shifting the lung's operation to a more compliant portion of the pressure-volume curve. This technique is used to assess or improve tidal compliance and reduce driving pressures during passive volume-targeted ventilation. The educational focus is on pathophysiology and critical care ventilation strategies to avoid end-tidal overdistention in 'baby lungs' associated with severe ARDS.
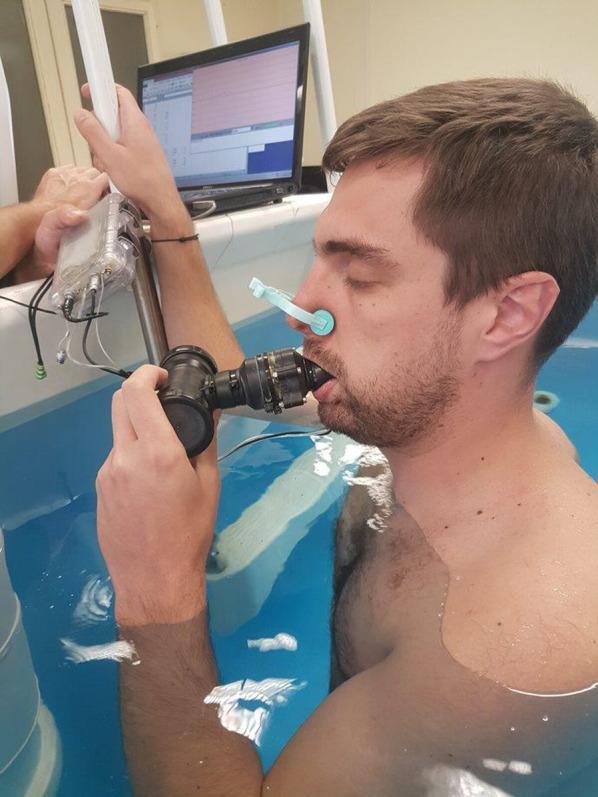
This clinical photograph illustrates a research setup for measuring static respiratory compliance during head-out-of-water immersion. A male subject is shown immersed in water up to the level of the sternal notch, a condition that physiologically alters respiratory mechanics due to hydrostatic pressure on the chest wall. The subject is wearing a nose clip to ensure a closed respiratory system, breathing exclusively through a mouthpiece. The mouthpiece is integrated with a pressure sensor and connected via tubing to a calibrated syringe (partially visible) used to manipulate lung volumes. In the background, a computer monitor displays real-time physiological data and waveforms, likely recording the relationship between pressure and volume changes. This experimental design is used in sports medicine and pulmonary physiology to study the effects of immersion on the respiratory system, specifically evaluating parameters like tidal volume, expiratory reserve volume, and overall respiratory system compliance (Crs).
lung chest wall compliance pressure volume curve static respiratory system
This clinical photograph illustrates a research setup for measuring static respiratory compliance during head-out-of-water immersion. A male subject is shown immersed in water up to the level of the sternal notch, a condition that physiologically alters respiratory mechanics due to hydrostatic pressure on the chest wall. The subject is wearing a nose clip to ensure a closed respiratory system, breathing exclusively through a mouthpiece. The mouthpiece is integrated with a pressure sensor and connected via tubing to a calibrated syringe (partially visible) used to manipulate lung volumes. In the background, a computer monitor displays real-time physiological data and waveforms, likely recording the relationship between pressure and volume changes. This experimental design is used in sports medicine and pulmonary physiology to study the effects of immersion on the respiratory system, specifically evaluating parameters like tidal volume, expiratory reserve volume, and overall respiratory system compliance (Crs).
This medical illustration demonstrates maneuvers used for the local modification of chest wall compliance in patients with severe respiratory distress, such as late-phase COVID-19 ARDS. The diagram shows a patient in a supine position on a flat examination surface. Two distinct clinical interventions are illustrated: 1) Sternal weighting, represented by a physical weight placed directly over the sternum to apply downward compressive force; and 2) A 'belly push' maneuver, indicated by a curved blue arrow showing sustained downward and inward pressure applied to the mid-upper abdomen. These external forces aim to modify respiratory system mechanics by reducing end-expiratory lung volumes, potentially shifting the lung's operation to a more compliant portion of the pressure-volume curve. This technique is used to assess or improve tidal compliance and reduce driving pressures during passive volume-targeted ventilation. The educational focus is on pathophysiology and critical care ventilation strategies to avoid end-tidal overdistention in 'baby lungs' associated with severe ARDS.
This four-panel comparison chart illustrates the clinical and physiological progression of a patient with Acute Respiratory Distress Syndrome (ARDS) over four days, comparing conventional low tidal volume (VT) ventilation with the Time-Controlled Adaptive Ventilation (TCAV) method for Airway Pressure Release Ventilation (APRV). Each panel (A-D) includes a chest X-ray, ventilator pressure/time and flow/time waveforms, and corresponding respiratory mechanics data. Panel A (Day 0) shows severe ARDS with diffuse bilateral opacities and low respiratory system compliance (Crs = 18 mL/cmH2O). Panel B (Day 1) demonstrates initial lung recruitment following the transition to APRV, characterized by a prolonged inspiratory phase and a brief 0.35s release phase. Panel C (Day 2) shows resolving lung injury with clearing X-ray findings, improved compliance (Crs = 59 mL/cmH2O), and the emergence of spontaneous breathing efforts (gold waves on flow curve). Panel D (Day 3) depicts near-complete resolution with restored lung volume on X-ray and high compliance (Crs = 88 mL/cmH2O), transitioning to continuous positive airway pressure (CPAP) for weaning. The sequence highlights how extending inspiratory time and stabilizing the lung can progressively 'unshrink' the functional lung unit.
Compliance of the Respiratory System
1. Definition
C = ΔV / ΔP (units: L/cmH₂O or mL/cmH₂O)
- Costanzo Physiology 7th Edition, p. 204: "The compliance of the lungs and chest wall is inversely correlated with their elastic properties or elastance."
- Miller's Anesthesia, 10e, p. 1262: Normal lung compliance is 0.2 to 0.3 L/cmH₂O.
2. Components of the Respiratory System
- Lung compliance (C_L)
- Chest wall compliance (C_W)
1/C_RS = 1/C_L + 1/C_W or equivalently: Elastance_RS = Elastance_L + Elastance_W
- C_L ≈ 150 mL/cmH₂O
- C_W ≈ 200 mL/cmH₂O
- C_RS = 1/(1/150 + 1/200) ≈ 86 mL/cmH₂O
3. Pressure-Volume (P-V) Curve of the Lung
The Isolated Lung Experiment
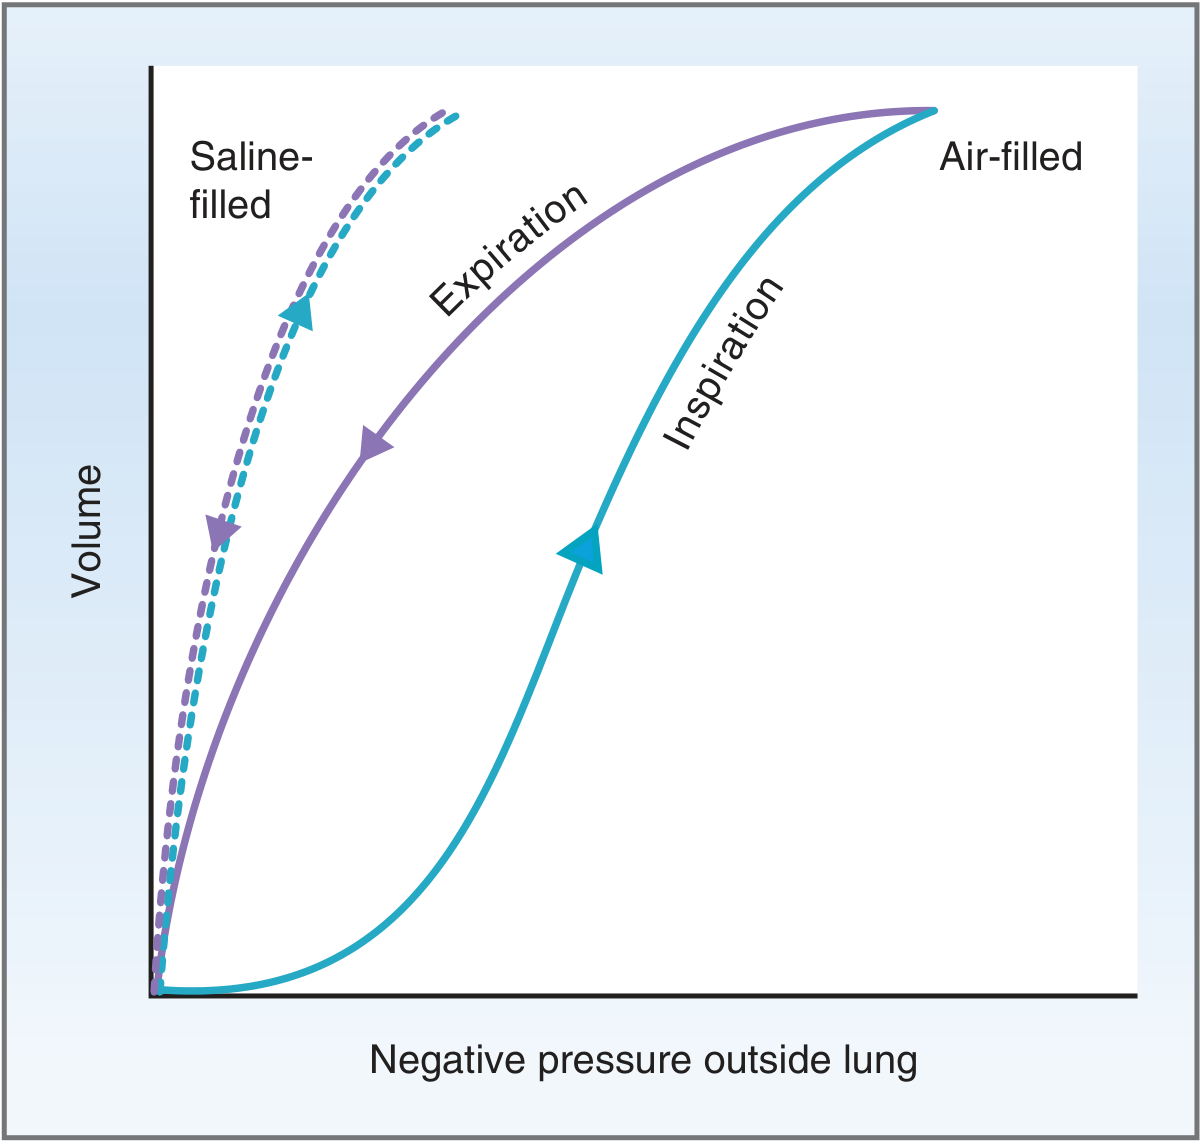
- At low lung volumes: alveoli are stiff (low compliance), the curve is flat
- At intermediate volumes: the curve is steepest - maximum compliance, corresponding to the mid-portion of normal tidal breathing
- At high lung volumes: alveoli are maximally stretched and stiff again, the curve flattens
Hysteresis
- Surface tension at the air-liquid interface in alveoli - different recruitment/derecruitment of alveoli
- Surfactant behavior - surfactant molecules spread during inspiration and condense during expiration, altering surface tension differently on each limb
4. Role of Surfactant in Lung Compliance
- Reduces surface tension: By interposing between water molecules, surfactant lowers the tendency of the alveolar liquid lining to contract (which would otherwise collapse alveoli)
- Increases lung compliance: With lower surface tension, less pressure is needed to inflate the lung
- Dynamic effect: During inspiration (as lung surface area increases), surfactant molecules are spread apart - surface tension rises slightly, opposing over-distension. During expiration (as surface area decreases), surfactant molecules become denser, surface tension falls dramatically, preventing alveolar collapse. This keeps small alveoli open
5. Transpulmonary Pressure and Lung Inflation
P_TP = P_AW - P_PL (airway pressure minus pleural pressure)
- Increasing airway pressure (P_AW) increases P_TP and inflates the lung
- Making pleural pressure more negative also increases P_TP
6. Chest Wall Compliance
-
Chest wall edema
-
Pleural effusions
-
Diseases of costovertebral joints
-
Abdominal distension / compartment syndrome
-
Thoracic deformity
-
Morbid obesity
-
Increased muscle tone
-
Miller's Anesthesia, 10e, p. 1263
7. Static vs. Dynamic Compliance
| Feature | Static Compliance | Dynamic Compliance |
|---|---|---|
| Measured at | Zero airflow (end-inspiration pause) | During tidal breathing with airflow |
| Reflects | Pure elastic properties | Elastic + resistive properties |
| Formula (clinical) | C_RS = ΔV / (P_plateau - PEEP) | C_dyn = ΔV / (PIP - PEEP) |
| Normal value | 50-70 mL/cmH₂O | Slightly lower than static |
8. The Combined Lung-Chest Wall System and FRC
- Lung elastic recoil - tends to collapse the lung inward
- Chest wall elastic recoil - tends to spring outward
- At volumes < FRC: chest wall outward recoil dominates → system tends to expand
- At volumes > FRC: lung inward recoil dominates → system tends to collapse
- At very high volumes (near TLC): both lung AND chest wall recoil inward
9. Clinical Alterations in Compliance
| Condition | Lung Compliance | Mechanism | P-V Curve Change |
|---|---|---|---|
| Emphysema | Increased | Loss of elastic tissue | Steeper, shifted left |
| Pulmonary fibrosis | Decreased | Scarring and collagen deposition | Flatter, shifted right |
| ARDS | Markedly decreased | Diffuse inflammation, edema, surfactant loss | Flatter, C_RS often < 30 mL/cmH₂O |
| Pulmonary edema | Decreased | Fluid fills alveoli and interstitium | Flatter |
| Surfactant deficiency (neonatal) | Decreased | Loss of surface tension reduction | Flatter |
| Pneumothorax | Decreased (affected side) | Loss of negative pleural pressure | Lung collapses |
| Obesity | Decreased C_RS | Reduced chest wall compliance | Flatter |
10. ARDS Example (Clinical Application)
- Day 0 (severe ARDS): C_RS ≈ 18 mL/cmH₂O (stiff lungs, diffuse bilateral infiltrates)
- Day 2 (improving): C_RS ≈ 59 mL/cmH₂O (partial lung recruitment, clearing X-ray)
- Day 3 (near-resolution): C_RS ≈ 88 mL/cmH₂O (restored lung volume, near-normal)
11. Key Formulas Summary
| Formula | Meaning |
|---|---|
| C = ΔV/ΔP | Definition of compliance |
| 1/C_RS = 1/C_L + 1/C_W | Series arrangement of lung + chest wall |
| C_RS (static) = VT / (P_plateau - PEEP) | Bedside static compliance in ventilated patients |
| P_TP = P_AW - P_PL | Transpulmonary (distending) pressure |
i told you from now whatever topic i will give you guide me in accordance of usmle step 1 uworld nbme their trap points and go to home points, start from zero as if dont know anything
lung compliance pressure volume curve hysteresis surfactant emphysema fibrosis
This composite educational graphic details lung mechanical ventilation reliability and tissue strain analysis using digital volume correlation (DVC). The left panel displays a Pressure-Volume (P-V) curve plot, showing the relationship between Pressure (cmH2O, x-axis from -5 to 35) and Volume (ml, y-axis from 0 to 5). Four ventilation cycles are overlaid as dashed lines, demonstrating sigmoidal hysteretic loops characteristic of respiratory compliance. A solid grey line indicates a consistent compliance range of 0.076–0.077. The right panel consists of two vertically stacked DVC strain field images of lung tissue within an intact thorax, labeled with a 200 µm scale bar. The top image shows the unfiltered strain field, while the bottom image shows the same field after Paganin filtering. The filtered version displays improved contrast between tissue and air by reducing noise within tissue boundaries. Both images include a grayscale color bar indicating 'Maximum Normal Strain (%)' ranging from 0 to 5. This figure illustrates the application of biomedical engineering principles to visualize local lung tissue deformation and characterize pulmonary mechanics during mechanical loading.
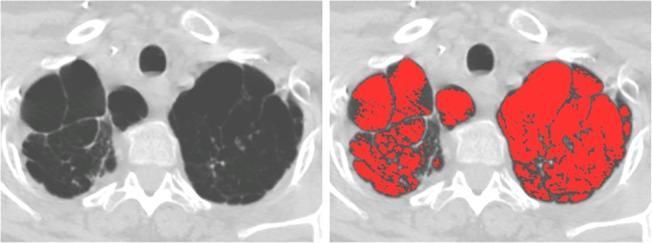
This diagnostic image consists of two panels showing axial chest CT scans of a patient with cystic fibrosis (CF) undergoing lung transplant evaluation. Panel A (left) displays the raw CT data at the level of the lung apices, showing extensive, bilateral bullous emphysema. The parenchyma is replaced by large, thin-walled, air-filled cystic spaces (bullae), with the left lung demonstrating more severe confluent destruction compared to the right. Panel B (right) shows the same image with automated densitometry quantification applied. Areas with Hounsfield Unit (HU) values below -950 (indicative of severe emphysema/air trapping) are highlighted with a red mask. This computer-aided quantification (IN-950) measured the emphysematous volume at 17.9%, correlating with a moderate histopathological score. The image illustrates the use of quantitative CT imaging in assessing obstructive lung disease and surgical candidacy in advanced pulmonary pathology.
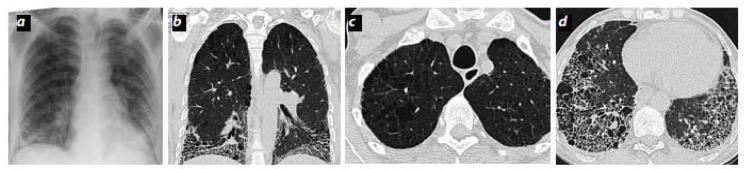
This composite figure illustrates the radiological findings of Combined Pulmonary Fibrosis and Emphysema (CPFE). (a) Posterior-anterior chest radiograph demonstrates bilateral basal reticular opacities and an enlarged interlobar artery, suggestive of pulmonary hypertension. (b-d) High-resolution computed tomography (HRCT) in coronal (b) and axial (c, d) planes reveals a distinct cranio-caudal distribution of pathology. The upper lobes (c) show centrilobular emphysema characterized by multiple areas of low attenuation without perceptible walls. The lower lobes (d) exhibit features of advanced interstitial fibrosis, including subpleural honeycombing, traction bronchiectasis, and significant volume loss. This combination of upper-lobe emphysema and lower-lobe fibrosis is the hallmark of CPFE, frequently seen in smokers and often associated with severe impairment of gas exchange (reduced DLCO) despite relatively preserved lung volumes (FVC and FEV1).
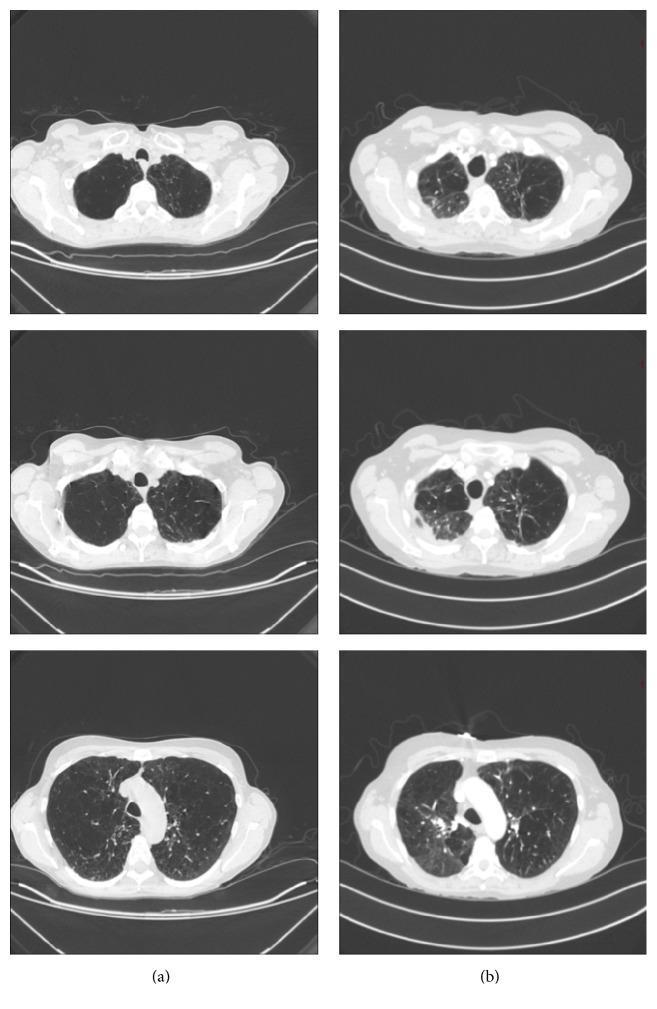
This Comparison Chart displays axial Computed Tomography (CT) scans of the chest across three different anatomical levels, comparing a baseline state (a) with a follow-up state (b). The baseline images (a) demonstrate bilateral, diffuse emphysema characterized by extensive areas of low attenuation and lung hyperinflation. In contrast, the follow-up images (b) show significant morphological changes, most notably prominent apical scarring and fibrotic changes predominantly localized to the right lung. There is visible right apical pleural thickening and a noticeable reduction in overall lung volume compared to the baseline, which previously showed flattened diaphragms and hyperexpansion. These diagnostic images illustrate the evolution from generalized obstructive lung disease to localized post-inflammatory or post-infectious fibrosis, highlighting changes in lung parenchyma and pleural space. This material is suitable for advanced medical education in pulmonology and radiology, focusing on the visual identification of emphysema versus fibrotic scarring and the assessment of lung volume changes on serial imaging.
🫁 COMPLIANCE OF THE RESPIRATORY SYSTEM
USMLE Step 1 | UWorld | NBME - Complete Zero-to-Master Guide
🧱 STEP 1: BUILD THE FOUNDATION - "What Even IS Compliance?"
- The balloon stretches easily with little force → High compliance
- The paper bag barely expands and tears → Low compliance
| Term | Meaning | Memory trick |
|---|---|---|
| High compliance | Stretches easily, little pressure needed | Emphysema (floppy lung) |
| Low compliance | Stiff, needs more pressure | Fibrosis, ARDS (stiff lung) |
| Elastance | Reciprocal of compliance (= 1/C) | Tendency to RECOIL back |
Compliance = 1/Elastance. When compliance goes up, elastance goes down - and vice versa. USMLE loves asking this inverse relationship.
🧱 STEP 2: THE TWO COMPONENTS - Lung + Chest Wall
Total Respiratory System = Lung + Chest Wall (arranged in SERIES)
1/C_RS = 1/C_L + 1/C_W
- Lung compliance (C_L) = ~200 mL/cmH₂O (isolated)
- Chest wall compliance (C_W) = ~200 mL/cmH₂O
- Total C_RS ≈ 100 mL/cmH₂O (physiologically measured: ~50-70 mL/cmH₂O)
🔴 TRAP POINT #1
UWorld loves asking: "A patient has morbid obesity - why is compliance reduced?" The lung itself is fine, but the heavy abdominal/thoracic wall reduces chest wall compliance, which reduces total C_RS. The trap is blaming the lung when the chest wall is the culprit.
🧱 STEP 3: THE PRESSURE-VOLUME (P-V) CURVE - The Most Tested Diagram
What the curve tells you:
- X-axis = Distending pressure (transpulmonary pressure)
- Y-axis = Lung volume
- Slope of the curve = Compliance (steeper = more compliant)
3 key zones of the curve:
- Low volumes (bottom - flat): Alveoli are collapsed and stiff. Low compliance. You need a lot of pressure to get started. ← This is where premature babies struggle without surfactant
- Middle volumes (steep - optimal): Normal tidal breathing happens here. Best compliance. Least work of breathing.
- High volumes (top - flat again): Alveoli over-distended and stiff again. Low compliance. ← This is where barotrauma happens on a ventilator
"Go to Home Point": Normal tidal breathing lives in the MIDDLE of the S-curve where compliance is highest and work of breathing is lowest.
🧱 STEP 4: HYSTERESIS - "Why Are the Two Limbs Different?"
Key fact about hysteresis:
- For the same pressure, lung volume is GREATER on expiration than on inspiration
- Therefore: Expiratory compliance > Inspiratory compliance
WHY does hysteresis happen? (2 reasons - both tested)
| Reason | Mechanism |
|---|---|
| Surface tension at air-liquid interface | During inspiration, you must break up water molecule cohesion = extra pressure needed. During expiration, surface tension is already overcome. |
| Surfactant behavior | During inspiration, surfactant density is initially LOW (area expands faster than surfactant is added) → high surface tension → stiff lung. On expiration, surfactant condenses rapidly → surface tension falls → lung more compliant. |
The saline-filled lung experiment (classic exam question):
- Fill an isolated lung with saline instead of air
- Result: No hysteresis - the two limbs become identical
- Why? Saline eliminates the air-liquid interface, proving surface tension is the cause of hysteresis
🔴 TRAP POINT #2
"Why does the saline-filled lung show HIGHER compliance at any given pressure than the air-filled lung?" Because with saline, there is NO surface tension at all - only the lung's tissue elasticity remains. Surface tension contributes to STIFFNESS, so removing it makes the lung much more compliant.
🧱 STEP 5: SURFACTANT - The Compliance Booster
| Feature | Detail |
|---|---|
| Produced by | Type II pneumocytes (alveolar cells) |
| Chemical nature | Dipalmitoylphosphatidylcholine (DPPC) - a phospholipid |
| Function | Reduces surface tension at the air-liquid interface |
| Net effect | Increases lung compliance, prevents alveolar collapse |
| Law governing alveoli | Law of Laplace: P = 2T/r |
Law of Laplace - The most tested equation in this topic:
P = 2T / r P = pressure inside the sphere, T = surface tension, r = radius
- Smaller radius → HIGHER collapsing pressure
- Without surfactant, small alveoli have MORE collapsing pressure than large ones → small alveoli empty into large ones → alveolar instability
- As radius decreases (during expiration), surfactant molecules pack more densely → T drops → P stays manageable → small alveolus does not collapse
🔴 TRAP POINT #3 - Classic NBME/UWorld trick:
"A premature infant (28 weeks) is born with respiratory distress, grunting, nasal flaring, and intercostal retractions. CXR shows ground-glass opacities. Why does breathing require so much effort?" Answer: No surfactant → HIGH surface tension → alveoli collapse at end-expiration → every breath must re-recruit collapsed alveoli from a flat portion of the P-V curve → massively increased work of breathing (very low compliance). Treatment: Exogenous surfactant + CPAP or mechanical ventilation
🧱 STEP 6: THE FRC DIAGRAM - Lung vs. Chest Wall Forces
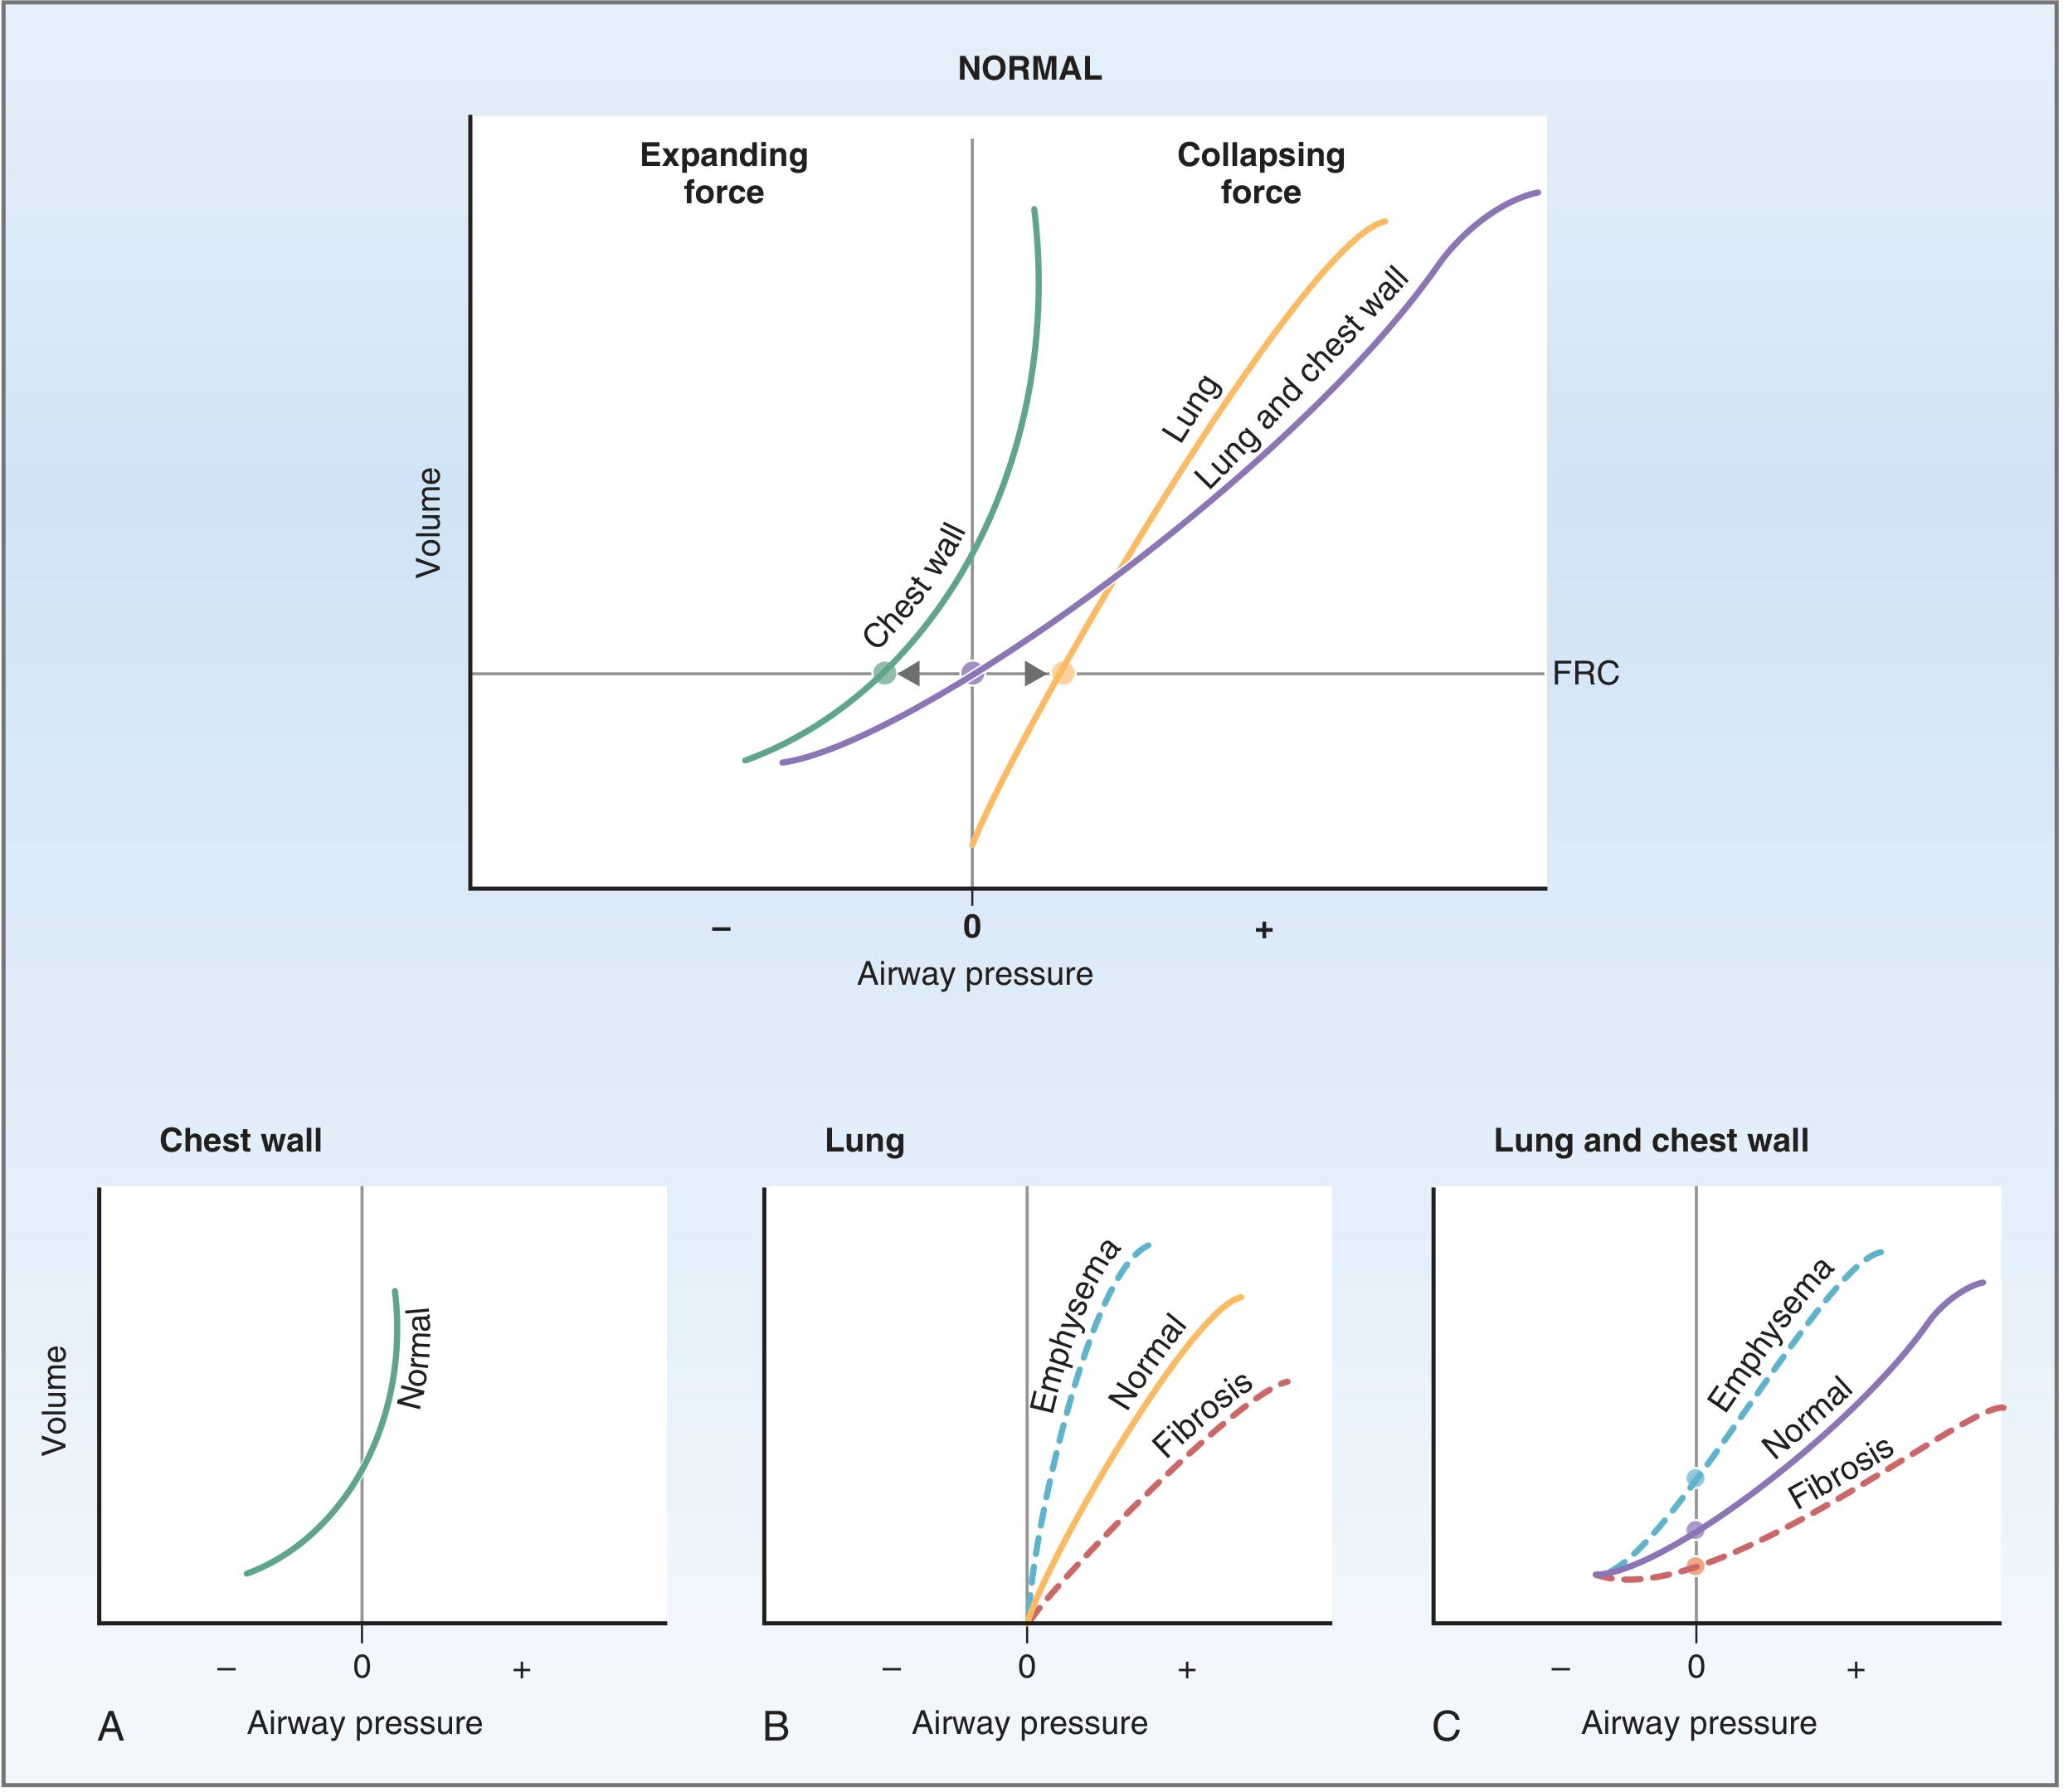
The fundamental concept:
| Structure | Tendency | Direction |
|---|---|---|
| Lung | Wants to collapse (elastic recoil inward) | ← inward |
| Chest wall | Wants to spring out (elastic recoil outward) | → outward |
FRC = the equilibrium point where lung recoil inward = chest wall recoil outward = zero net airway pressure
Pneumothorax connection (tested constantly):
- Air enters pleural space → Intrapleural pressure → 0 (atmospheric)
- Lung collapses (no negative pressure to hold it open)
- Chest wall springs outward (no negative pressure to hold it back)
- Classic exam: patient with pleuritic chest pain, absent breath sounds, tracheal deviation → tension pneumothorax
🧱 STEP 7: DISEASES - How Compliance Changes FRC (THE BIG TABLE)
| Disease | Lung Compliance | Mechanism | FRC | Chest Appearance |
|---|---|---|---|---|
| Emphysema | ↑ INCREASED | Loss of elastin fibers | ↑ INCREASED | Barrel chest, hyperinflation |
| Pulmonary fibrosis | ↓ DECREASED | Collagen deposition, scarring | ↓ DECREASED | Small, shrunken lungs |
| ARDS | ↓ DECREASED | Inflammatory edema, surfactant loss | ↓ DECREASED | Diffuse bilateral infiltrates |
| Pulmonary edema | ↓ DECREASED | Fluid in alveoli/interstitium | ↓ DECREASED | Vascular redistribution, effusions |
| Neonatal RDS | ↓ DECREASED | Surfactant deficiency | ↓ DECREASED | Ground-glass, reticular pattern |
| Obesity | ↓ C_RS (not C_L) | Reduced chest wall compliance | ↓ DECREASED | - |
🔴 TRAP POINT #4 - Emphysema vs. Fibrosis on PFTs:
| Emphysema | Fibrosis | |
|---|---|---|
| FEV1/FVC | ↓ (obstructive) | Normal or ↑ (restrictive) |
| TLC | ↑ | ↓ |
| FRC | ↑ | ↓ |
| RV | ↑ | ↓ |
| Lung compliance | ↑ | ↓ |
| DLCO | ↓ (destroyed alveoli) | ↓ (thickened membrane) |
The trap: "Emphysema has INCREASED compliance but DECREASED DLCO." Students confuse "more compliant" with "better functioning." The lung is floppy and over-distended but has lost alveolar surface area for gas exchange.
🧱 STEP 8: STATIC vs. DYNAMIC COMPLIANCE - Ventilator Questions
Measuring Static Compliance in a Ventilated Patient:
- Patient on volume-controlled ventilation (set tidal volume)
- Press end-inspiratory hold → airflow = 0
- Read the plateau pressure (P_plat)
C_static = Tidal Volume / (P_plateau - PEEP)
- ARDS: < 30 mL/cmH₂O
- < 20-25 mL/cmH₂O → very difficult to wean from ventilator
Dynamic compliance:
C_dynamic = Tidal Volume / (PIP - PEEP) (PIP = Peak Inspiratory Pressure)
| Static Compliance | Dynamic Compliance | |
|---|---|---|
| Reflects | Pure elasticity of lung+chest wall | Elasticity + Airway resistance |
| Measured at | Zero airflow (plateau) | During active airflow |
| Reduced by | Stiff lung (ARDS, fibrosis) | Stiff lung PLUS airway obstruction |
🔴 TRAP POINT #5 - High-yield ventilator question:
"A ventilated patient has HIGH peak pressure but NORMAL plateau pressure. What is the problem?" Answer: Airway resistance is increased (bronchospasm, mucus plug, kinked ETT), NOT lung stiffness. Static compliance is normal - the problem is dynamic only."A ventilated patient has BOTH high peak AND high plateau pressure. What is the problem?" Answer: Decreased static compliance = stiff lungs (ARDS, pneumothorax, tension, right mainstem intubation).
🧱 STEP 9: STATIC COMPLIANCE FORMULA - CLINICAL MEASUREMENT
C_RS = ΔV (exhaled tidal volume) / ΔP (P_plateau - PEEP)
🎯 GO-TO HOME POINTS (what USMLE always comes back to)
- Compliance = ΔV/ΔP = 1/Elastance - never forget the inverse relationship
- 1/C_RS = 1/C_L + 1/C_W - series arrangement means total compliance is always less than either component alone
- FRC = equilibrium point where lung recoil inward = chest wall recoil outward
- Emphysema → ↑ compliance → ↑ FRC → barrel chest
- Fibrosis → ↓ compliance → ↓ FRC → small shrunken lung
- Surfactant deficiency → ↑ surface tension → ↓ compliance → alveolar collapse
- Hysteresis is caused by surface tension (saline-filled = no hysteresis)
- Law of Laplace P = 2T/r: small alveoli collapse MORE without surfactant
- Plateau pressure = static compliance measurement; Peak pressure = dynamic
- High peak, normal plateau = airway problem; Both high = lung/chest wall stiffness
🚨 CLASSIC USMLE QUESTION STEMS TO RECOGNIZE
| Stem clue | What they're testing |
|---|---|
| "28-week premature infant, ground-glass CXR, retractions" | Surfactant deficiency, ↓ compliance, neonatal RDS |
| "COPD patient with barrel chest, hyperinflation on CXR" | ↑ lung compliance, ↑ FRC |
| "Pulmonary fibrosis, small lung volumes on PFT" | ↓ lung compliance, ↓ FRC, restrictive |
| "Morbidly obese patient, low CRS but normal lung sounds" | ↓ chest wall compliance, not lung |
| "Saline-filled vs air-filled lung, which is more compliant?" | Saline - no surface tension |
| "High PIP, normal P-plateau on ventilator" | Airway resistance problem |
| "Both PIP and P-plateau elevated in ARDS patient" | ↓ static compliance |
| "Pneumothorax: what happens to lung and chest wall?" | Lung collapses, chest wall springs out |
| "At what lung volume is compliance highest?" | Mid-range (middle of the S-curve) = normal FRC range |
Coming next: Just drop any topic and I'll break it down the same way - built from zero, USMLE-wired, trap points flagged, go-to home points locked.