
Encephalography
Reading File
Encephalography broadly refers to techniques that record electrical or other physiological activity of the brain. The most common form is electroencephalography (EEG), which records electrical potentials from the scalp. There are also related forms like magnetoencephalography (MEG).
Searching sources...
Finding Sources
Searching the Web
electroencephalography EEG overview principles clinical uses 2024
Reading File
Reading File
Loading Image
Here is a thorough overview of Electroencephalography (EEG) drawn from Adams and Victor's Principles of Neurology, 12th Edition.
Electroencephalography (EEG)
What It Is
EEG records the spontaneous electrical activity generated in the cerebral cortex. The recorded signals reflect electrical currents flowing in the extracellular spaces of the brain - specifically the summated effects of innumerable excitatory and inhibitory synaptic potentials on cortical neurons. This cortical activity is highly influenced and synchronized by subcortical structures, particularly the thalamus and the high brainstem reticular formation, which entrain cortical neurons into characteristic rhythmic patterns (e.g., alpha rhythm, sleep spindles).
The electroencephalograph was developed by Hans Berger in 1929.
Technical Basis
- Electrodes: Silver or silver-silver chloride discs (~0.5 cm diameter) placed on the scalp using a conductive medium
- Amplifiers: 8 to 32 or more channels, recording simultaneously from many scalp areas
- Frequency range: 0.5 to 30 Hz (cycles per second)
- Display speed: 3 cm/s standard; now stored digitally
- Electrode placement: The International 10-20 system - 10 electrodes on each side of the cranium, using scalp landmarks (nasion, inion, preauricular points) to standardize placement at 10% and 20% intervals
Each channel records the difference in electrical potential between two electrodes. A positive voltage deflects downward, a negative voltage upward (by convention). Channels are arranged into montages for comparing activity across brain regions and between hemispheres.
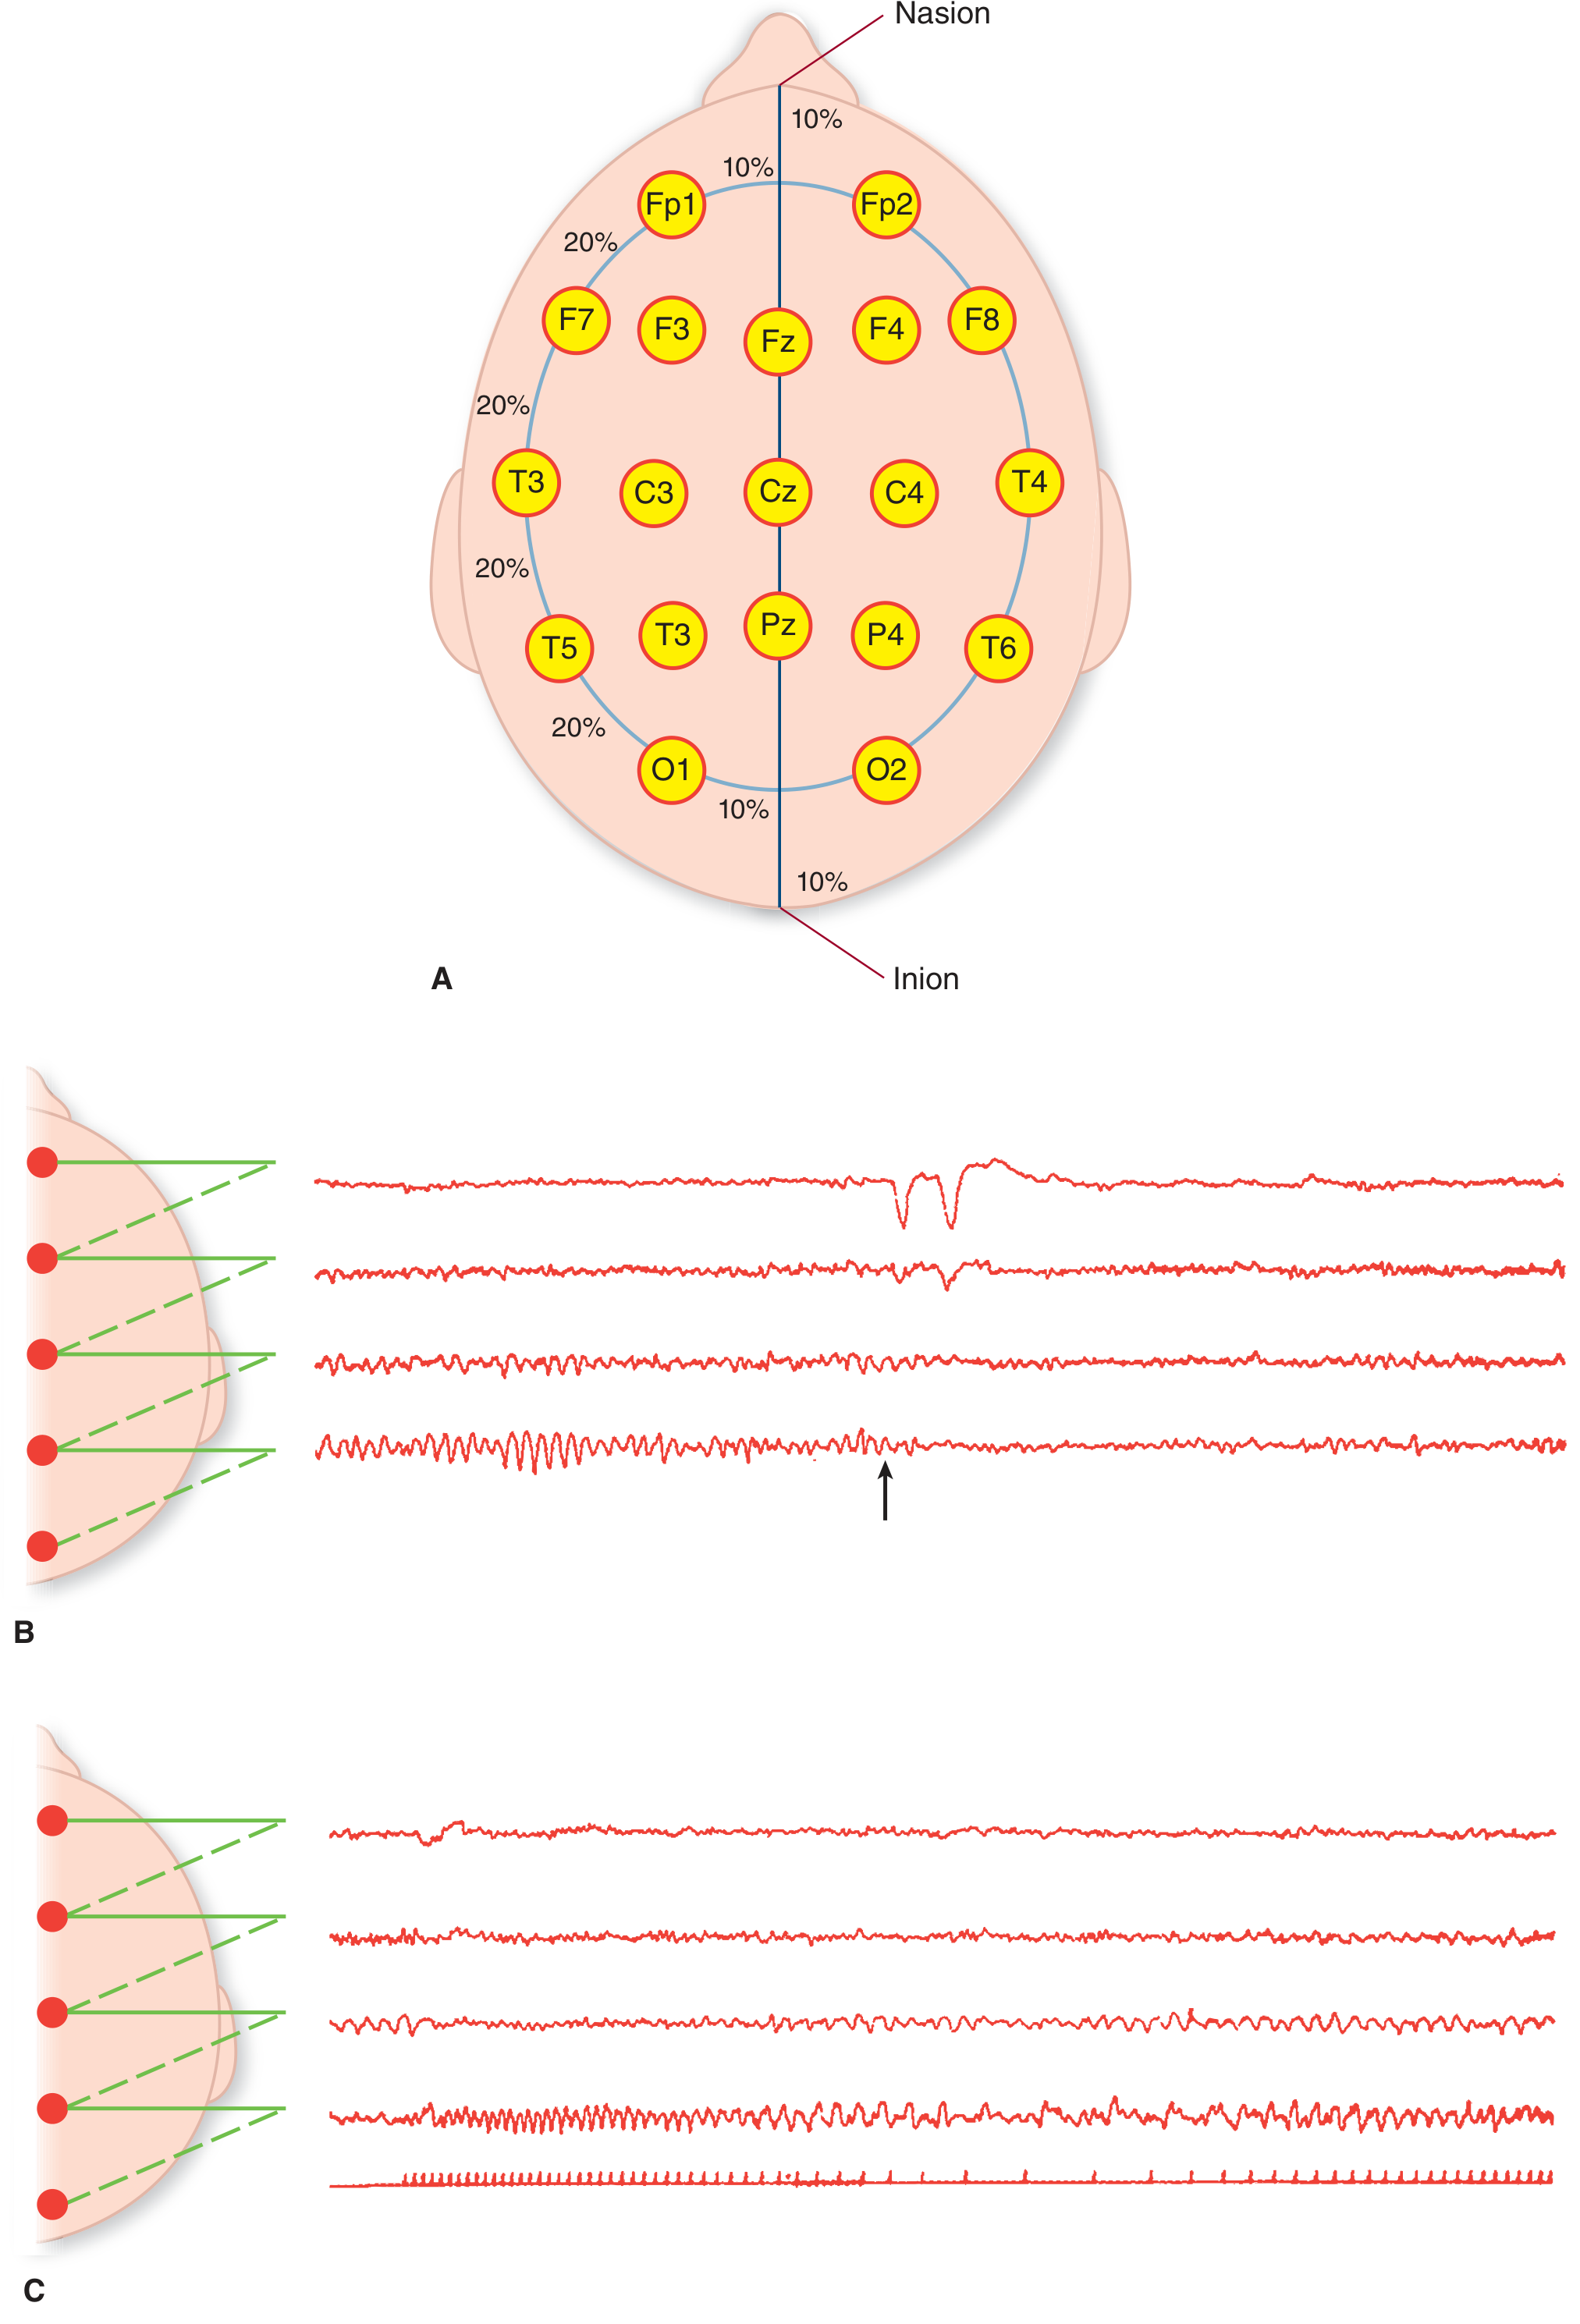
Figure: (A) International 10-20 electrode placement system. (B) Normal EEG showing alpha activity posteriorly and eye blink artifact. (C) EEG showing faster frontal beta activity.
Normal EEG Patterns
| Wave Type | Frequency | Amplitude | Location | Significance |
|---|---|---|---|---|
| Alpha | 8-12 Hz | ~50 mV | Occipital / posterior parietal | Normal adult waking (eyes closed); suppressed by eye opening or mental activity |
| Beta | >12 Hz | 10-20 mV | Frontal | Normal; increased by benzodiazepines/sedatives |
| Theta | 4-7 Hz | - | Temporal | Small amounts normal in adults; more in >60 yrs |
| Delta | 1-3 Hz | - | - | Not present in normal waking adults |
- In sleep, the alpha rhythm slows symmetrically and vertex sharp waves and sleep spindles appear
- In infants, the dominant rhythm is ~3 Hz; an adult-like alpha rhythm appears by age 6 and adult frequency is reached by age 10-12
Activating Procedures
To bring out abnormal patterns, several provocations are used:
- Hyperventilation - 20 breaths/min for 3 minutes (lowers CO₂, causes cerebral vasoconstriction and can precipitate seizure activity)
- Photic stimulation - strobe light; a normal photic driving response means visual pathways are intact; spread with sharp/paroxysmal waves indicates abnormal cortical excitability
- Sleep deprivation - used before the recording session to increase the yield of seizure activity
Abnormal EEG Patterns
Slow waves:
- Delta waves (<4 Hz, 50-350 mV) and theta waves (4-7 Hz) indicate pathological slowing
- Localized slow waves suggest a structural lesion (infarct, tumor, trauma)
- Generalized slowing suggests diffuse encephalopathy (metabolic, toxic)
Epileptiform patterns:
- Spikes: pointed transient waveforms, duration 20-70 ms
- Sharp waves: similar but duration 70-200 ms
- Spike-and-wave complexes: hallmark of generalized epilepsies (e.g., 3 Hz spike-and-wave in absence epilepsy)
Suppression patterns:
- Localized absence of activity over areas of infarction, necrosis, or large clots
- Burst suppression or electrocerebral silence: seen in severe anoxic injury or brain death
Clinical Uses
| Indication | How EEG Helps |
|---|---|
| Epilepsy | Diagnose, classify seizure type, localize seizure focus |
| Non-convulsive status epilepticus | Detect subclinical seizures in ICU patients |
| Brain death | Electrocerebral silence (isoelectric EEG) supports diagnosis |
| Sleep disorders | Polysomnography uses EEG to stage sleep |
| Encephalopathy | Evaluate metabolic/toxic causes; generalized slowing |
| Creutzfeldt-Jakob disease | Periodic sharp wave complexes are a characteristic finding |
| Intraoperative monitoring | Monitor cerebral activity in anesthetized patients |
Limitations
- EEG has been largely supplanted by CT and MRI for localizing structural lesions, as imaging offers far greater anatomical resolution
- It represents only a brief snapshot of brain activity
- Interpretation requires significant expertise, especially in children where normal patterns vary widely with age
- Surface EEG may miss deep or small seizure foci
Source: Adams and Victor's Principles of Neurology, 12th Edition, Chapter 2 (Special Diagnostic Methods)
A 2-minute visual summary of EEG principles and applications:
This is a shared conversation. Sign in to Orris to start your own chat.