Acute Coronary Syndrome (ACS) – likely NSTEMI / Unstable Angina
Reading File
Finding Sources
Finding Sources
Reading File
Reading File
Reading File
Reading File
Reading File
Reading File
Reading File
Reading File
Reading File
Reading File
Reading File
Now I have comprehensive material. Let me compile a thorough clinical reference on ACS/NSTEMI/Unstable Angina.
Acute Coronary Syndrome (ACS): NSTEMI / Unstable Angina
Sources: Goldman-Cecil Medicine, Tintinalli's Emergency Medicine, The Washington Manual of Medical Therapeutics
Definition & Classification
Acute coronary syndrome describes the continuum of myocardial ischemia or infarction in the absence of persistent ST elevation:
| Syndrome | Troponin | ECG | Key Distinguisher |
|---|---|---|---|
| Unstable Angina (UA) | Negative | No persistent STE | Ischemia without necrosis |
| NSTEMI | Positive (elevated) | No persistent STE | Biochemical necrosis confirmed |
| STEMI | Positive | Persistent STE >20 min | Different pathway/urgency |
UA is defined as chest pain that is:
- New in onset, or
- Worsening (more severe, prolonged, or frequent than prior episodes), or
- Occurring at rest — without serologic evidence of myocyte necrosis.
NSTEMI differs from UA only by the presence of elevated cardiac troponin, confirming myonecrosis.
Epidemiology
- ~1.2 million US hospitalizations/year for ACS; ~2/3 are NSTE-ACS
- More than half of NSTE-ACS patients are >65 years; nearly half are women
- Higher prevalence in patients with atherosclerosis risk factors, peripheral vascular disease, or chronic inflammatory conditions (rheumatoid arthritis, psoriasis, SLE)
Pathobiology
The precipitating event in the vast majority is atherosclerotic plaque rupture or erosion → platelet aggregation → thrombus → subtotal coronary occlusion (Type 1 MI).
Plaque vulnerability is driven by:
- Macrophage/T-lymphocyte accumulation at the plaque border
- Cytokines (TNF, IL-1, IFN-γ) → impaired collagen synthesis
- Matrix metalloproteinases & cathepsins → fibrous cap degradation
- Low shear stress zones (bifurcations) → reduced nitric oxide, lipid accumulation
Type 2 MI (supply-demand mismatch) occurs with:
- Severe hypotension, anemia, hypoxemia (↓ supply)
- Tachycardia, severe hypertension, thyrotoxicosis (↑ demand)
- Vasospasm (Prinzmetal angina), cocaine, triptans
- Spontaneous coronary artery dissection (SCAD) — especially peripartum women
Coronary Anatomy on Angiography (NSTE-ACS)
| Finding | Frequency |
|---|---|
| Left main disease | ~15% |
| Three-vessel disease | 30–35% |
| Two-vessel disease | 20–30% |
| Single-vessel disease | 20–30% |
| No significant stenosis | ~15% |
The culprit lesion is often eccentric with scalloped/overhanging edges, reflecting plaque disruption. Notably, two-thirds of culprit lesions previously had <50% stenosis — below the threshold for elective revascularization.
Diagnosis & Risk Stratification
Troponin Algorithm (High-Sensitivity, hs-cTn)
The ESC 0h/1h rule-out and rule-in algorithm:
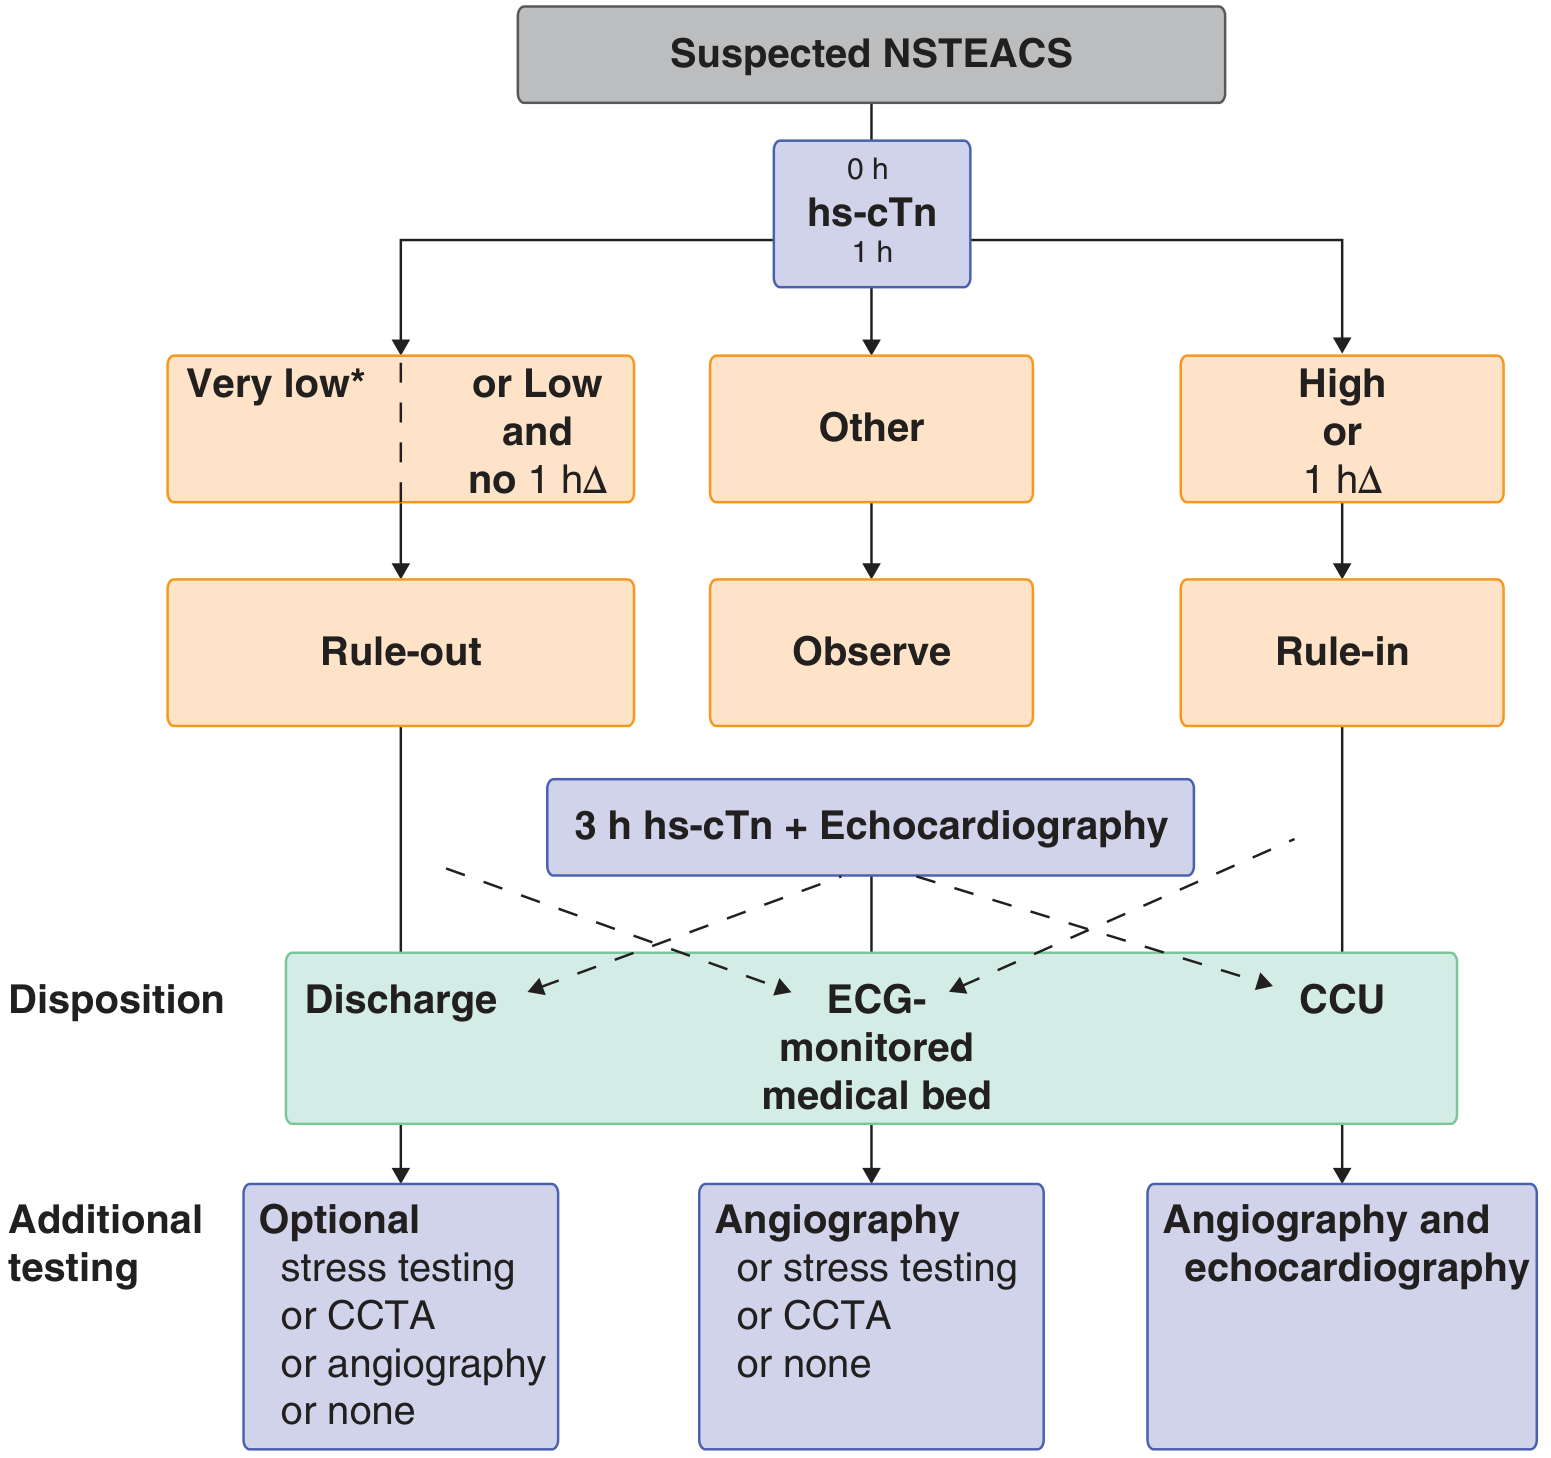
- Rule-out at 0h: hs-cTn very low → NSTEMI excluded
- Rule-out at 1h: low baseline + no rise (1hΔ) → NSTEMI excluded (only valid if chest pain onset >3h)
- Rule-in: moderately/markedly elevated at 0h, OR clear rise within 1h
Elevated troponin alone does not confirm ACS — it also rises in pulmonary embolism, decompensated heart failure, severe hypertension, tachycardia, anemia, and sepsis. Clinical context is essential.
Risk Scores
- TIMI score (0–7 points)
- GRACE score — preferred for mortality prediction; guides invasive vs. conservative strategy
Management Strategy
Risk-Based Approach
| Patient Risk | Strategy |
|---|---|
| Low-risk | Antianginal therapy ± antiplatelet; anticoagulant may be deferred; routine cath not beneficial |
| High-risk | Full antiplatelet + anticoagulant + antianginal + statin → early coronary angiography + revascularization |
Timing of Invasive Strategy
| Indication | Timing |
|---|---|
| Hemodynamic instability | Within 2 hours |
| High-risk features* | Within 24 hours |
| Intermediate/low risk | 24–48 hours or conservative |
High-risk features: recurrent ischemia, elevated troponin, new ST depression, depressed LV function, hemodynamic instability, sustained VT, prior PCI within 6 months, prior CABG.
Pharmacotherapy
1. Antianginal Agents
Nitroglycerin
- Sublingual: 0.3–0.6 mg; can repeat
- IV: start 5–10 µg/min (non-absorbable tubing), titrate in 10 µg/min increments
- Contraindicated within 24–48h of phosphodiesterase-5 inhibitors (sildenafil, tadalafil, vardenafil)
- Adverse effects: headache, hypotension, reflex tachycardia, nitrate tolerance (mitigate with nitrate-free intervals)
β-Adrenergic Blockers
- Reduce symptoms and risk of MI in ACS patients not already on β-blockers
- Metoprolol: 25–50 mg PO q6–8h initially → titrate to 100 mg twice daily
- IV metoprolol for high-risk patients with tachycardia or hypertension
- Avoid in acute decompensated heart failure, high-degree AV block, severe bronchospasm
2. Antiplatelet Therapy
Dual Antiplatelet Therapy (DAPT) is strongly recommended for all NSTEMI/UA without contraindication. Continue for 12 months from the index event regardless of revascularization.
| Agent | Loading Dose | Maintenance | Key Notes |
|---|---|---|---|
| Aspirin (ASA) | 162–325 mg | 75–100 mg daily | First-line; chew initial dose for rapid absorption |
| Clopidogrel | 300–600 mg | 75 mg daily | Prodrug (P2Y12); ↓ cardiovascular death/MI/stroke by 18–30% with ASA; always give 600 mg in naïve patients |
| Ticagrelor | 180 mg | 90 mg BID | Direct P2Y12 inhibitor (non-prodrug); preferred P2Y12 inhibitor due to mortality advantage; maintain ASA ≤100 mg; avoid in bradycardia, severe reactive airways disease, hemorrhagic stroke |
| Prasugrel | 60 mg | 10 mg daily | More potent than clopidogrel; only after coronary anatomy defined and PCI planned; avoid if age >75, weight <60 kg, prior stroke/TIA |
| Cangrelor | 30 µg/kg IV bolus | 4 µg/kg/min infusion | IV only; for PCI patients not on oral P2Y12; rapid onset (<2 min), reverses within 1h; also used as bridge before surgery |
GP IIb/IIIa Inhibitors (eptifibatide, tirofiban, abciximab):
- Block the final common pathway of platelet aggregation
- Benefit limited to PCI patients; do not use routinely before angiography (↑ bleeding, no outcome improvement)
- Consider in: worsening ischemia despite DAPT, complex PCI, or as bridging strategy
CABG timing considerations:
- Withhold clopidogrel ≥5 days before CABG
- Prasugrel ≥7 days
- Ticagrelor ≥5 days
- Cangrelor: 1–6 hours
Proton Pump Inhibitors (PPIs): Add for patients on DAPT with prior GI bleeding, elderly, known ulcers, H. pylori, or co-prescribed NSAIDs/steroids/warfarin.
3. Anticoagulant Therapy
Anticoagulation is indicated in all ACS patients unless contraindicated (e.g., active bleeding).
| Agent | Dose | Notes |
|---|---|---|
| UFH (Unfractionated Heparin) | 60 units/kg bolus (max 4,000 units), then 12 units/kg/h (max 1,000 units/h); target aPTT 1.5–2.5× control | Standard; reversible with protamine |
| Enoxaparin (LMWH) | 1 mg/kg SC q12h | Superior to UFH in high-risk/troponin-positive patients; more predictable; no monitoring needed |
| Fondaparinux | 2.5 mg SC daily | Preferred in patients at increased bleeding risk; indirect Xa inhibitor |
| Bivalirudin | 0.75 mg/kg IV bolus, then 1.75 mg/kg/h | Used peri-PCI; not for initial ACS management |
For ischemia-guided (conservative) strategy: UFH, LMWH, or fondaparinux
For invasive strategy: UFH or LMWH preferred; bivalirudin peri-PCI
4. Additional Agents
- Statins: High-intensity therapy (e.g., atorvastatin 80 mg) initiated early
- ACE inhibitors/ARBs: Especially if reduced EF, hypertension, diabetes, or chronic kidney disease
- Oxygen: Only if SpO₂ <90%
Triple Therapy (DAPT + Oral Anticoagulation)
For patients requiring OAC (e.g., atrial fibrillation) after PCI:
- Average bleeding/ischemic risk: Triple therapy (ASA + clopidogrel + warfarin) × 4 weeks → then SAPT + OAC for ≥1 year
- AUGUSTUS trial: Apixaban + P2Y12 (without ASA) → fewer bleeds and hospitalizations vs. warfarin/ASA-containing regimens, without significant increase in ischemic events
- High bleeding or high ischemic risk: individualize with cardiology consultation
Key Drugs Summary Table (Emergency Treatment)
| Category | Drug | Dose |
|---|---|---|
| Antiplatelet | Aspirin | 162–325 mg PO |
| Clopidogrel | 300–600 mg loading → 75 mg/d | |
| Prasugrel | 60 mg loading → 10 mg/d (post-PCI only) | |
| Ticagrelor | 180 mg loading → 90 mg BID | |
| Antithrombin | UFH | 60 units/kg bolus → 12 units/kg/h |
| Enoxaparin | 1 mg/kg SC q12h | |
| Fondaparinux | 2.5 mg SC daily | |
| Direct Thrombin Inhibitor | Bivalirudin | 0.75 mg/kg bolus → 1.75 mg/kg/h (peri-PCI) |
| GP IIb/IIIa | Eptifibatide | 180 µg/kg bolus → 2 µg/kg/min × 72–96h |
| Tirofiban | 0.4 µg/kg/min × 30 min → 0.1 µg/kg/min × 48–96h | |
| Antianginal | Nitroglycerin | 0.3–0.6 mg SL; IV 5–10 µg/min, titrate |
| Metoprolol | 25–50 mg PO q6–8h (or IV in high-risk) |
— Goldman-Cecil Medicine, 26th ed. (Ch. 57) | Tintinalli's Emergency Medicine, 9th ed. (Ch. 49) | The Washington Manual of Medical Therapeutics (Ch. 4)
Ecg interpretation
Reading File
Finding Sources
Finding Sources
Reading File
Reading File
Finding Sources
Reading File
Reading File
Reading File
Reading File
Reading File
Reading File
Reading File
Loading Image
Loading Image
Loading Image
Now I have all the key content and diagrams. Here is the comprehensive ECG interpretation reference:
ECG Interpretation
Source: Harrison's Principles of Internal Medicine, 22nd ed. (Ch. 247 — Ary L. Goldberger) | Medical Physiology (Boron & Boulpaep)
The Cardiac Conduction System
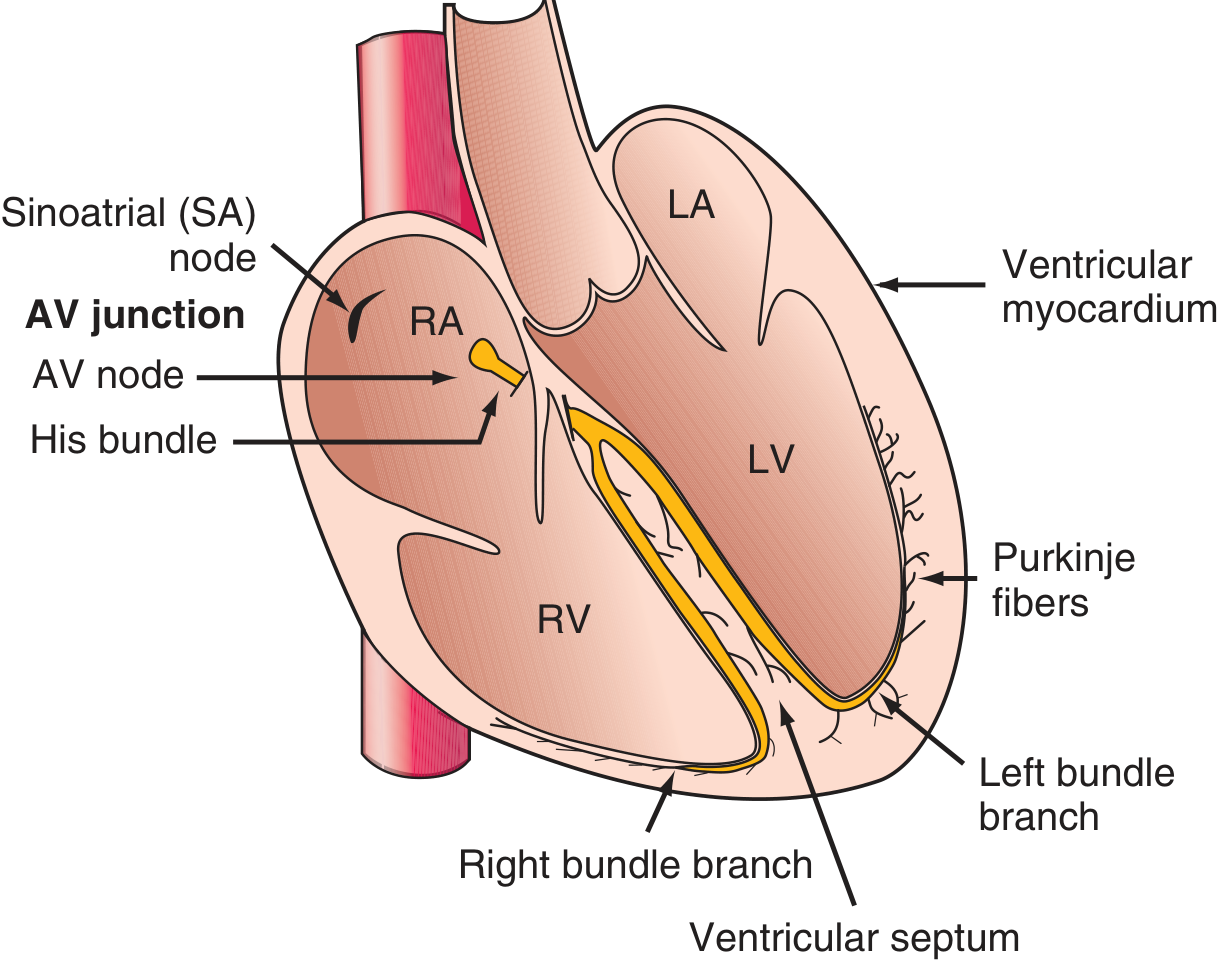
The normal impulse originates in the SA node → spreads through the atria → delayed at the AV node/His bundle (AV junction) → bifurcates into right and left bundle branches → Purkinje fibers → ventricular myocardium (endocardium to epicardium).
ECG Paper Basics
| Parameter | Value |
|---|---|
| Horizontal (time) | 1 small box = 1 mm = 40 ms (0.04 s) |
| Horizontal (time) | 1 large box = 5 mm = 200 ms (0.20 s) |
| Vertical (voltage) | 1 mm = 0.1 mV (standard: 1 mV = 10 mm) |
| Standard paper speed | 25 mm/s |
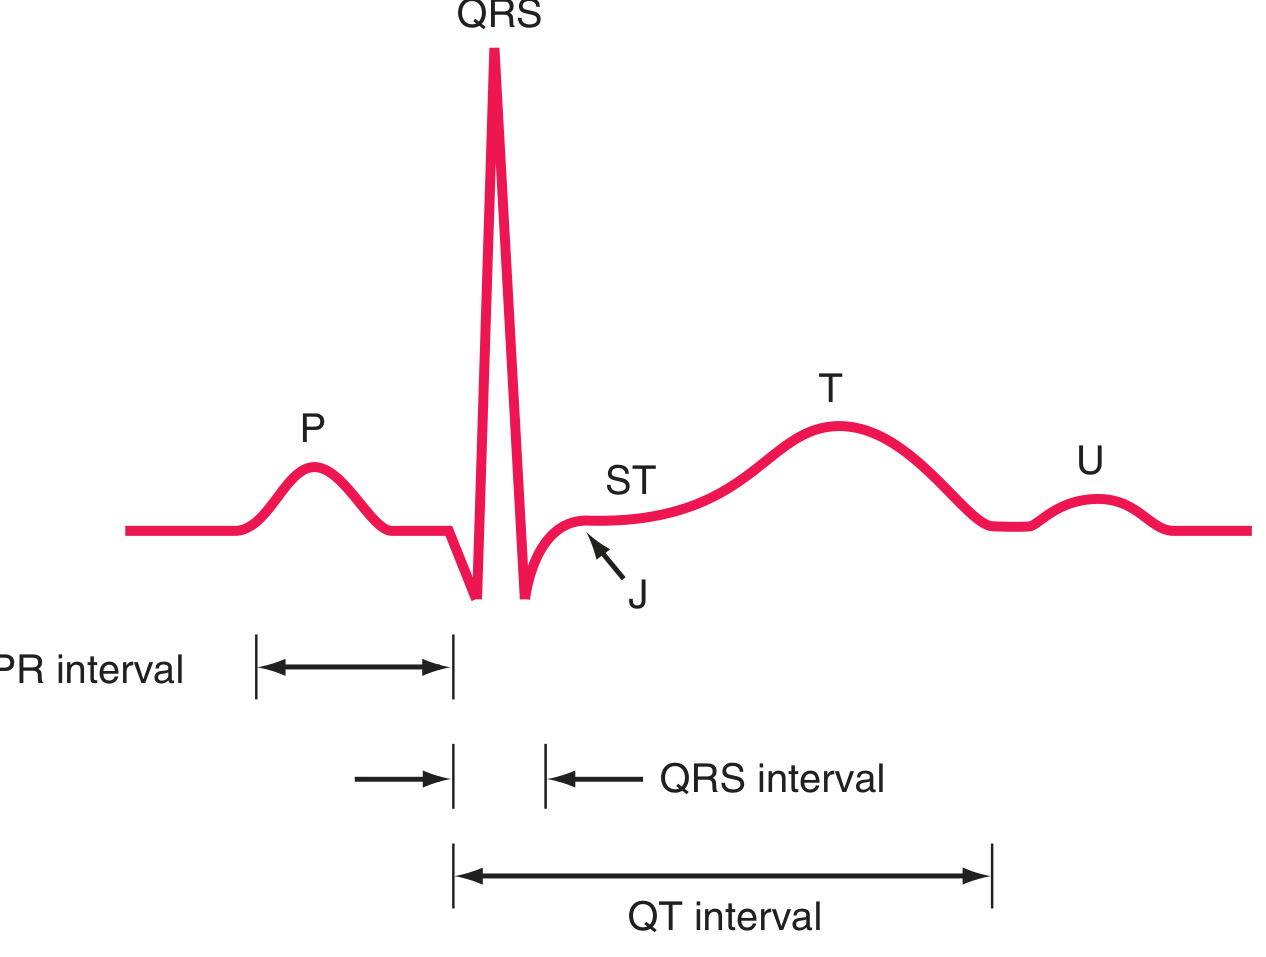
Basic ECG Waveforms & Intervals
| Component | Represents | Normal Value |
|---|---|---|
| P wave | Atrial depolarization | Duration <120 ms; upright in I, II, aVF |
| PR interval | Atrial → ventricular conduction (AV node delay) | 120–200 ms (3–5 small boxes) |
| QRS complex | Ventricular depolarization | ≤100–110 ms (≤2.5 small boxes) |
| J point | Junction of QRS end and ST segment start | Normally isoelectric |
| ST segment | Plateau of ventricular action potential (phase 2) | Isoelectric (±1 mm) |
| T wave | Ventricular repolarization (phase 3) | Asymmetric, upright in most leads |
| U wave | Afterpotentials (Purkinje?) | Small positive deflection after T; prominent in hypokalemia |
| QT interval | Total ventricular depolarization + repolarization | Rate-dependent; use QTc (Bazett: QT/√RR) |
QTc normal: ≤440 ms (men), ≤460 ms (women)
Systematic Approach — 14 Parameters (Harrison's)
A systematic approach prevents errors of omission. Analyze in order:
- Standardization & technical features — calibration (1 mV = 10 mm pulse), paper speed, lead placement, artifacts
- Rhythm — regular vs. irregular; P before every QRS?
- Heart rate — calculate from RR interval
- PR interval / AV conduction — normal, prolonged, absent?
- QRS interval — normal or wide (>120 ms)?
- QT/QTc interval — prolonged?
- Mean QRS electrical axis — normal, left deviation, right deviation?
- P waves — morphology, axis, relation to QRS
- QRS voltages — high (hypertrophy) or low (effusion, obesity)?
- Precordial R-wave progression — normal transition V1→V6?
- Abnormal Q waves — pathologic (>40 ms wide, >25% of R amplitude)?
- ST segments — elevation or depression?
- T waves — inversion, peaked, flattening?
- U waves — prominent (hypokalemia, bradycardia)?
Always compare with previous ECGs — this is invaluable.
Step 1: Heart Rate
Method 1 (precise): HR = 60 ÷ RR interval (in seconds)
Method 2 (quick): Count large boxes between R waves:
| Large boxes (RR) | Heart Rate |
|---|---|
| 1 | 300 bpm |
| 2 | 150 bpm |
| 3 | 100 bpm |
| 4 | 75 bpm |
| 5 | 60 bpm |
| 6 | 50 bpm |
Mnemonic: 300 – 150 – 100 – 75 – 60 – 50
- Normal sinus rate: 60–100 bpm
- Bradycardia: <60 bpm
- Tachycardia: >100 bpm
Step 2: Rhythm
Ask four questions:
- Is there a P wave before every QRS?
- Is the PR interval constant and normal (120–200 ms)?
- Are the RR intervals regular?
- Is the QRS narrow (<120 ms) or wide (≥120 ms)?
Normal Sinus Rhythm (NSR): P waves upright in I, II, aVF; rate 60–100; regular; PR 120–200 ms; QRS narrow.
Step 3: QRS Axis
The QRS axis describes the mean direction of ventricular depolarization in the frontal plane.
| Axis | Degrees | Significance |
|---|---|---|
| Normal | −30° to +90° (or +100°) | Normal |
| Left axis deviation (LAD) | More negative than −30° | Left anterior fascicular block, inferior MI, LVH, LBBB |
| Right axis deviation (RAD) | More positive than +90–100° | RVH, left posterior fascicular block, lateral MI, pulmonary embolism |
| Extreme/indeterminate | −90° to ±180° | Ventricular rhythms |
Quick axis check:
- Lead I and aVF both positive → normal axis
- Lead I positive, aVF negative → LAD
- Lead I negative, aVF positive → RAD
- Both negative → extreme axis deviation
Step 4: P Wave Analysis
| Feature | Normal | Abnormal |
|---|---|---|
| Duration | <120 ms | >120 ms → left atrial enlargement (P mitrale, bifid P in II) |
| Amplitude | <2.5 mm | >2.5 mm in II → right atrial enlargement (P pulmonale) |
| Axis | Upright I, II, aVF | Inverted in II → ectopic atrial rhythm or retrograde conduction |
| Morphology in V1 | Biphasic (small +, small −) | Terminal negative component >1 mm deep and 40 ms wide → LAE |
Step 5: QRS Analysis
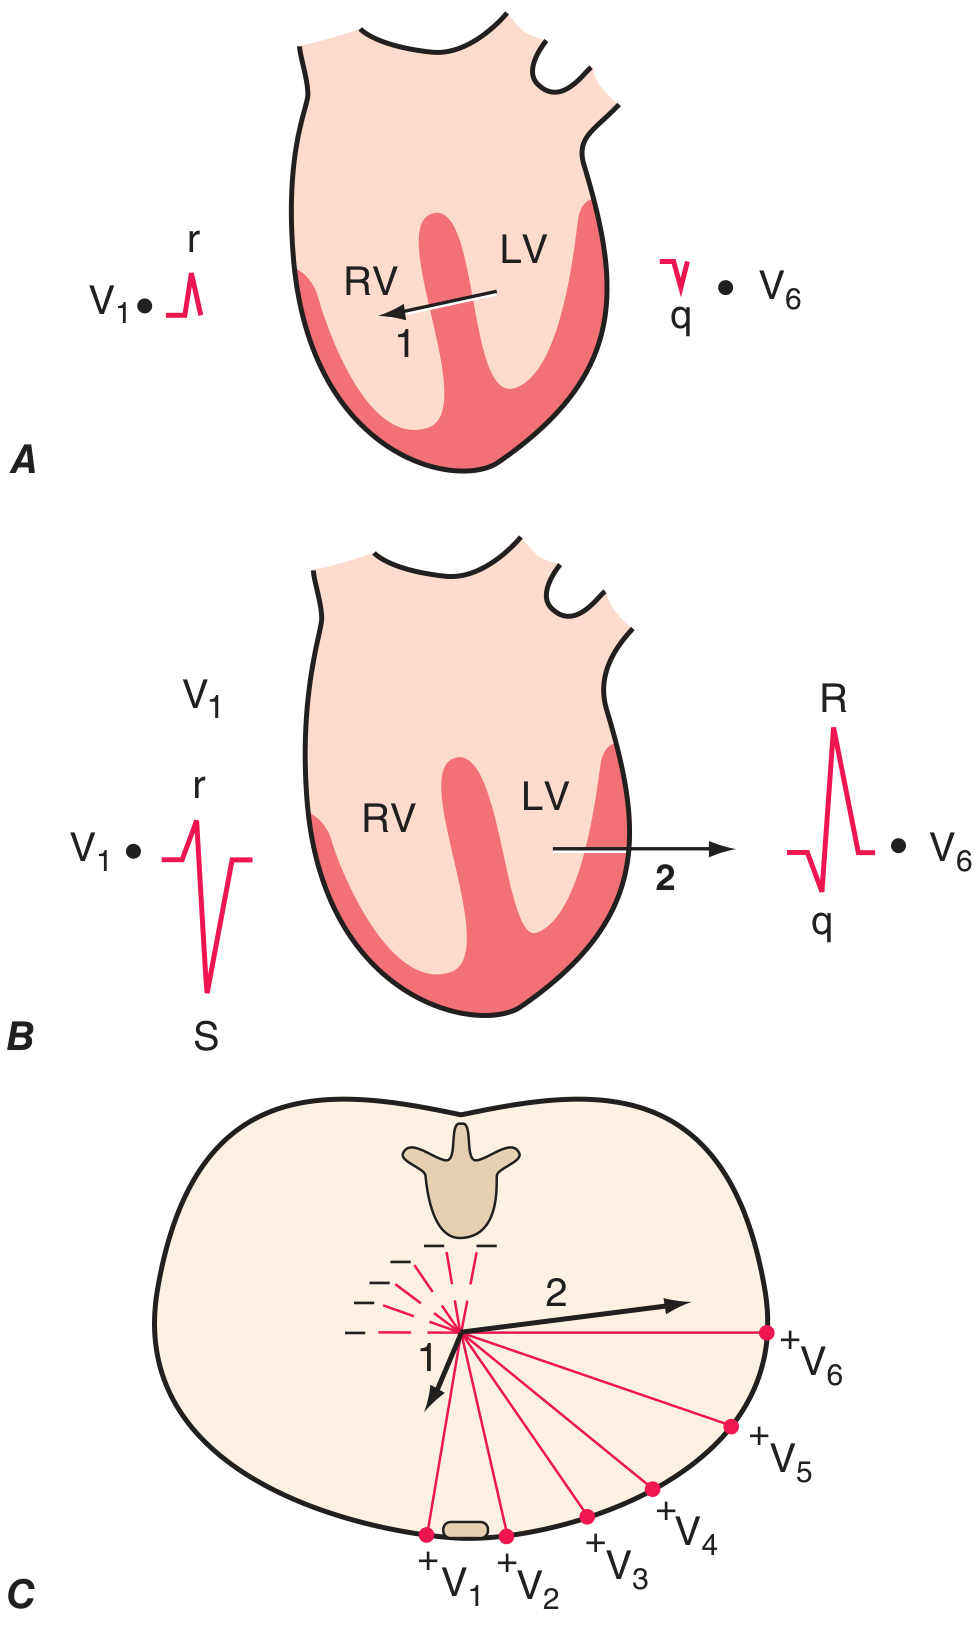
Ventricular Depolarization — Two-Phase Model
-
Phase 1 (Vector 1): Septal depolarization — left → right and anteriorly
- V1: small r wave
- V6: small q wave (septal q)
-
Phase 2 (Vector 2): LV + RV simultaneous — LV dominates; vector points left and posteriorly
- V1: deep S wave
- V6: tall R wave
R-Wave Progression (Precordial)
- R wave amplitude increases V1 → V5/V6
- Transition zone (R = S): normally V3 or V4
- Poor R-wave progression (PRWP): may indicate anterior MI, LVH, LBBB, or be a normal variant
Bundle Branch Blocks (QRS ≥120 ms)
| Feature | RBBB | LBBB |
|---|---|---|
| V1 morphology | rSR' ("rabbit ears") | Broad, notched QS or rS |
| V6 morphology | Wide S wave | Broad, notched R (no q) |
| ST/T changes | Secondary (discordant in V1–V3) | Secondary (discordant T inversion) |
| Axis | Usually normal | Usually LAD |
| Significance | RV overload, PE, ischemia, normal variant | LV disease; makes ischemia/LVH assessment unreliable |
Left anterior fascicular block (LAFB): QRS axis < −45°; no significant QRS widening
Left posterior fascicular block (LPFB): QRS axis >+110°; rare in isolation (exclude RVH first)
Pathologic Q Waves
- Width ≥40 ms (1 small box) and/or depth ≥25% of R wave amplitude
- Indicate prior transmural infarction (or LBBB, WPW, HCM)
- Significant Q waves in a lead distribution = territory of infarcted myocardium
Step 6: ST Segment
| Finding | Causes |
|---|---|
| ST elevation | STEMI, pericarditis, early repolarization, LBBB, LVH, Brugada, aneurysm, myocarditis, hyperkalemia, hypothermia (J/Osborn waves) |
| ST depression | NSTEMI/UA (subendocardial ischemia), reciprocal changes, digoxin effect ("scooped"), RVH, LBBB |
| Diffuse ST elevation + PR depression | Acute pericarditis |
| Saddle-shaped ST elevation | Pericarditis |
Ischemia Patterns (ECG localization of STEMI)
| Territory | Culprit Vessel | Leads with STE |
|---|---|---|
| Anterior (incl. apical, lateral) | LAD | V1–V6, I, aVL |
| Inferior | RCA (or LCx) | II, III, aVF |
| Posterior | LCx (or RCA) | Reciprocal ST depression V1–V3; R > S in V1–V2 |
| Right ventricle | Proximal RCA | Right-sided leads (V3R–V4R); often with inferior STEMI |
| Lateral | LCx | I, aVL, V5–V6 |
Pathophysiology:
- Transmural ischemia → ST vector shifts toward ischemic epicardium → ST elevation + hyperacute T waves
- Subendocardial ischemia → ST vector shifts toward endocardium → ST depression in anterior leads + ST elevation in aVR
Step 7: T Waves
| Finding | Interpretation |
|---|---|
| Tall, peaked ("hyperacute") | Early STEMI (within minutes), hyperkalemia |
| Symmetric deep inversion | Myocardial ischemia, Wellens' syndrome (proximal LAD stenosis), cerebrovascular injury (intracranial hemorrhage) |
| Asymmetric inversion | Non-specific; RVH, LBBB (secondary), normal in V1–V2 |
| Flattening | Hypokalemia, non-specific |
| Concordant with QRS | Normal |
| Discordant with QRS | Expected in LBBB, RVH (secondary changes); ST/T concordance = independent ischemia |
Step 8: QT/QTc Interval
- Measured from QRS onset to end of T wave (in lead II or V5)
- Corrected QTc (Bazett): QT ÷ √(RR interval in seconds)
- Prolonged QTc (>440–460 ms) → risk of Torsades de Pointes
Causes of QT prolongation:
- Drugs: Class IA antiarrhythmics (quinidine, procainamide), Class III (amiodarone, sotalol, dofetilide, ibutilide), tricyclic antidepressants, phenothiazines, fluoroquinolones, azithromycin
- Electrolytes: Hypokalemia, hypomagnesemia, hypocalcemia
- Conditions: Congenital long QT syndrome, hypothermia, intracranial bleeds (SAH)
QT shortening: Hypercalcemia, digoxin, short QT syndrome
Step 9: U Wave
- Small positive deflection after T wave, best seen in V2–V3
- Prominent U waves: Hypokalemia (most common), bradycardia, antiarrhythmics
- Inverted U waves: Ischemia, LVH
Step 10: Metabolic & Drug Effects Summary
| Condition | ECG Changes |
|---|---|
| Hyperkalemia | Peaked T → ↓P amplitude → wide QRS → sine wave → asystole |
| Hypokalemia | Flat T, prominent U wave, ↑QT |
| Hypercalcemia | ↓QT, short ST segment |
| Hypocalcemia | ↑QT, prolonged ST segment |
| Digoxin | "Scooped" ST depression, ↓QT, flat/inverted T, PR prolongation; toxicity → any arrhythmia |
| Hypothermia | Osborn (J) wave, bradycardia, QT prolongation, risk of VF |
| Tricyclics / Class IC drugs | Wide QRS, ↑QT, right axis deviation |
Hypertrophy Criteria
Left Ventricular Hypertrophy (LVH) — Voltage Criteria
- Sokolow-Lyon: S in V1 + R in V5 or V6 ≥35 mm
- Cornell: R in aVL + S in V3 >28 mm (men) or >20 mm (women)
- Supporting: LV strain pattern (ST depression + T inversion in I, aVL, V5–V6); LAE; LAD
Right Ventricular Hypertrophy (RVH)
- R > S in V1 (dominant R in V1)
- RAD (>+100°)
- Deep S in V5/V6
- Right atrial enlargement
- ST depression, T inversion V1–V3 (RV strain)
Localization Quick Reference
| Leads | Region | Vessel |
|---|---|---|
| V1–V4 | Anteroseptal | LAD |
| I, aVL, V5–V6 | Lateral | LCx |
| V1–V6 + I, aVL | Extensive anterior | Proximal LAD |
| II, III, aVF | Inferior | RCA (or LCx) |
| V1–V3 (reciprocal) | Posterior | LCx or RCA |
| V3R–V4R | Right ventricle | Proximal RCA |
Conditions Where ECG Interpretation Is Difficult (Tintinalli's)
- LBBB — masks ischemia; use Sgarbossa criteria for STEMI in LBBB
- Pacemaker rhythm — LBBB-like morphology
- WPW — delta wave, short PR, may mimic LVH or infarction
- LVH — ST/T changes can mimic ischemia
- Hyperkalemia — can produce wide complex suggesting BBB
— Harrison's Principles of Internal Medicine, 22nd ed. (Ch. 247) | Medical Physiology, Boron & Boulpaep (Ch. 21)
This is a shared conversation. Sign in to Orris to start your own chat.