
Organophosphorus poisoining
organophosphorus poisoning cholinergic toxidrome mechanism
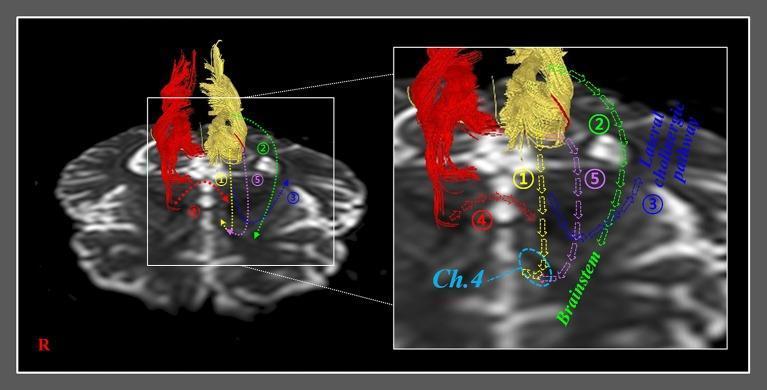
This diagnostic image is a diffusion tensor tractography (DTT) reconstruction overlaid on a grayscale MRI axial slice of the human brain, illustrating five proposed recovery mechanisms for the injured anterior cingulum. The visualization uses colored dotted arrows to represent neural tract trajectories. Mechanism 1 (yellow) shows the normal pathway of the cingulum descending to the basal nucleus of Meynert (Ch. 4). Mechanism 2 (green) depicts a curved pathway descending toward the brainstem cholinergic nuclei. Mechanism 3 (blue) represents the lateral cholinergic pathway extending toward the temporo-occipital white matter. Mechanism 4 (red) demonstrates an interhemispheric tract connecting the contralesional and ipsilesional basal forebrains via the genu of the corpus callosum. Mechanism 5 (purple) illustrates an aberrant pathway from the injured cingulum also terminating at Ch. 4. The diagram serves as an educational model for neuroplasticity and cholinergic system compensation following brain injuries such as traumatic brain injury (TBI) or stroke, highlighting specific neuroanatomical landmarks including the brainstem, basal forebrain, and cingulate cortex.
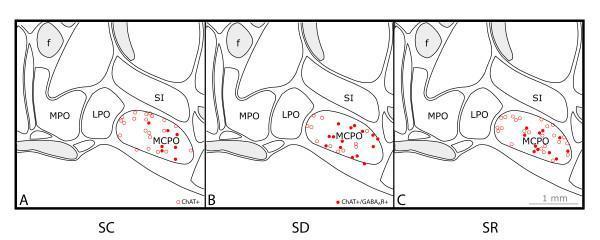
This Comparison Chart consists of three schematic neuroanatomical diagrams (A, B, C) illustrating the distribution of cholinergic neurons in the basal forebrain across three experimental conditions: Sleep Control (SC), Sleep Deprivation (SD), and Sleep Recovery (SR). The diagrams show coronal sections of the basal forebrain with specific anatomical regions labeled, including the fornix (f), medial preoptic area (MPO), lateral preoptic area (LPO), magnocellular preoptic area (MCPO), and substantia innominata (SI). The primary focus is the MCPO, where ChAT+ cells are plotted. Open circles represent cells positive only for choline acetyltransferase (ChAT+), while filled red circles represent double-labeled cells expressing both ChAT and the beta 2-3 subunits of the GABA-A receptor (ChAT+/GABAAR+). Comparison across conditions reveals a distinct shift in protein expression: - SC (Panel A) shows a low proportion of double-labeled cells. - SD (Panel B) demonstrates the highest prevalence of ChAT+/GABAAR+ double-labeled cells. - SR (Panel C) shows an intermediate density. This visual data illustrates the dynamic regulation of GABA receptors on cholinergic neurons in response to sleep homeostatic pressure, highlighting a key pathophysiological mechanism of sleep-wake regulation.
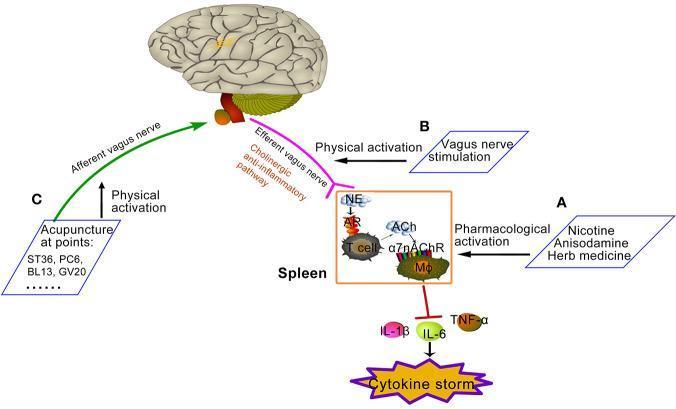
A pathophysiology diagram illustrating three methods for activating the cholinergic anti-inflammatory pathway (CAP) to mitigate a cytokine storm. (A) Pharmacological activation: Involves nicotine, anisodamine, or herbal medicines that target the alpha-7 nicotinic acetylcholine receptor (α7nAChR). (B) Physical activation: Direct Vagus Nerve Stimulation (VNS) targeting the efferent vagal fibers. (C) Physical activation: Acupuncture at specific points (ST36, PC6, BL13, GV20) stimulating the afferent vagus nerve toward the brain. The central mechanism highlights the efferent vagus nerve communicating with the spleen. Within the splenic microenvironment, norepinephrine (NE) and acetylcholine (ACh) interact with T-cells and macrophages (MΦ). Acetylcholine binds to α7nAChR on macrophages to inhibit the release of pro-inflammatory cytokines, including IL-1β, IL-6, and TNF-α. The logical flow demonstrates how these pathways converge to suppress a systemic 'cytokine storm,' providing a visual summary of neuro-immune modulation for medical education in immunology and neurology.
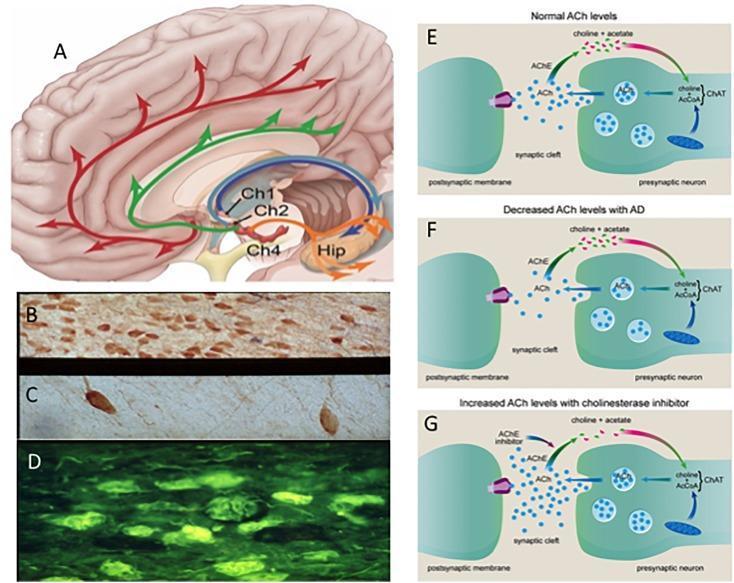
A multi-panel educational composite illustrating the cholinergic system in health and Alzheimer’s Disease (AD). (A) Sagittal anatomical diagram of the human brain showing cholinotrophic projection systems from cholinergic cell groups Ch1 (medial septal), Ch2 (diagonal band), and Ch4 (nucleus basalis) to the neocortex and hippocampus (Hip). (B-D) Photomicrographs comparing basal forebrain neurons: (B) healthy aged control with high neuron density; (C) AD sample showing significant neuronal loss and atrophy; (D) Thioflavin-S fluorescent staining identifying neurofibrillary tangles in p75NTR neurons. (E-G) Pathophysiology diagrams of the cholinergic synapse: (E) normal acetylcholine (ACh) synthesis via ChAT and degradation via AChE; (F) reduced ACh levels typical of AD pathology; and (G) the therapeutic mechanism of acetylcholinesterase inhibitors (AChEIs), which block AChE to increase synaptic ACh availability. The content highlights the neuroanatomical basis, histopathological changes, and pharmacological interventions relevant to dementia and neurodegeneration.
"organophosphate poisoning" AND management
organophosphate poisoning SLUDGE symptoms miosis bradycardia
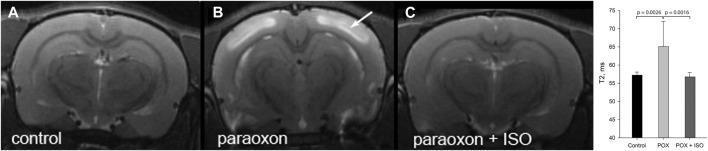
This diagnostic imaging panel features three T2-weighted coronal MRI scans of rat brains alongside a quantitative bar graph, illustrating neuroprotective effects against organophosphate poisoning. Panel (A) displays a control brain with normal, uniform signal intensity. Panel (B) represents a paraoxon-treated animal (POX), showing prominent, bilateral hyperintensities in the neocortex (indicated by a white arrow), which is pathognomonic for cytotoxic edema and fluid accumulation 24 hours post-exposure. Panel (C) shows a rat treated with both paraoxon and a brief high-dose (5%) of isoflurane (ISO), where the cortical signal intensity is restored to near-control levels, indicating prevention of cerebral edema. The accompanying bar graph quantitatively confirms these findings, showing a statistically significant increase in T2 values (ms) in the paraoxon-only group compared to both the control and the isoflurane-treated groups (p < 0.005). The image demonstrates the efficacy of volatile anesthetics in mitigating neurodegeneration and swelling following toxic chemical insult to the central nervous system.
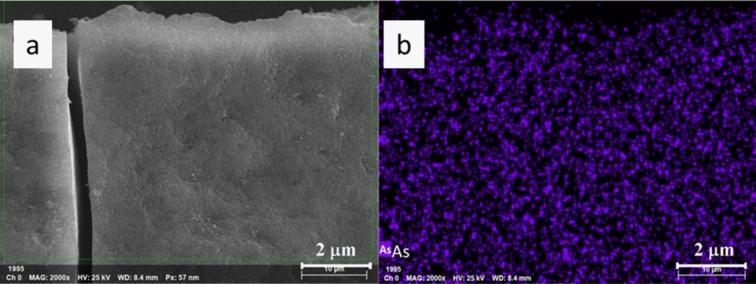
This figure presents diagnostic micro-imaging relevant to environmental toxicology and biomedical engineering, specifically focusing on the remediation of arsenic, a potent human carcinogen. Panel (a) shows a Scanning Electron Microscopy (SEM) image of Mg(OH)2-in situ-As(V) sludge at a 2 μm scale. The image reveals an amorphous, relatively smooth bulk morphology with fine surface irregularities and a prominent vertical micro-crack, indicating the structural characteristics of the adsorbent matrix. Panel (b) illustrates elemental mapping of Arsenic (As) within the same sludge sample, represented by purple fluorescence. The distribution is highly uniform across the matrix, suggesting effective encapsulation of As(V) rather than simple surface adsorption. This uniform dispersion is clinically significant for the development of highly efficient detoxification protocols and wastewater treatment standards to prevent chronic arsenic poisoning. The visual data supports the mechanism of irreversible co-precipitation in amorphous magnesium hydroxide flocs, a key concept in toxicology and preventive medicine regarding heavy metal sequestration.
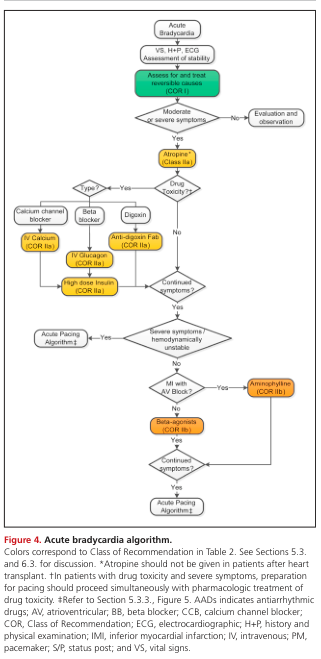
Summary : This figure presents a clinical decision flowchart for the management of acute bradycardia, detailing assessment steps, interventions, and pharmacologic treatments based on symptom severity and underlying causes. flowchart: # Nodes : • Acute Bradycardia (rounded rectangle) • VS, H+P, ECG Assessment of stability (rounded rectangle) • Assess for and treat reversible causes (COR I) (green rounded rectangle) • Moderate or severe symptoms (diamond) • Evaluation and observation (rounded rectangle) • Atropine* (Class IIa) (yellow rounded rectangle) • Drug Toxicity? (diamond) • Type? (diamond) • Calcium channel blocker (rounded rectangle) • IV Calcium (COR IIa) (yellow rounded rectangle) • Beta blocker (rounded rectangle) • IV Glucagon (COR IIa) (yellow rounded rectangle) • High dose Insulin (COR IIa) (yellow rounded rectangle) • Digoxin (rounded rectangle) • Anti-digoxin Fab (COR IIa) (yellow rounded rectangle) • Continued symptoms? (diamond) • Severe symptoms, hemodynamically unstable (diamond) • Acute Pacing Algorithm‡ (rounded rectangle) • MI with AV Block? (diamond) • Aminophylline (COR IIb) (yellow rounded rectangle) • Beta-agonists (COR IIb) (yellow rounded rectangle) • Continued symptoms? (diamond) • Acute Pacing Algorithm‡ (rounded rectangle) # Connectors : • Arrows indicate progression from assessment to treatment. • Branches split at decision diamonds (e.g., “Moderate or severe symptoms”, “Drug Toxicity?”, “Type?”, “Continued symptoms?”). • Yes/No labels on branches direct flow to appropriate next steps. • Pharmacologic interventions are highlighted in yellow, with class of recommendation (COR) indicated. • Green node for initial reversible cause assessment. • Flow merges at repeated “Continued symptoms?” and “Acute Pacing Algorithm‡” nodes. # Layout : • Top-down hierarchical structure. • Initial assessment at the top, followed by symptom evaluation. • Branches for drug toxicity and specific drug types (calcium channel blocker, beta blocker, digoxin). • Interventions and further decision points cascade downward. • Repeated checks for continued symptoms and instability. • Acute pacing algorithm appears at two points for refractory cases. # Analysis : • The flowchart provides a systematic approach for acute bradycardia management, prioritizing reversible causes and symptom severity. • Drug toxicity is a key branch, with tailored antidotes for specific agents. • Pharmacologic interventions are color-coded by recommendation strength, guiding clinicians on preferred treatments. • The algorithm ensures escalation to pacing for persistent or unstable cases, emphasizing safety and evidence-based care. • The structure supports rapid decision-making in acute clinical settings.
Organophosphorus (Organophosphate) Poisoning
Overview
Mechanism of Toxicity
| Enzyme | Location |
|---|---|
| Acetylcholinesterase (true/RBC cholinesterase) | Erythrocyte membranes, nervous tissue, skeletal muscle |
| Plasma cholinesterase (pseudocholinesterase/butyrylcholinesterase) | Serum, liver, pancreas, heart, brain |
- OP compound binds and phosphorylates AChE - initially reversible
- If not treated early, "aging" occurs - the bond becomes permanent and irreversible
- ACh accumulates at all cholinergic synapses: muscarinic (parasympathetic), nicotinic (NMJ, autonomic ganglia), and CNS
- This produces a cholinergic crisis
Routes of Exposure
- Inhalation - occupational spraying, agricultural aerosols
- Dermal/transconjunctival - most common in agriculture; flea-dip products
- Ingestion - most common cause of severe/fatal poisoning (deliberate self-poisoning globally)
- Mucous membrane absorption
Clinical Features - The Cholinergic Toxidrome
1. Muscarinic Effects (Parasympathetic - "SLUDGE / DUMBELS")
- Salivation
- Lacrimation
- Urination
- Defecation
- Gastric cramps / emesis
- Emesis
- Defecation, Diarrhea
- Urination
- Miosis (pinpoint pupils - classic finding)
- Bradycardia, Bronchospasm, Bronchorrhea
- Emesis
- Lacrimation
- Salivation, Secretions, Sweating
2. Nicotinic Effects (NMJ and Autonomic Ganglia)
- Muscle fasciculations
- Weakness progressing to flaccid paralysis
- Tachycardia (nicotinic stimulation can override muscarinic bradycardia)
- Hypertension (early)
- Muscle cramps, tremor
Note: Tachycardia is NOT a contraindication to atropine, as it may be secondary to hypoxia from bronchospasm/bronchorrhea.
3. CNS Effects
- Anxiety, restlessness, confusion
- Seizures (often refractory)
- Loss of consciousness
- Central respiratory depression (a major cause of death)
The Intermediate Syndrome
- Proximal limb weakness
- Neck flexor weakness
- Respiratory muscle paralysis (can be fatal if not ventilated)
- Cranial nerve palsies
- Not effectively treated with standard atropine/oxime protocols
- More common with fat-soluble OP compounds (e.g., fenthion, dimethoate)
- Particularly lethal in resource-limited settings
Delayed Neuropathy (OPIDP)
- Organophosphate-induced delayed polyneuropathy (OPIDP)
- Occurs 2-3 weeks after exposure
- Due to inhibition of neuropathy target esterase (NTE)
- Distal sensorimotor polyneuropathy - "glove and stocking" pattern
- Can progress to spastic paraparesis
- More common with some specific OP compounds (e.g., triorthocresyl phosphate - TOCP)
Diagnosis
Clinical Diagnosis
- History of exposure + cholinergic toxidrome = presumptive diagnosis
- Classic triad: miosis + bronchospasm/secretions + altered consciousness
Laboratory Confirmation
| Test | Significance |
|---|---|
| RBC acetylcholinesterase | Reflects true CNS AChE inhibition; more specific but takes longer |
| Plasma cholinesterase (pseudocholinesterase) | Faster, more practical; depressed earlier; affected by baseline variation and other factors |
- A >50% depression in cholinesterase activity from baseline is diagnostic
- Serial measurements are more useful than single values
- Normal values do NOT exclude OP poisoning if symptoms are present
Other findings
- Hyperglycemia (correlates with severity)
- Leukocytosis
- Elevated amylase/lipase
- ECG: prolonged QT, bradycardia, heart block
Management
Immediate Priorities (ABC)
- Personal protective equipment - rescuers must protect themselves (dermal + respiratory)
- Airway management - early intubation if respiratory compromise; avoid succinylcholine (plasma cholinesterase is inhibited, prolonging duration of action)
- Decontamination - remove clothing, copious water irrigation of skin and eyes
Specific Antidotes
1. Atropine (Antimuscarinic)
- Drug of choice for muscarinic symptoms
- Competes with ACh at muscarinic receptors
- Dose: Start with 2-4 mg IV in adults (0.02 mg/kg in children), repeat every 5-10 minutes
- Titrate to secretions - the endpoint is drying of secretions and clearing of bronchospasm, NOT heart rate or pupil size
- Massive doses may be required in severe poisoning (hundreds of mg over hours)
- Tachycardia is NOT a contraindication (it may be hypoxia-driven)
2. Oximes (Pralidoxime / 2-PAM)
- Mechanism: Reactivate phosphorylated AChE before aging occurs
- Active at nicotinic receptors (NMJ) - treats muscle weakness and paralysis
- Pralidoxime (2-PAM): 1-2 g IV over 15-30 min, then infusion
- Obidoxime - used in some countries
- Must be given early, before aging; ineffective after aging
- Effectiveness is agent-specific - limited data on some newer OP compounds
Recent evidence note: A 2026 umbrella review (PMID 42258859) and a 2025 systematic review on glycopyrrolate (PMID 38797902) have raised questions about the benefit of oximes in some settings. The role of oximes remains debated; atropine remains the cornerstone.
3. Benzodiazepines
- For seizures - first-line (diazepam, lorazepam, midazolam)
- Also reduce CNS excitability
- Phenytoin is ineffective for OP-related seizures
4. Glycopyrrolate
- Alternative to atropine (quaternary ammonium - does not cross BBB)
- May be useful when CNS effects of atropine are problematic
- Supported by recent systematic review (PMID 38797902)
No Role For:
- Enhanced elimination (hemodialysis, hemoperfusion) - OP compounds are highly protein-bound and lipid-soluble; no benefit
- Succinylcholine for intubation (use rocuronium instead)
Carbamate Poisoning - Key Differences
| Feature | Organophosphates | Carbamates |
|---|---|---|
| AChE binding | Irreversible (aging) | Reversible (spontaneous reactivation) |
| Duration | Prolonged (days-weeks) | Shorter (hours) |
| CNS penetration | Most penetrate CNS | Carbamic acid esters penetrate poorly |
| Oxime use | Beneficial (if early) | May be contraindicated (e.g., aldicarb) |
| Severity | Often more severe | Usually self-limited |
Summary: Key Points for Exams / Bedside
| Mnemonic | Content |
|---|---|
| SLUDGE | Salivation, Lacrimation, Urination, Defecation, GI cramps, Emesis |
| DUMBELS | Defecation, Urination, Miosis, Bradycardia/Bronchospasm/Bronchorrhea, Emesis, Lacrimation, Salivation |
| Killer B's | Bradycardia, Bronchospasm, Bronchorrhea - the three most lethal muscarinic effects |
| Antidote | Atropine (muscarinic) + Pralidoxime (nicotinic/NMJ) + Benzodiazepine (seizures) |
| Avoid | Succinylcholine for RSI |
| Endpoint of atropine | Dry secretions, not heart rate |
- Tintinalli's Emergency Medicine: A Comprehensive Study, Chapter 201 (Pesticides) - the primary reference for clinical features, pathophysiology, and management
- Katzung's Basic and Clinical Pharmacology, 16th Ed., Chapter on Human Toxicology - pharmacological mechanisms
- Henry's Clinical Diagnosis and Management by Laboratory Methods - laboratory diagnosis
- Recent evidence: Therapeutic Interventions in OP Poisoning: Umbrella Review (2026) | Glycopyrrolate Systematic Review (2025)