
QUESTION 7: LEUCOCYTES — Classification, Development, Types, Percentage & Functions
leucocytes white blood cells classification types diagram
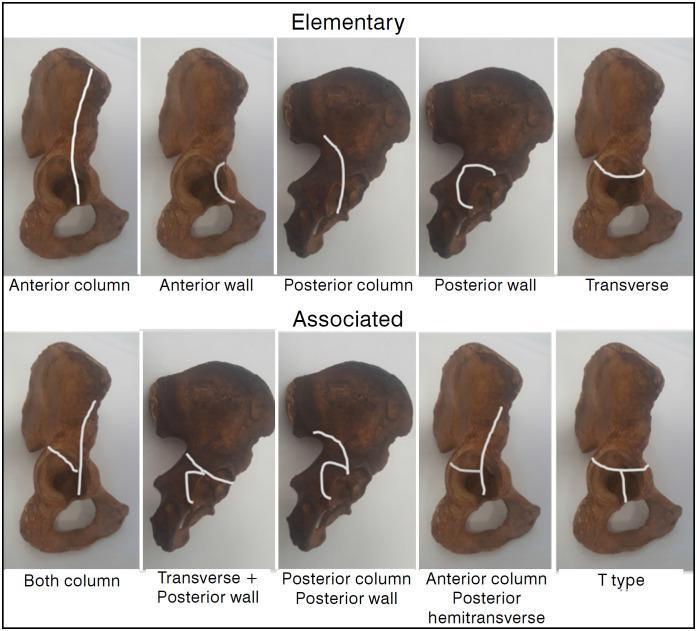
Educational diagram illustrating the Judet-Letournel classification of acetabular fractures using anatomical specimens of the hemipelvis. The visual is divided into two rows: 'Elementary' and 'Associated' fracture types. White lines superimposed on the specimens delineate specific fracture patterns. The 'Elementary' row features five simple patterns: Anterior column (vertical line through the pelvic brim), Anterior wall (localized articular segment), Posterior column (ischiadic notch through obturator foramen), Posterior wall (localized posterior rim), and Transverse (horizontal line bisecting the acetabulum). The 'Associated' row demonstrates complex configurations: Both column, Transverse plus posterior wall, Posterior column plus posterior wall, Anterior column with posterior hemitransverse (a vertical anterior column line joined by a horizontal posterior component), and T-type (a transverse fracture with an additional vertical stem extending through the obturator foramen). This orthopedic diagram serves as a clinical reference for orthopedic surgeons and medical students to understand pelvic trauma morphology and surgical planning.
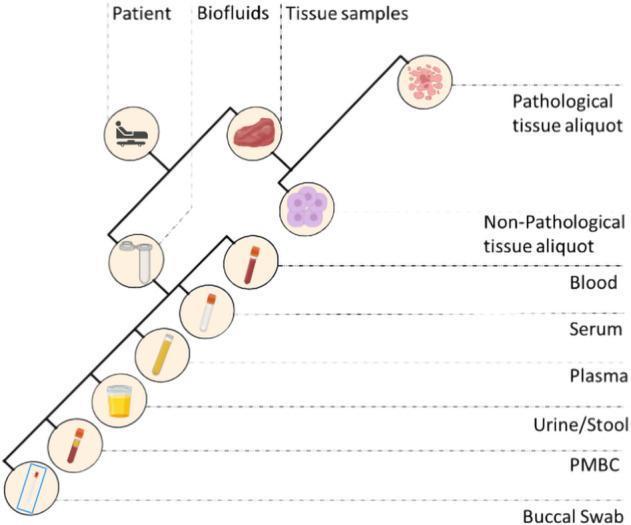
An educational flowchart illustrating the organization and classification of various human biospecimens collected in a standard clinical biobank. The diagram follows a hierarchical structure originating from the 'Patient' and branching into two primary categories: 'Biofluids' and 'Tissue samples.' The 'Tissue samples' category further differentiates into 'Pathological tissue aliquot,' represented by irregular cell clusters, and 'Non-Pathological tissue aliquot,' represented by organized cellular structures. The 'Biofluids' category includes several sub-types represented by specific collection containers: blood (whole blood in a red-topped tube), serum (clear yellowish fluid), plasma (transparent light yellow fluid), urine/stool (yellow liquid in a specimen container), peripheral blood mononuclear cells (PMBC, shown in a tube), and buccal swabs (represented by a slide/swab). This diagram demonstrates the diverse material types essential for oncology research and translational medicine, emphasizing the standardized nomenclature and segregation required for high-quality biospecimen management.
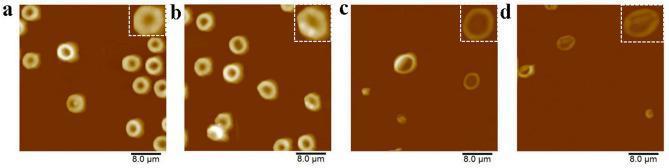
Atomic Force Microscopy (AFM) images depicting the morphological assessment of C57BL/6 mouse blood cells to evaluate the biocompatibility of RGDV-gemcitabine. The image is divided into four panels (a–d), each with a scale bar of 8.0 μm and a locally amplified inset. Panels (a) and (b) show erythrocytes (red blood cells) in ultrapure water (control) and treated with 1 mM RGDV-gemcitabine, respectively. In both conditions, the erythrocytes maintain a characteristic biconcave, ring-like morphology with smooth surfaces, indicating no significant cytotoxic structural damage. Panels (c) and (d) display leucocytes (white blood cells) under the same control and experimental conditions. The leucocytes appear as larger, somewhat more irregular ring-like structures compared to erythrocytes, but likewise retain a smooth surface texture following RGDV-gemcitabine treatment. The background in all AFM topographical maps is a uniform dark brown, highlighting the brighter, elevated cellular structures. These diagnostic images are used in pharmacological research to demonstrate that the RGDV-gemcitabine conjugate does not adversely affect the surface morphology of healthy hematopoietic cells.
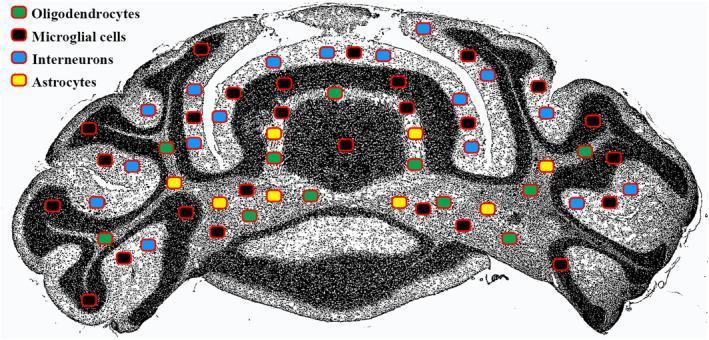
This anatomical diagram displays a coronal section of the cerebellum, highlighting the specialized distribution of neural and glial cells within its histological layers. The illustration uses a color-coded mapping system to identify four key cell types: Interneurons (blue), Astrocytes (yellow), Oligodendrocytes (green), and Microglial cells (black). The cerebellar architecture is visually differentiated into the outer gray matter (molecular and granular layers) and the inner white matter core. Interneurons are primarily localized within the superficial molecular layer. Astrocytes and oligodendrocytes are depicted as being concentrated within the central white matter regions, reflecting their roles in metabolic support and myelination, respectively. Microglial cells are shown distributed ubiquitously throughout both the gray and white matter, illustrating their role in immune surveillance across the entire structure. This diagram serves as an educational tool for neuroanatomy and neurobiology, demonstrating the regional specificity of glia and neurons within the cerebellar cortex and subcortical regions.
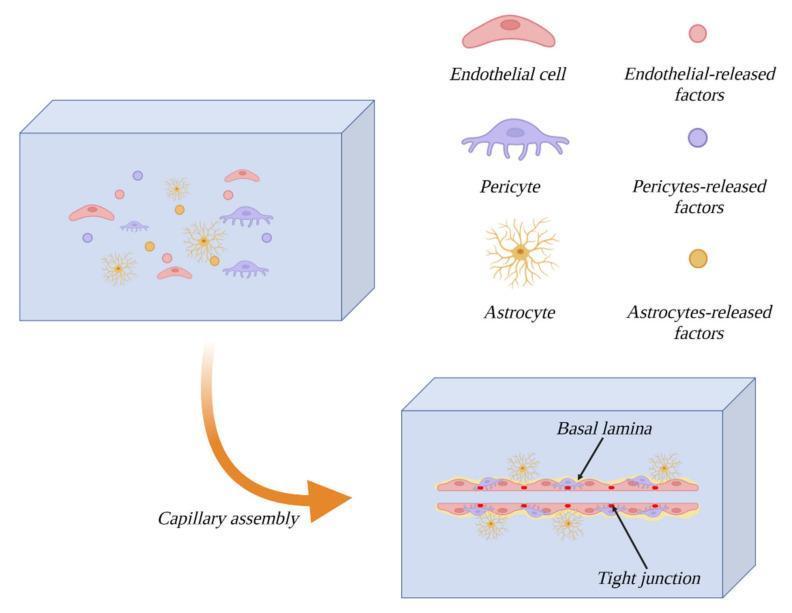
This medical illustration depicts a three-dimensional extracellular matrix (3D-ECM) model illustrating the capillary assembly process and the cellular components of the Blood-Brain Barrier (BBB). The diagram is divided into stages: an initial state where individual cell types are suspended in a gel-like matrix, and a final assembled state. The primary cell types shown include pink elongated endothelial cells, purple branched pericytes, and yellow star-shaped astrocytes. Accompanying each cell type are their respective secreted signaling factors (red, purple, and yellow spheres). The second stage, labeled 'Capillary assembly,' demonstrates the structural organization of these components into a functional microvessel. In the assembled capillary, endothelial cells form the luminal lining connected by tight junctions. A surrounding basal lamina is visible, with pericytes situated in direct contact with the endothelial surface. Astrocytes extend their end-feet processes to wrap around the exterior of the capillary. This model highlights the importance of the microenvironment and intercellular communication in angiogenesis and barrier integrity for neurovascular research.
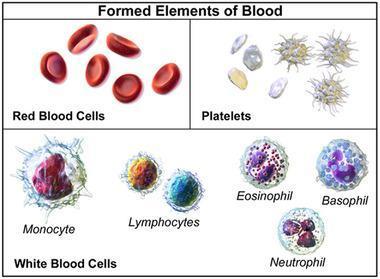
This medical illustration depicts the 'Formed Elements of Blood,' categorizing human blood cells into three main sections. The top-left panel illustrates Red Blood Cells (erythrocytes), showing their characteristic biconcave, disc-like shape and reddish-pink coloration, optimized for gas exchange. The top-right panel displays Platelets (thrombocytes) and fibrin-like structures, represented as small, irregular fragments involved in hemostasis. The bottom panel provides a detailed comparison of White Blood Cells (leukocytes), categorized by morphology: the large Monocyte with a kidney-bean shaped nucleus; smaller Lymphocytes with large round nuclei; and the Granulocytes, which include the reddish-pink granulated Eosinophil, the dark-blue granulated Basophil, and the multi-lobed Neutrophil. The diagram serves as a primary educational resource for hematology, illustrating the distinguishing cytological features, sizes, and nuclear structures of the various cellular components of blood for students and clinical laboratory science professionals.
blood smear neutrophil eosinophil basophil monocyte lymphocyte microscopy
This medical illustration depicts the 'Formed Elements of Blood,' categorizing human blood cells into three main sections. The top-left panel illustrates Red Blood Cells (erythrocytes), showing their characteristic biconcave, disc-like shape and reddish-pink coloration, optimized for gas exchange. The top-right panel displays Platelets (thrombocytes) and fibrin-like structures, represented as small, irregular fragments involved in hemostasis. The bottom panel provides a detailed comparison of White Blood Cells (leukocytes), categorized by morphology: the large Monocyte with a kidney-bean shaped nucleus; smaller Lymphocytes with large round nuclei; and the Granulocytes, which include the reddish-pink granulated Eosinophil, the dark-blue granulated Basophil, and the multi-lobed Neutrophil. The diagram serves as a primary educational resource for hematology, illustrating the distinguishing cytological features, sizes, and nuclear structures of the various cellular components of blood for students and clinical laboratory science professionals.
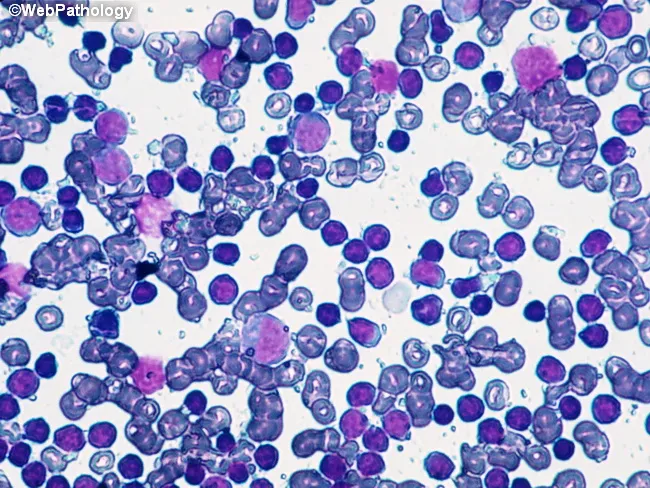
Imaging modality: Brightfield light microscopy of a Wright-Giemsa stained peripheral blood smear. The slide shows a predominant population of small to medium-sized lymphoid cells with scant pale cytoplasm and dense, clumped chromatin. Numerous cells exhibit mature-appearing B lymphocyte morphology. A fine background of erythrocytes and occasional smudge cells is present, with no overt blasts or granulocytic abnormalities. The overall pattern is lymphocytosis with a monomorphic lymphocytic population, compatible with monoclonal B-cell lymphocytosis (MBL) or the chronic lymphocytic leukemia (CLL) spectrum. Immunophenotypic confirmation (CD5+, CD23+, CD19+, surface Ig) is typically required for definitive classification, but is outside the scope of this image. The cluster appears relatively uniform, suggesting clonality rather than reactive lymphocytosis. Genetic associations commonly reported with CLL/MBL include 13q14 deletion and trisomy 12, though such findings require molecular testing. Clinically, CLL is defined by an absolute lymphocyte count ≥5.0 x 10^9/L in peripheral blood for at least 3 months; values below this threshold meet criteria for MBL. The image illustrates morphologic correlates of indolent clonal B-cell expansions and underscores the need to integrate flow cytometry and cytogenetics for diagnosis, prognosis, and management decisions. This image is educational for hematology, pathology, and cytology reference libraries.
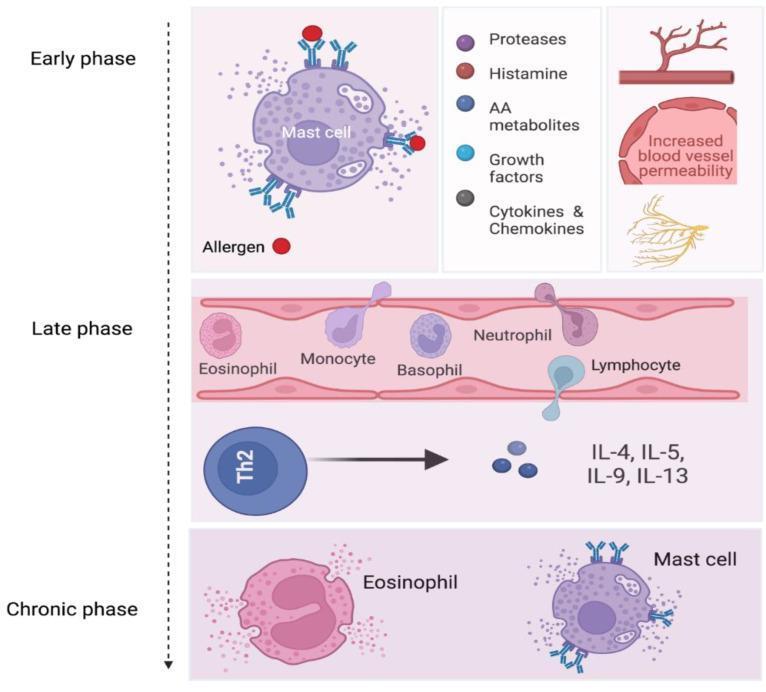
A pathophysiology diagram illustrating the three stages of allergic rhinitis: Early phase, Late phase, and Chronic phase. The 'Early phase' section depicts a mast cell activated by allergens binding to IgE on its surface receptors, triggering the release of inflammatory mediators including proteases, histamine, arachidonic acid (AA) metabolites, growth factors, and cytokines/chemokines. Associated vascular changes such as increased blood vessel permeability and nerve stimulation are shown. The 'Late phase' section demonstrates leukocyte recruitment and extravasation through a blood vessel wall, featuring an eosinophil, monocyte, basophil, neutrophil, and a migrating lymphocyte. It also shows a Th2 cell secreting interleukins IL-4, IL-5, IL-9, and IL-13. The 'Chronic phase' section illustrates the persistent presence and coexistence of degranulating eosinophils and mast cells in the inflamed tissue. This diagram provides a clinical overview of the immunological cascade and cellular interactions involved in allergic airway inflammation and tissue remodeling.
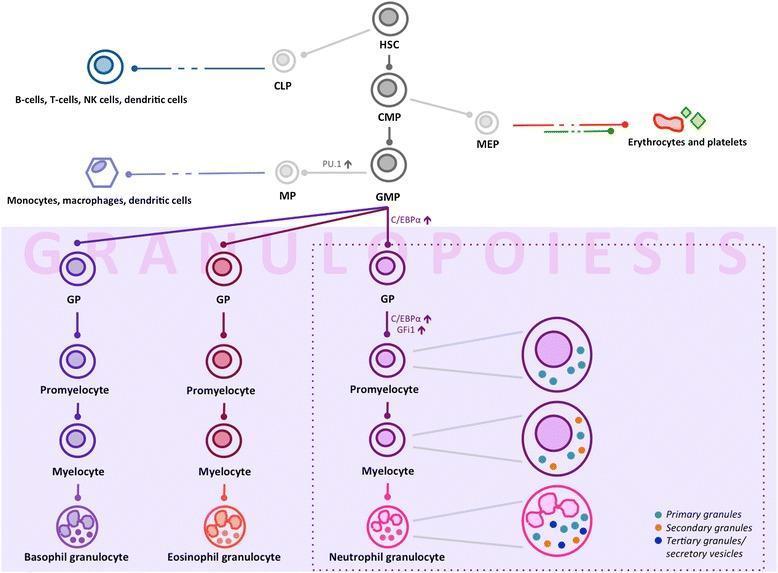
This hematology flowchart illustrates the process of granulopoiesis and myeloid differentiation from hematopoietic stem cells (HSC). The diagram follows the hierarchy from HSC to common myeloid progenitors (CMP) and granulocyte/monocyte progenitors (GMP). It highlights the branching pathways leading to erythroid/megakaryocyte lineages (MEP) and lymphoid lineages (CLP). Within the granulopoiesis section, the diagram details the maturation of three granulocyte types: Basophil, Eosinophil, and Neutrophil. For neutrophils, it depicts the morphological transition from granulocyte progenitor (GP) through the promyelocyte and myelocyte stages to the terminal neutrophil granulocyte, characterized by a polylobulated nucleus. Key transcription factors regulating these fate decisions are annotated, including PU.1 for monocyte/macrophage differentiation, and C/EBPα and GFi1 for granulocytic commitment. A specialized inset shows the sequential appearance of cytoplasmic granules: primary granules at the promyelocyte stage, secondary granules at the myelocyte stage, and tertiary granules/secretory vesicles in the mature neutrophil. This educational schematic is intended for clinical immunology and hematology students to understand cellular maturation and terminal differentiation markers.
QUESTION 7: LEUCOCYTES (White Blood Cells) - Complete Overview
1. DEFINITION
- Normal count: 4,000 - 11,000 cells/µL of blood (average ~7,000-9,000/µL)
- Vastly outnumbered by RBCs (1 WBC : ~700 RBCs)
2. CLASSIFICATION
LEUCOCYTES
├── GRANULOCYTES (Polymorphonuclear - PMNs)
│   ├── Neutrophils
│   ├── Eosinophils
│   └── Basophils
│
└── AGRANULOCYTES
    ├── Lymphocytes (T cells, B cells, NK cells)
    └── Monocytes (→ Macrophages in tissues)
Classification source: - Histology: A Text and Atlas (Pawlina), and Guyton & Hall Medical Physiology
3. NORMAL PERCENTAGES (Differential Count)
| Cell Type | Average Cells/µL | Normal Range | % of Total WBCs |
|---|---|---|---|
| Neutrophils | 5,400 | 3,000-6,000 | 50-70% (Guyton: ~62%) |
| Lymphocytes | 2,750 | 1,500-4,000 | 20-40% (Guyton: ~30%) |
| Monocytes | 540 | 300-600 | 2-8% (Guyton: ~5.3%) |
| Eosinophils | 275 | 150-300 | 1-4% (Guyton: ~2.3%) |
| Basophils | 35 | 0-100 | 0.4% |
Source: Ganong's Review of Medical Physiology, Table 31-1
4. DEVELOPMENT (Leukopoiesis / Genesis of WBCs)
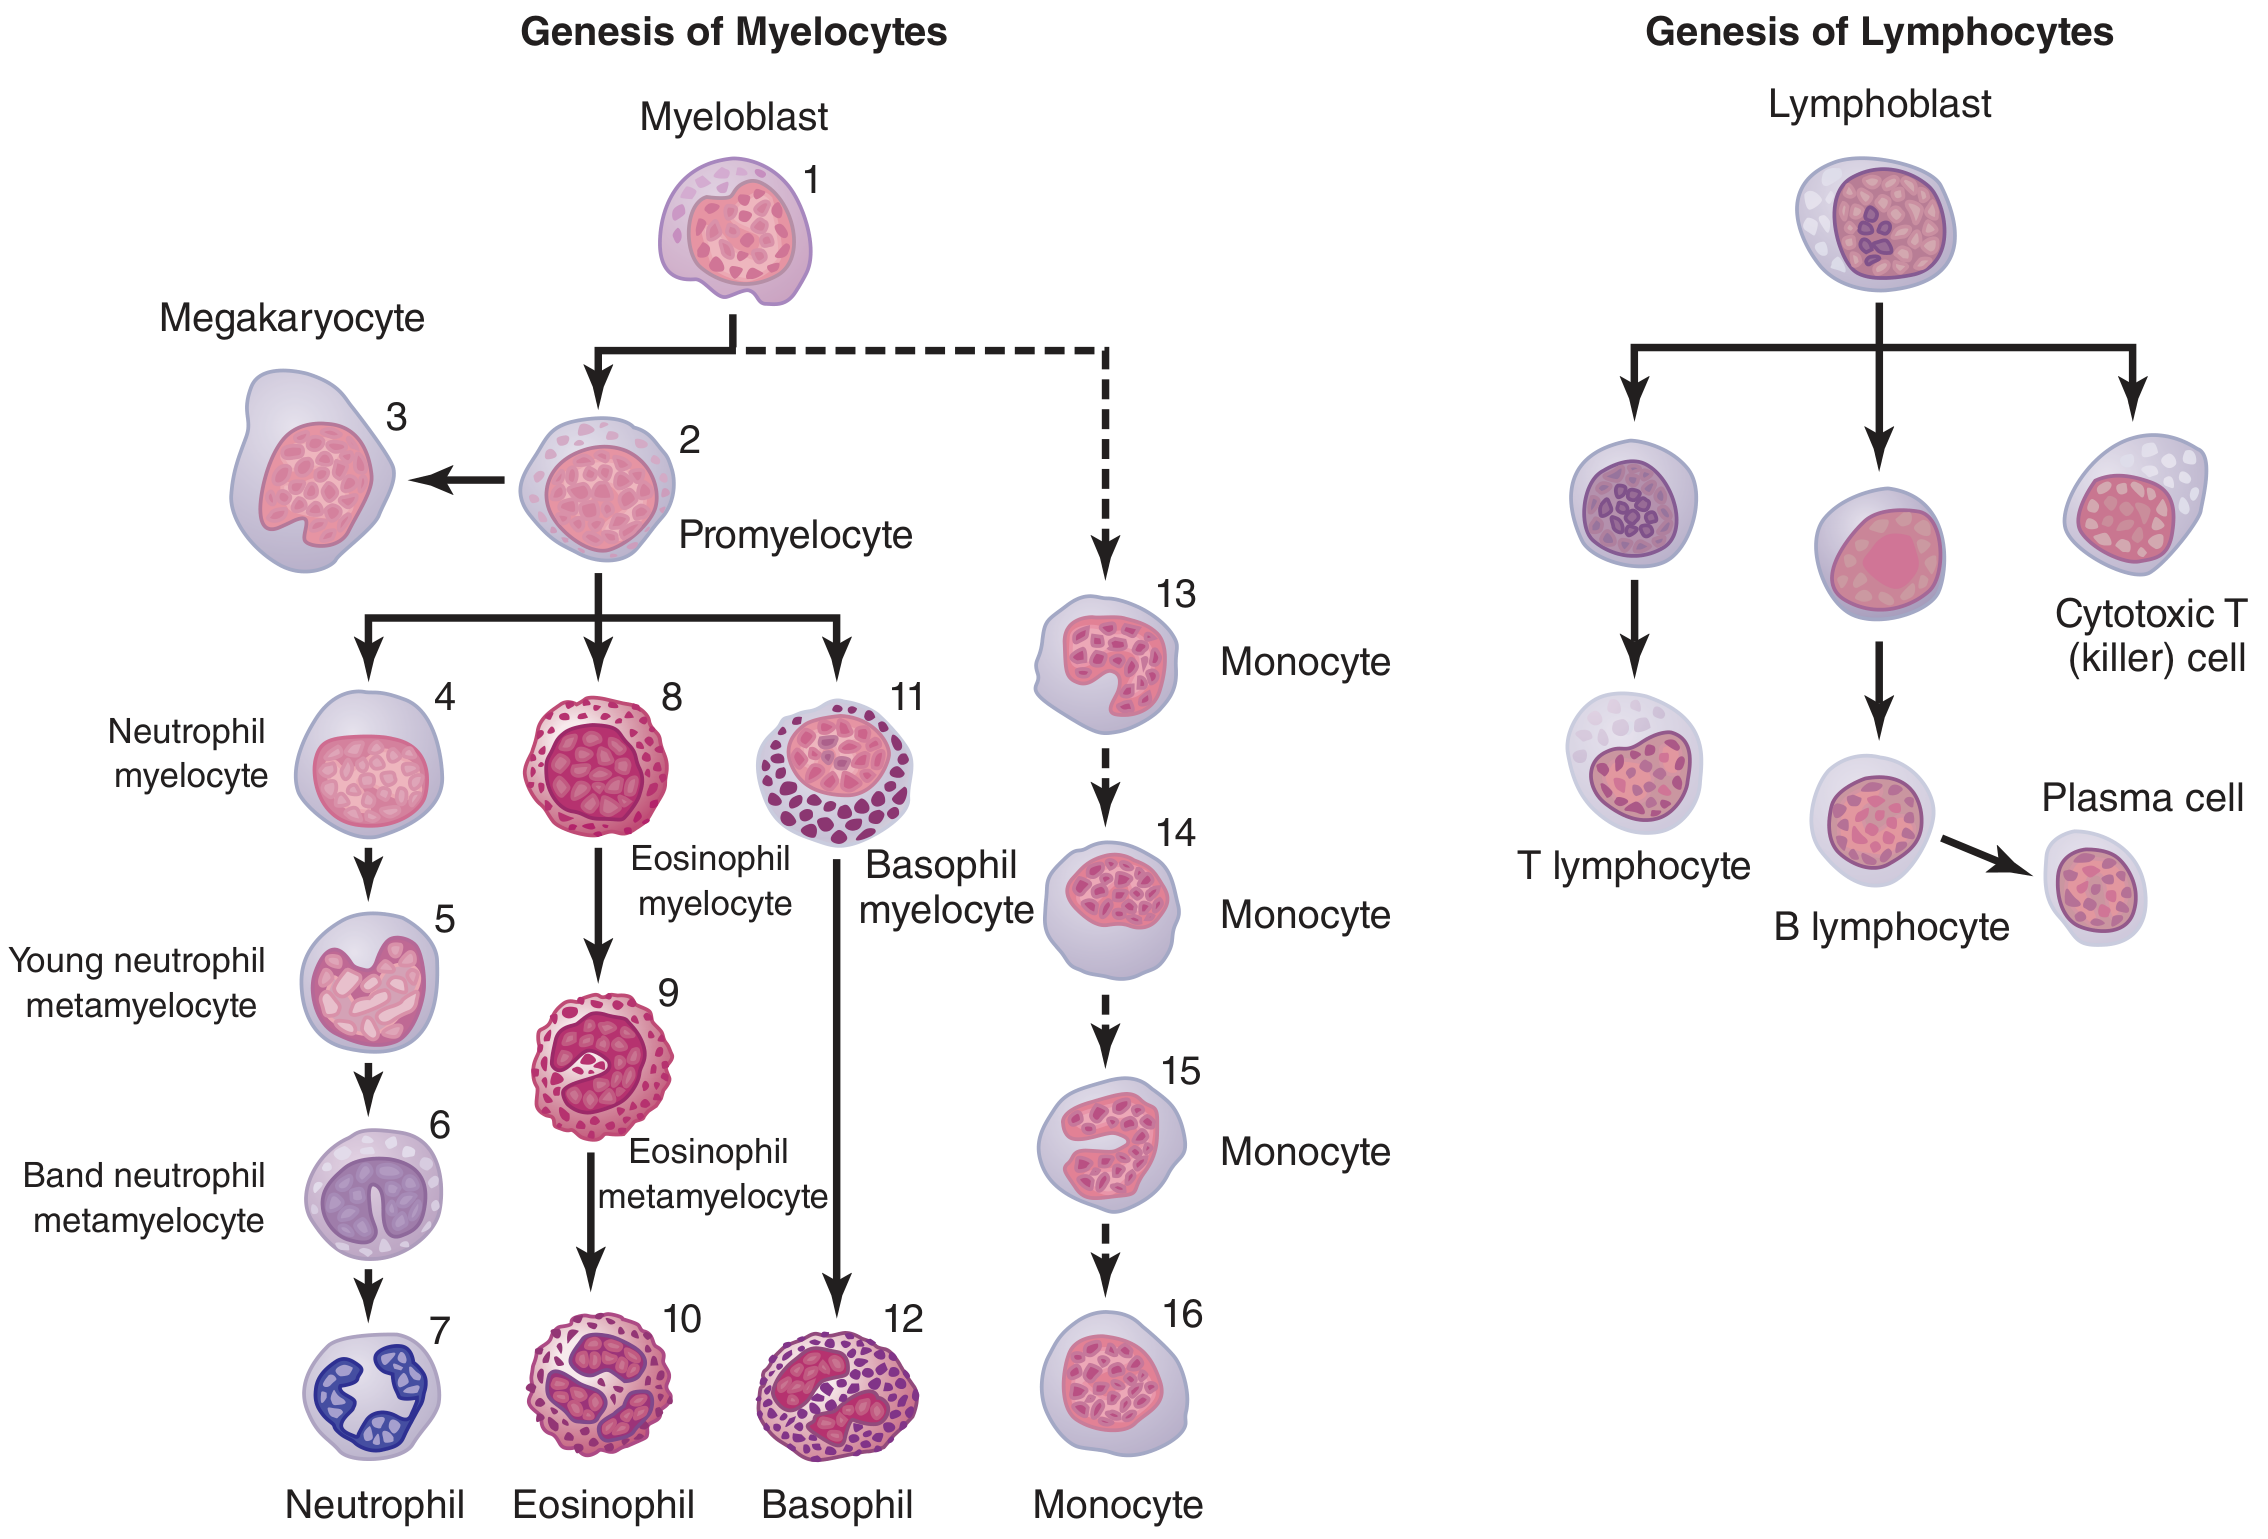
Two Major Lineages:
A. Myelocytic Lineage (Myelopoiesis) - in Bone Marrow
Myeloblast → Promyelocyte → Myelocyte → Metamyelocyte → Band Cell → Mature Cell

Neutrophil path:   Myeloblast → Promyelocyte → Neutrophil myelocyte →
                   Young neutrophil metamyelocyte → Band neutrophil → Neutrophil

Eosinophil path:   Myeloblast → Promyelocyte → Eosinophil myelocyte →
                   Eosinophil metamyelocyte → Eosinophil

Basophil path:     Myeloblast → Promyelocyte → Basophil myelocyte → Basophil

Monocyte path:     Myeloblast → Promyelocyte → Monocyte (stages 13-16)
B. Lymphocytic Lineage (Lymphopoiesis) - in Lymphoid Tissues
Lymphoblast → T Lymphocyte (processed in thymus)
            → B Lymphocyte → Plasma Cell
            → Cytotoxic (NK/Killer) cells
Key Points on Development:
- Granulocytes and monocytes are formed only in bone marrow
- Lymphocytes and plasma cells are formed mainly in lymphoid tissues: lymph nodes, spleen, thymus, tonsils, Peyer's patches, and some in bone marrow
- Bone marrow stores ~3x more WBCs than circulate in blood (~6-day supply)
- Under the influence of cytokines and growth factors, HSCs differentiate into:
- Common Myeloid Progenitor (CMP) - gives rise to granulocytes, monocytes, RBCs, megakaryocytes
- Common Lymphoid Progenitor (CLP) - gives rise to T cells, B cells, NK cells
Source: Guyton & Hall, p.451; Histology (Pawlina)
5. TYPES - DETAILED CHARACTERISTICS & FUNCTIONS
🔵 A. NEUTROPHILS (Polymorphonuclear Neutrophils - PMNs)
| Feature | Details |
|---|---|
| Percentage | 50-70% (most numerous WBC) |
| Nucleus | Multilobed (2-5 lobes), polymorphic |
| Granules | Specific granules with enzymes, complement activators, antimicrobial peptides (lysozyme, lactoferrin, defensins) |
| Size | 10-12 µm |
| Life span | 4-8 hours in blood + 4-5 days in tissues |
- Phagocytosis - primary "first responders"; engulf and destroy bacteria
- Antimicrobial killing - via lysozyme, defensins, lactoferrin, myeloperoxidase (respiratory burst - H₂O₂, HOCl)
- Diapedesis - squeeze through postcapillary venule endothelial gaps via selectins/integrins
- Chemotaxis - attracted to inflamed tissue up to 100 µm away by bacterial toxins, complement products (C3a, C5a), tissue breakdown products
- Ameboid motion - move at up to 40 µm/min through tissues
- NET formation - Neutrophil Extracellular Traps trap pathogens
🔴 B. EOSINOPHILS
| Feature | Details |
|---|---|
| Percentage | 1-4% |
| Nucleus | Bilobed |
| Granules | Large, bright eosinophilic (acid-loving) granules; contain Major Basic Protein (MBP), Eosinophil Cationic Protein (ECP), eosinophil peroxidase |
| Life span | Days in blood; weeks in tissues |
- Anti-parasitic defense - granule proteins are cytotoxic to helminths and protozoa
- Allergic reactions - recruited in Type I hypersensitivity (IgE-mediated); dampen mast cell-mediated reactions
- Modulation of inflammation - release histaminase to counter allergic mediators
- Phagocytosis of antigen-antibody complexes
🟣 C. BASOPHILS
| Feature | Details |
|---|---|
| Percentage | <0.5% (rarest circulating WBC) |
| Nucleus | Irregular, lobulated, obscured by granules |
| Granules | Large, intensely basophilic (blue-purple); contain heparin, histamine, heparan sulfate, leukotrienes |
- Allergic reactions - IgE receptors (FcεRI) on surface; degranulate on allergen exposure releasing histamine and leukotrienes (Type I hypersensitivity - immediate hypersensitivity)
- Anticoagulation - release heparin to prevent clotting in inflammation
- Chemotaxis - attract other immune cells to inflammation sites
- Tissue basophils = Mast cells (related but distinct cells residing in connective tissue)
🟢 D. MONOCYTES
| Feature | Details |
|---|---|
| Percentage | 2-8% |
| Nucleus | Kidney/horseshoe-shaped (indented) |
| Cytoplasm | Abundant, agranular, grey-blue |
| Life span | 10-20 hours in blood → months in tissues as macrophages |
- Phagocytosis - engulf bacteria, dead cells, debris
- Differentiation into macrophages - on entering tissues, swell up to 60-80 µm; become "tissue macrophages" (part of the Mononuclear Phagocyte System / Reticuloendothelial System)
- Antigen presentation - process and present antigens to T lymphocytes (MHC II pathway)
- Cytokine production - produce IL-1, IL-6, TNF-α
- Tissue-specific macrophages: Kupffer cells (liver), Microglia (brain), Alveolar macrophages (lung), Osteoclasts (bone)
⚪ E. LYMPHOCYTES
| Feature | Details |
|---|---|
| Percentage | 20-40% (second most numerous) |
| Nucleus | Large, round, dense; takes up most of cell |
| Cytoplasm | Thin rim, scanty |
| Size | Small (7-8 µm) to large (12-15 µm) |
1. T Lymphocytes (T cells) - Cell-mediated immunity
- Processed in the thymus
- Subtypes:
- CD4+ Helper T cells (Th) - coordinate immune response; activate B cells and CTLs; produce cytokines
- Th1: activate macrophages, cytotoxic responses
- Th2: promote antibody production, allergic responses
- CD8+ Cytotoxic T cells (CTLs) - kill virus-infected cells and tumor cells by perforin/granzyme
- T regulatory cells (Tregs) - suppress immune responses; prevent autoimmunity
- CD4+ Helper T cells (Th) - coordinate immune response; activate B cells and CTLs; produce cytokines
2. B Lymphocytes (B cells) - Humoral immunity
- Matured in bone marrow
- On activation → differentiate into Plasma cells → produce antibodies (immunoglobulins: IgG, IgA, IgM, IgE, IgD)
- Some B cells → Memory B cells for long-term immunity
3. Natural Killer (NK) Cells
- Innate immune cells
- Kill virus-infected cells and cancer cells without prior sensitization
- Recognize "missing self" (absent MHC I)
- Release perforins and granzymes
6. PROPERTIES SHARED BY NEUTROPHILS & MONOCYTES/MACROPHAGES
| Property | Details |
|---|---|
| Diapedesis (Extravasation) | Squeeze through endothelial gaps; involves selectins (rolling), integrins (firm adhesion), then transmigration |
| Ameboid movement | Move at ~40 µm/min through tissue |
| Chemotaxis | Directed movement toward chemical signals (up to 100 µm) |
| Phagocytosis | Engulf material; must be "recognized" - facilitated by opsonization with IgG antibodies and complement (C3b) |
| Killing mechanisms | Oxidative: H₂O₂, superoxide, HOCl; Non-oxidative: lysozyme, defensins, elastase |
7. LIFE SPANS SUMMARY
| Cell Type | Blood Life Span | Tissue Life Span |
|---|---|---|
| Neutrophils | 4-8 hours | 4-5 days (shorter if infection) |
| Eosinophils | Hours-days | Weeks |
| Basophils | Hours | Days |
| Monocytes | 10-20 hours | Months (as macrophages) |
| Lymphocytes | Hours (recirculate) | Weeks-months |
8. KEY CLINICAL CORRELATIONS
| Abnormality | Cause |
|---|---|
| Neutrophilia | Bacterial infections, steroids, exercise, MI |
| Neutropenia | Viral infections, chemotherapy, aplastic anemia |
| Eosinophilia | Parasites, allergies, Löffler's syndrome, Addison's disease |
| Basophilia | Chronic myeloid leukemia (CML), hypothyroidism |
| Lymphocytosis | Viral infections (EBV, CMV), CLL, whooping cough |
| Monocytosis | TB, infective endocarditis, protozoan infections |
| Leukocytosis | Infections, inflammation, leukemia |
| Leukopenia | Aplastic anemia, agranulocytosis, immunosuppression |
9. VISUAL SUMMARY - WBC Morphology
- Guyton & Hall Textbook of Medical Physiology, Chapter 34 (p.450-451)
- Ganong's Review of Medical Physiology, 26th Ed., Chapter 31 (Table 31-1)
- Histology: A Text and Atlas with Correlated Cell & Molecular Biology (Pawlina), p.766-767