I now have comprehensive content from multiple authoritative pharmacology textbooks. Let me compile the full assignment.
Volume of Distribution in Pharmacology
A Pharmacy Assignment
1. Introduction
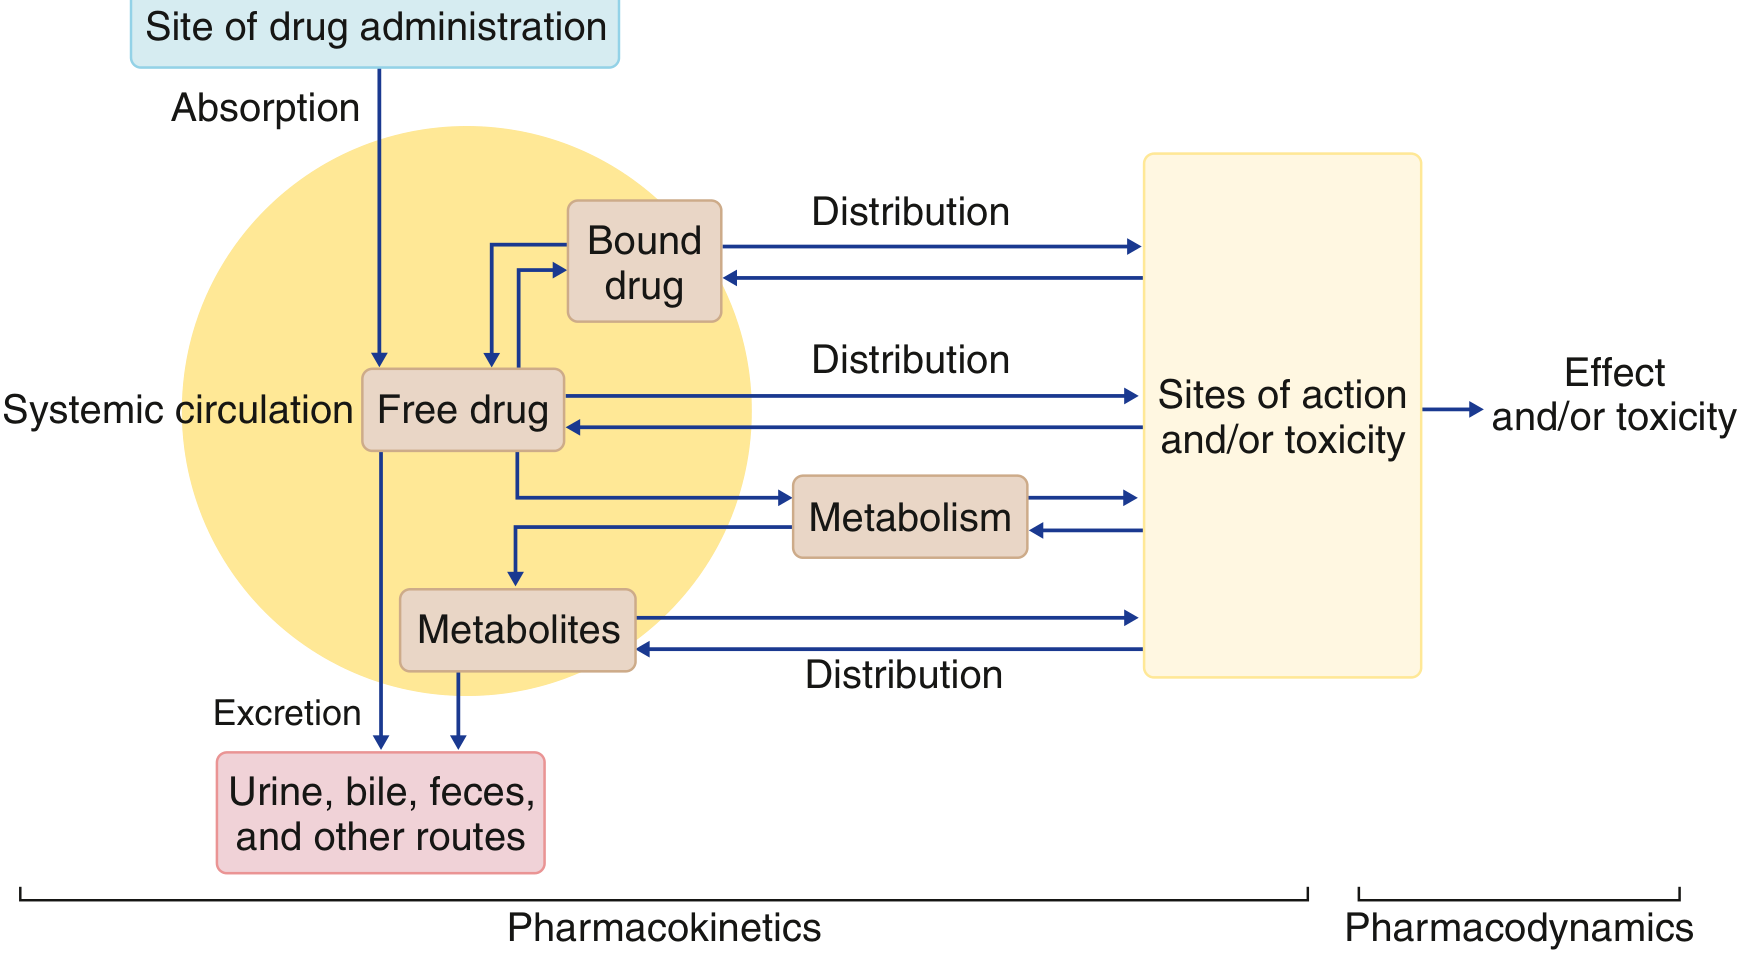
Pharmacokinetics is the study of what the body does to a drug - encompassing absorption, distribution, metabolism, and excretion (ADME). Among the core pharmacokinetic parameters, Volume of Distribution (Vd) is one of the most important and most frequently misunderstood concepts. It is not a real anatomical space, but a powerful mathematical tool that describes how a drug spreads throughout the body.
2. Definition of Volume of Distribution
Volume of distribution (Vd) is a pharmacokinetic parameter that relates the total amount of drug in the body to the concentration of drug measured in the plasma (or blood) at a given time.
The mathematical definition is:
Vd = Amount of Drug in Body / Plasma Drug Concentration
Or expressed as:
Vd = Dose / Cp₀
Where:
- Dose = amount of drug administered (in mg)
- Cp₀ = plasma concentration at time zero (in mg/L)
- Vd is expressed in Litres (L) or L/kg body weight
Because Vd is calculated from plasma concentrations - and drugs may distribute far beyond the plasma - this value is referred to as the "apparent" volume of distribution. It is a hypothetical volume, not a real physiological compartment. - Katzung's Basic and Clinical Pharmacology, 16th Edition, p.77
3. The "Tank" Analogy
A helpful way to conceptualize Vd is the dilution-in-a-tank model (from Miller's Anesthesia, 10th Edition):
Imagine injecting a drug into a sealed tank of water. If you inject 10 mg and measure a concentration of 5 mg/L, you can calculate the tank volume = 10 mg ÷ 5 mg/L = 2 litres.
In the human body, drug does not stay in plasma. It:
- Distributes into interstitial fluid
- Enters intracellular compartments
- Binds to plasma proteins (staying in plasma but "unavailable")
- Binds to tissue proteins (leaving plasma)
- Accumulates in fat, bone, or specific organs
The result is that the calculated "apparent volume" often far exceeds the body's actual total water volume (~42 L in a 70 kg adult).
4. Formula and Calculation
Basic Formula:
$$V_d = \frac{\text{Total Amount of Drug in Body}}{\text{Plasma Drug Concentration}}$$
For Loading Dose Calculation:
$$\text{Loading Dose} = V_d \times C_{target}$$
Relationship with Half-life:
$$t_{1/2} = \frac{0.693 \times V_d}{CL}$$
Where CL = clearance of the drug.
This equation shows that a larger Vd leads to a longer half-life, because the drug is spread out over a larger apparent volume and takes more time to be cleared.
5. Physical Body Compartments vs. Vd
Understanding Vd requires knowing the real volumes of fluid compartments in a 70 kg adult:
| Body Compartment | Volume (L/kg) | Volume (70 kg adult) | Example Drugs |
|---|
| Plasma | 0.04 L/kg | ~2.8 L | Heparin, Warfarin (low Vd) |
| Extracellular water | 0.2 L/kg | ~14 L | Gentamicin, mannitol |
| Total body water | 0.6 L/kg | ~42 L | Ethanol, small water-soluble drugs |
| Fat | 0.2-0.35 L/kg | ~14-24 L | Diazepam, thiopental |
| Whole body + tissues | >>0.6 L/kg | >>42 L | Digoxin (~500 L), Chloroquine |
Source: Katzung's Basic and Clinical Pharmacology, Table 3-2
6. Interpretation of Vd Values
| Vd Value | Interpretation | Drug Examples |
|---|
| ~3-5 L (plasma only) | Drug stays in plasma; large molecule or highly protein-bound | Warfarin (~7 L), Heparin |
| ~14 L (extracellular fluid) | Drug distributes into plasma + interstitial fluid | Gentamicin, aminoglycosides |
| ~42 L (total body water) | Drug distributes throughout all body water | Ethanol, theophylline |
| >100 L (very high) | Drug extensively bound to peripheral tissues or fat | Chloroquine (~200-800 L), Amiodarone (~5000 L) |
| ~500-700 L (extremely high) | Drug massively concentrated in tissues vs. plasma | Digoxin (~500 L) |
A small Vd means the drug is largely confined to the bloodstream.
A large Vd means the drug has left the plasma and accumulated in tissues.
7. Factors Affecting Volume of Distribution
Several physiological and physicochemical factors influence Vd:
7.1 Physicochemical Properties of the Drug
| Factor | Effect on Vd |
|---|
| High lipophilicity | Increases Vd - drug partitions into fat and membranes |
| High water solubility | Decreases Vd - drug stays in aqueous compartments |
| Ionization (charge) | Charged molecules stay in aqueous phase - lower Vd |
| Molecular size | Large molecules (e.g. biologics) restricted to plasma - low Vd |
7.2 Plasma Protein Binding
- Drugs bound to plasma proteins (albumin, α1-acid glycoprotein) are confined to the plasma compartment and cannot distribute freely.
- High plasma protein binding → lower Vd
- Example: Warfarin is ~99% protein-bound → Vd ~7 L (near plasma volume)
- If a second drug displaces the first from binding sites, free drug increases → Vd increases
7.3 Tissue Protein Binding
- Drugs that bind strongly to tissue proteins or intracellular targets have very high Vd because they are "pulled" out of plasma into tissues.
- Example: Digoxin binds to Na⁺/K⁺-ATPase in cardiac and skeletal muscle → Vd ~500 L
7.4 pH and pKa
- The pH partition hypothesis: drugs accumulate in compartments where they become ionized and "trapped."
- Weak bases (e.g., morphine, chloroquine) accumulate in acidic compartments (e.g., lysosomes) → higher Vd
- Weak acids stay mainly in plasma (alkaline pH) → lower Vd
7.5 Body Composition
| Condition | Effect |
|---|
| Obesity | Increased Vd for lipophilic drugs |
| Dehydration | Decreased Vd for water-soluble drugs |
| Edema/ascites | Increased Vd for hydrophilic drugs |
| Old age | Decreased lean body mass → altered Vd |
| Neonates | Higher total body water ratio → increased Vd for water-soluble drugs |
| Pregnancy | Increased plasma volume → increased Vd |
7.6 Disease States
| Disease | Effect on Vd |
|---|
| Liver disease | Reduced albumin synthesis → more free drug → increased Vd |
| Renal failure | Decreased protein binding, fluid accumulation → altered Vd |
| Heart failure | Reduced tissue perfusion → decreased Vd |
| Burns | Massive fluid shifts → unpredictable Vd changes |
8. Compartment Models
Drug distribution is often described using compartment models:
One-Compartment Model
- Drug distributes instantly and uniformly throughout the body.
- Simple model, applicable to some drugs.
- Vd remains constant throughout the concentration-time curve.
Two-Compartment Model
- Central compartment = plasma + highly perfused organs (heart, liver, kidney, lungs)
- Peripheral compartment = muscle, fat, skin, bone
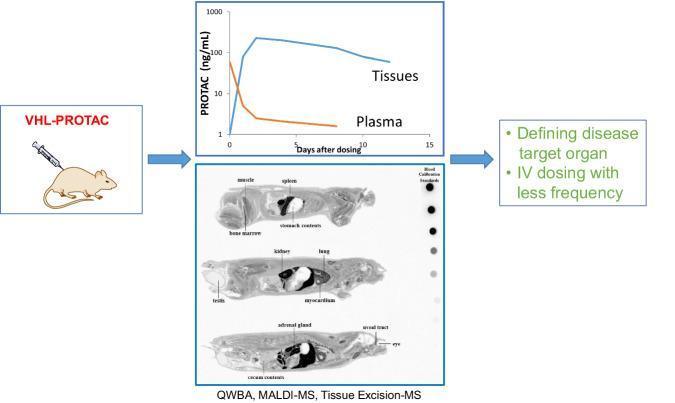
- After IV administration, drug first distributes into the central compartment (fast), then slowly equilibrates with the peripheral compartment.
- Vd increases over time as drug equilibrates between compartments.
Multi-Compartment Models
- Some drugs (e.g., amiodarone) have 3 or more compartments.
- These drugs have very complex distribution kinetics and extremely long half-lives.
Source: Miller's Anesthesia, 10th Edition, p.1698-1703
9. Clinical Importance of Volume of Distribution
The Vd is not just a theoretical value - it has several critical clinical applications:
9.1 Loading Dose Calculation
The most direct clinical use of Vd is to calculate the loading dose - the initial large dose given to rapidly achieve a therapeutic plasma concentration:
Loading Dose (LD) = Target Plasma Concentration (Css) × Vd
Example: If you want to achieve Css = 1.5 mg/L of digoxin and Vd = 500 L:
LD = 1.5 × 500 = 750 mg
Without Vd, you cannot properly calculate loading doses, and the patient may receive a subtherapeutic or toxic initial dose. - Goldman-Cecil Medicine, p.255
9.2 Predicting Drug Half-life
Half-life (t₁/2) is directly proportional to Vd:
t₁/2 = 0.693 × Vd / CL
- A drug with a high Vd will have a long half-life (takes longer to leave the tissues and be cleared).
- A drug with a low Vd and high clearance will have a short half-life.
This is clinically important for:
- Determining dosing intervals
- Estimating time to steady state (approximately 4-5 half-lives)
- Planning drug withdrawal before procedures
9.3 Therapeutic Drug Monitoring (TDM)
Knowing Vd allows clinicians to:
- Interpret plasma drug concentrations correctly
- Adjust doses in patients with altered physiology (renal failure, liver disease, obesity)
- Monitor drugs with narrow therapeutic indices (digoxin, phenytoin, gentamicin, lithium, vancomycin)
9.4 Assessment of Dialysis Effectiveness
In drug overdose management, Vd determines whether dialysis will be useful:
- Small Vd (drug in plasma): dialysis effectively removes the drug (e.g., methanol, ethylene glycol)
- Large Vd (drug in tissues): dialysis is ineffective because most drug is not in the plasma (e.g., tricyclic antidepressants, digoxin)
This is a life-saving consideration in the emergency management of poisoning.
9.5 Predicting Toxicity and Drug Interactions
- Drugs that displace a highly protein-bound drug from albumin will suddenly increase the free fraction → increased Vd → potentially toxic plasma concentrations in other tissues.
- Example: Warfarin + aspirin interaction
9.6 Dosing in Special Populations
| Population | How Vd Knowledge Helps |
|---|
| Obese patients | Lipophilic drugs need dose based on total body weight (not ideal) |
| Neonates | Higher total body water → increased Vd for water-soluble drugs |
| Elderly | Decreased muscle mass, altered fat → adjust doses of digoxin, benzodiazepines |
| Renal failure | Fluid retention increases Vd for some drugs |
| Liver failure | Decreased protein binding → higher free drug → higher effective Vd |
9.7 Drug Development
During new drug development, Vd helps:
- Predict tissue accumulation and potential for organ toxicity
- Establish initial dosing regimens before full pharmacodynamic data are available
- Guide selection of appropriate dosing frequency
10. Examples of Drugs and Their Vd
| Drug | Vd (L/70 kg) | Location | Clinical Note |
|---|
| Heparin | ~4 L | Plasma only | Cannot cross cell membranes |
| Warfarin | ~7 L | Mainly plasma | 99% protein-bound |
| Gentamicin | ~14 L | Extracellular fluid | Hydrophilic antibiotic |
| Theophylline | ~30 L | Total body water | Uniform distribution |
| Ethanol | ~42 L | Total body water | Small, water-soluble |
| Morphine | ~200 L | Tissues | Moderate tissue binding |
| Digoxin | ~500 L | Muscle/cardiac tissue | Tight tissue binding |
| Chloroquine | ~200-800 L | Tissues | Lysosomotropic drug |
| Amiodarone | ~5000 L | Fat and organs | Months to reach steady state |
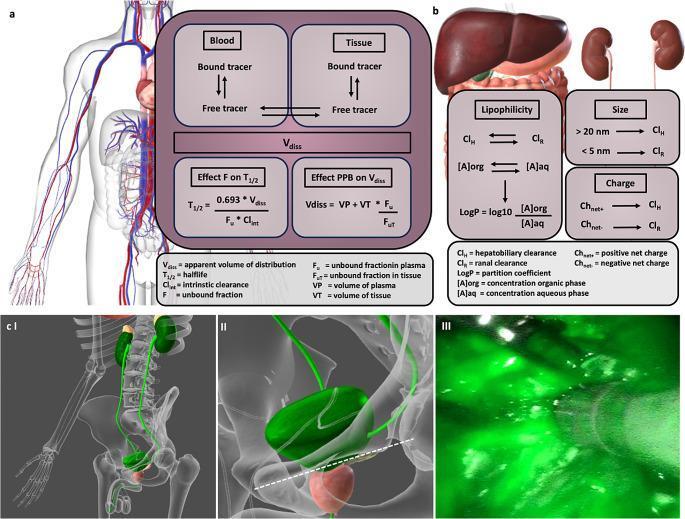
11. Multicompartment Distribution - Illustrative Diagram
Figure: The relationship between apparent volume of distribution (Vdiss), half-life (T1/2), plasma protein binding (PPB), lipophilicity, and clearance routes.
12. Summary Table
| Parameter | Description |
|---|
| Symbol | Vd (or VD) |
| Units | Litres (L) or L/kg |
| Formula | Vd = Dose / Cp₀ |
| Low Vd | Drug confined to plasma; large molecule or highly protein-bound |
| High Vd | Drug widely distributed to tissues, fat, or intracellular spaces |
| Key Relationship | t₁/2 = 0.693 × Vd / CL |
| Loading Dose | LD = Css × Vd |
| Effect of Protein Binding | More protein binding → lower Vd |
| Effect of Tissue Binding | More tissue binding → higher Vd |
| Clinical Uses | Loading dose calc, TDM, dialysis decisions, half-life prediction, dosing in special populations |
13. Conclusion
Volume of distribution is a foundational pharmacokinetic parameter that every pharmacist must understand. It is not simply an academic concept - it directly guides:
- How much loading dose to give a patient
- How long a drug stays in the body
- Whether dialysis will help in overdose
- How to dose drugs safely in special populations (obese, elderly, renally impaired)
- How protein-binding interactions affect drug behavior
Although Vd is an "apparent" or "hypothetical" volume - not a real anatomical compartment - it powerfully predicts a drug's behavior throughout the body. Drugs with a Vd larger than the total body water (~42 L) are heavily concentrated in tissues, while drugs with Vd near plasma volume (~4 L) remain largely in the bloodstream.
Mastery of Vd, combined with clearance (CL) and half-life (t₁/2), forms the backbone of rational pharmacotherapy.
References
- Katzung BG. Basic and Clinical Pharmacology, 16th Edition. McGraw-Hill. Chapter 3: Pharmacokinetics & Pharmacodynamics, pp. 77-78.
- Goldman L, Cooney KA. Goldman-Cecil Medicine, 26th Edition. Elsevier. Chapter 25: Principles of Pharmacotherapy, pp. 254-255.
- Gropper MA. Miller's Anesthesia, 10th Edition. Elsevier. Chapter 16: Pharmacokinetic Principles, pp. 1698-1703.
- Bisht S, Chauhan V, Patel P. "Clinical Significance of Volume of Distribution in Pharmacotherapy." StatPearls [Internet]. NCBI Bookshelf. Updated March 2026. Available at: ncbi.nlm.nih.gov/books/NBK545280
- Holford NHG. "Volume of Distribution." Translational and Clinical Pharmacology 2016;24(2):74-77. Available via: tcpharm.org