
Can you generate images for whichever of these, uh, questions that will be easy for me to draw during the time of exam, under one minute, and should be easy to understand also?
python3 -c " from docx import Document doc = Document('/tmp/workspace/attachments/41bbb67b-c89f-46b4-b6ab-c2d8d0864aab/CHAPTER-CVS general med compeleted.docx') for i, p in enumerate(doc.paragraphs): style = p.style.name if p.style else 'None' if p.text.strip(): print(f'[{style}] {p.text}') "
- Acute Rheumatic Fever (Jones Criteria)
- Infective Endocarditis (Duke's Criteria, peripheral signs)
- Rheumatic Valvular Heart Disease (MS, MR, AS, AR)
- Hypertension (classification, target organs)
- IHD / Angina / MI / ACS
- Arrhythmias (AV blocks, AF, VT, VF, WPW)
- Heart Failure / CCF
- Acute Ventricular Failure
- JVP waves
- ASD, VSD, PDA, Coarctation of Aorta, Tetralogy of Fallot
- Calcium Channel Blockers / Beta Blockers / Anticoagulants / Furosemide / Antihypertensives
- Heart Sounds & Murmurs
- Ludwig's Angina / Vincent's Angina / Dysphagia
- Jones Criteria - simple 2-column major/minor list
- JVP waves (a, c, v, x, y) - simple waveform sketch
- AV Block types - simple ladder diagram
- Tetralogy of Fallot - 4 components (easy to draw as labeled heart)
- Mitral Stenosis pathophysiology - simple downward flow chart
- Heart Sounds (S1-S4) - timeline diagram
- Left vs Right Heart Failure - split diagram
- Hypertension target organ damage - body outline with labels
- ASD/VSD/PDA shunt direction - simple heart box with arrow
- Coarctation of Aorta - simple aorta narrowing sketch
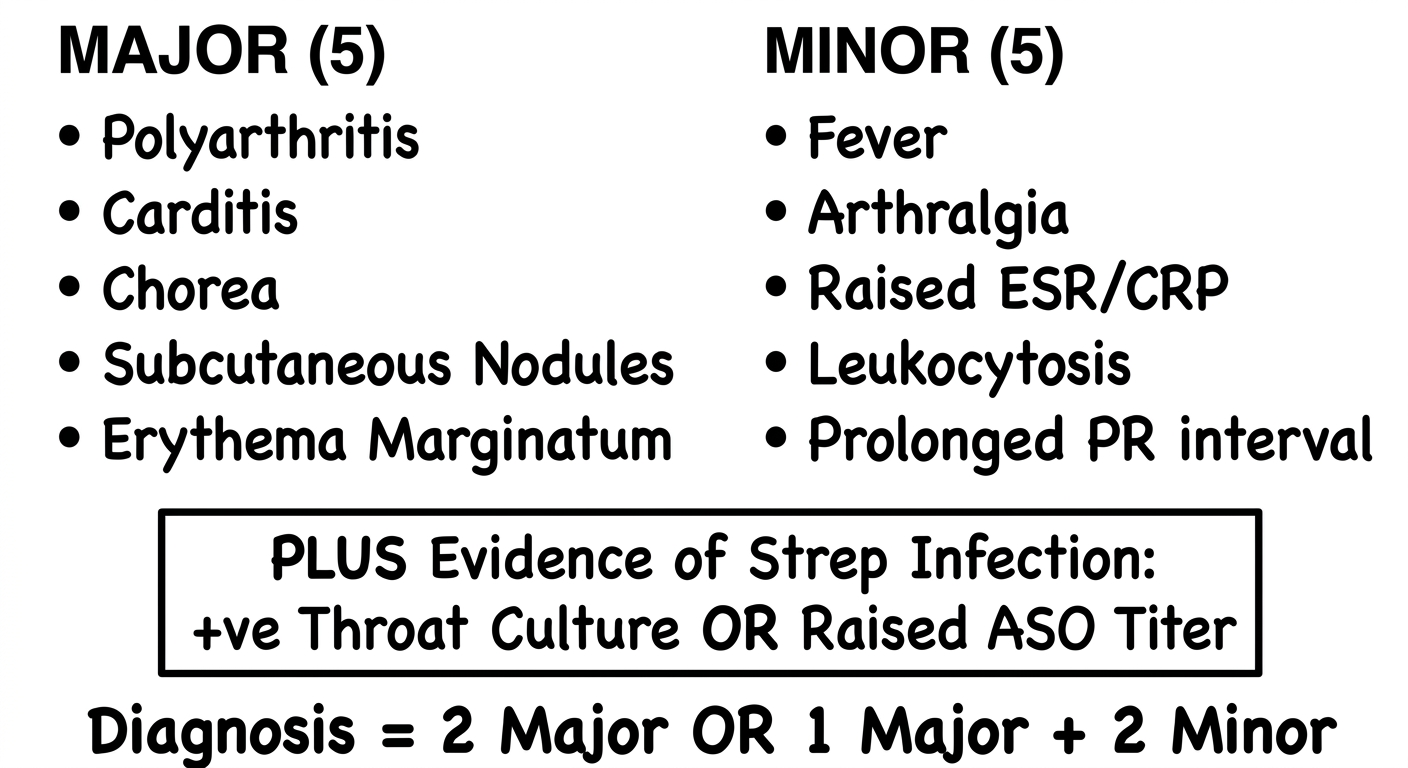
Simple clean medical exam diagram: Jones Criteria for Acute Rheumatic Fever. Two columns side by side. Left column labeled "MAJOR (5)" with bullet points: Polyarthritis, Carditis, Chorea, Subcutaneous Nodules, Erythema Marginatum. Right column labeled "MINOR (5)" with bullet points: Fever, Arthralgia, Raised ESR/CRP, Leukocytosis, Prolonged PR interval. Below both columns: a box labeled "PLUS Evidence of Strep Infection: +ve Throat Culture OR Raised ASO Titer". At bottom: "Diagnosis = 2 Major OR 1 Major + 2 Minor". Clean white background, bold headings, easy to copy in under 1 minute in an exam.
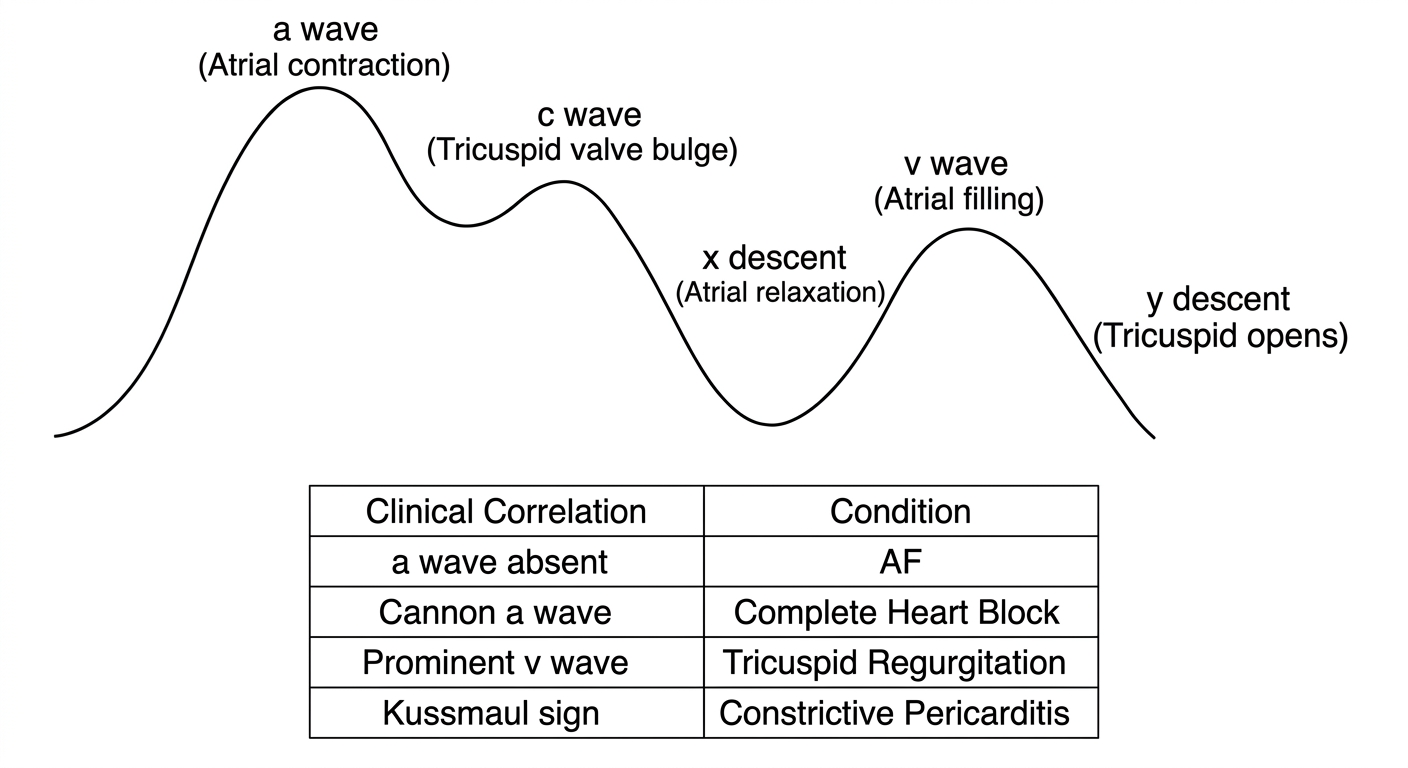
Simple clean medical exam diagram: JVP (Jugular Venous Pulse) waveform. Draw a smooth waveform with clearly labeled peaks and troughs: 'a wave' peak (Atrial contraction), 'c wave' small bump (Tricuspid valve bulge), 'v wave' peak (Atrial filling), 'x descent' (Atrial relaxation), 'y descent' (Tricuspid opens). Below the waveform, a simple legend table: a wave absent = AF, Cannon a wave = Complete Heart Block, Prominent v wave = Tricuspid Regurgitation, Kussmaul sign = Constrictive Pericarditis. White background, clean lines, easy to redraw in exam in 1 minute.
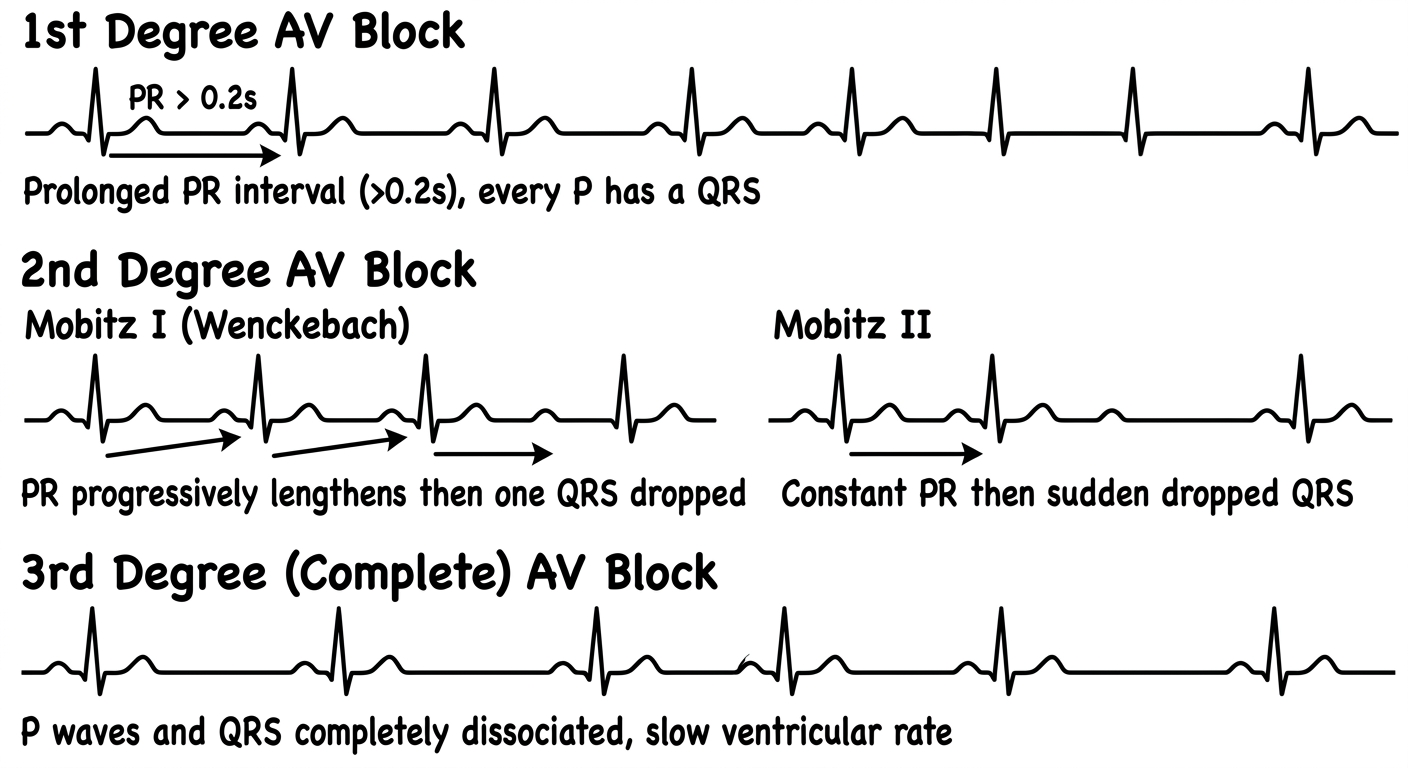
Simple clean medical exam diagram: Types of AV Block. Three rows, each with ECG strip and label. Row 1: "1st Degree AV Block - Prolonged PR interval (>0.2s), every P has a QRS". Row 2: "2nd Degree - Mobitz I (Wenckebach): PR progressively lengthens then one QRS dropped" and "Mobitz II: Constant PR then sudden dropped QRS". Row 3: "3rd Degree (Complete): P waves and QRS completely dissociated, slow ventricular rate". Simple schematic ECG lines, white background, bold labels, easy to draw in exam.
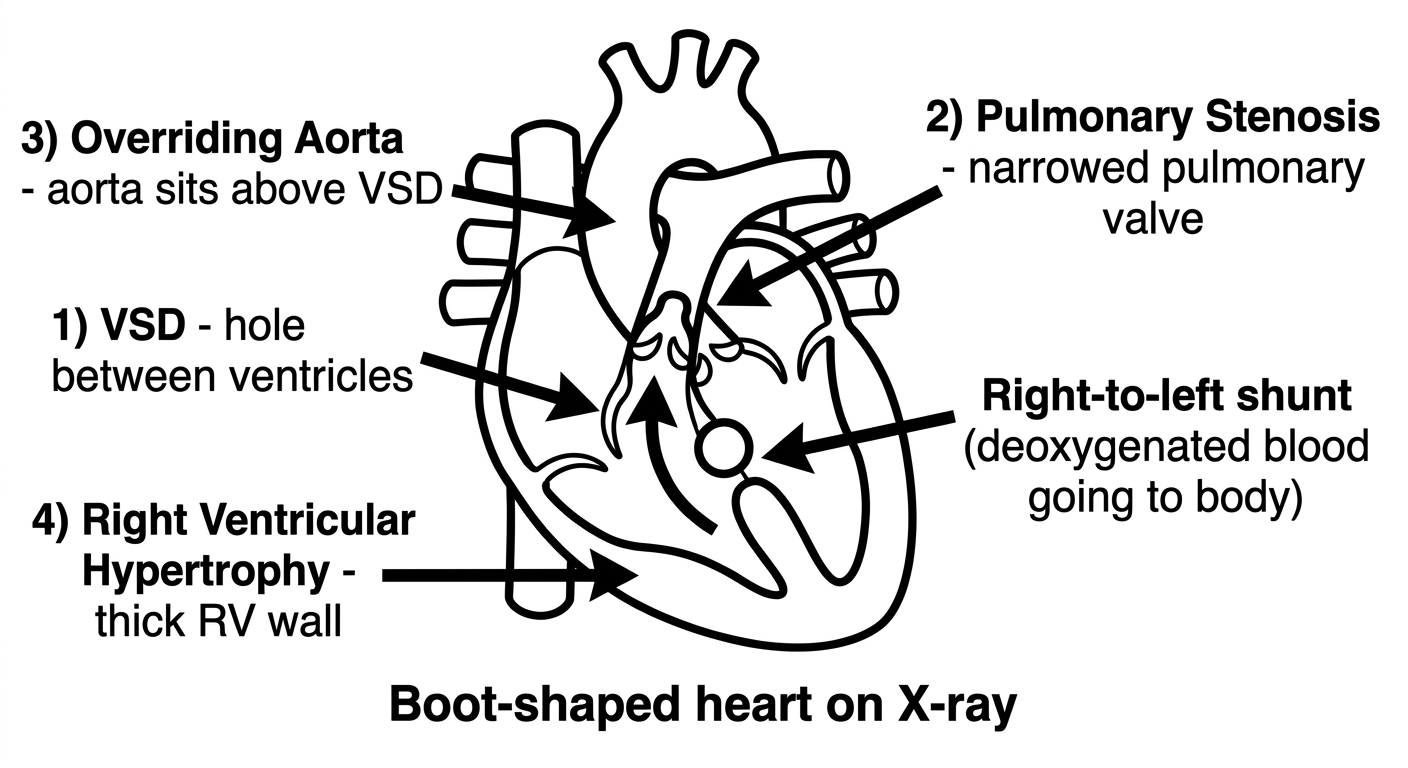
Simple clean medical exam diagram: Tetralogy of Fallot - the 4 defects. Draw a simple schematic heart outline. Label four arrows pointing to the heart: 1) VSD - hole between ventricles, 2) Pulmonary Stenosis - narrowed pulmonary valve, 3) Overriding Aorta - aorta sits above VSD, 4) Right Ventricular Hypertrophy - thick RV wall. Arrow showing right-to-left shunt (deoxygenated blood going to body). At bottom: "Boot-shaped heart on X-ray". White background, bold numbered labels, very easy to redraw in 1 minute.
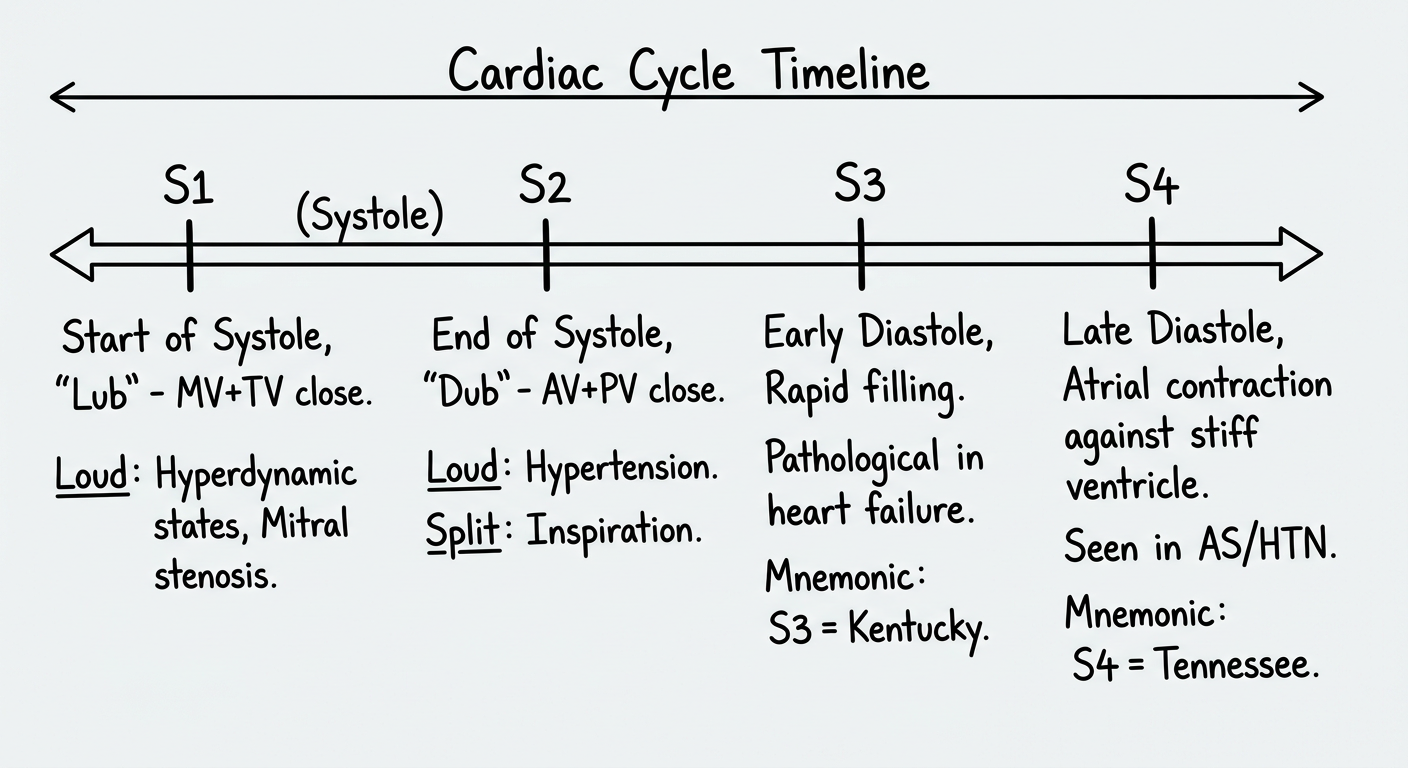
Simple clean medical exam diagram: Heart Sounds S1 S2 S3 S4 on a timeline. Draw a horizontal cardiac cycle timeline bar. Mark: S1 (start of systole, "Lub" - MV+TV close), then a gap (systole), then S2 (end of systole, "Dub" - AV+PV close), then S3 (early diastole, rapid filling, pathological in heart failure), then S4 (late diastole, atrial contraction against stiff ventricle, seen in AS/HTN). Below each sound: when it is loud or abnormal. Mnemonic: S3 = Kentucky, S4 = Tennessee. White background, clean timeline, easy to draw in exam.
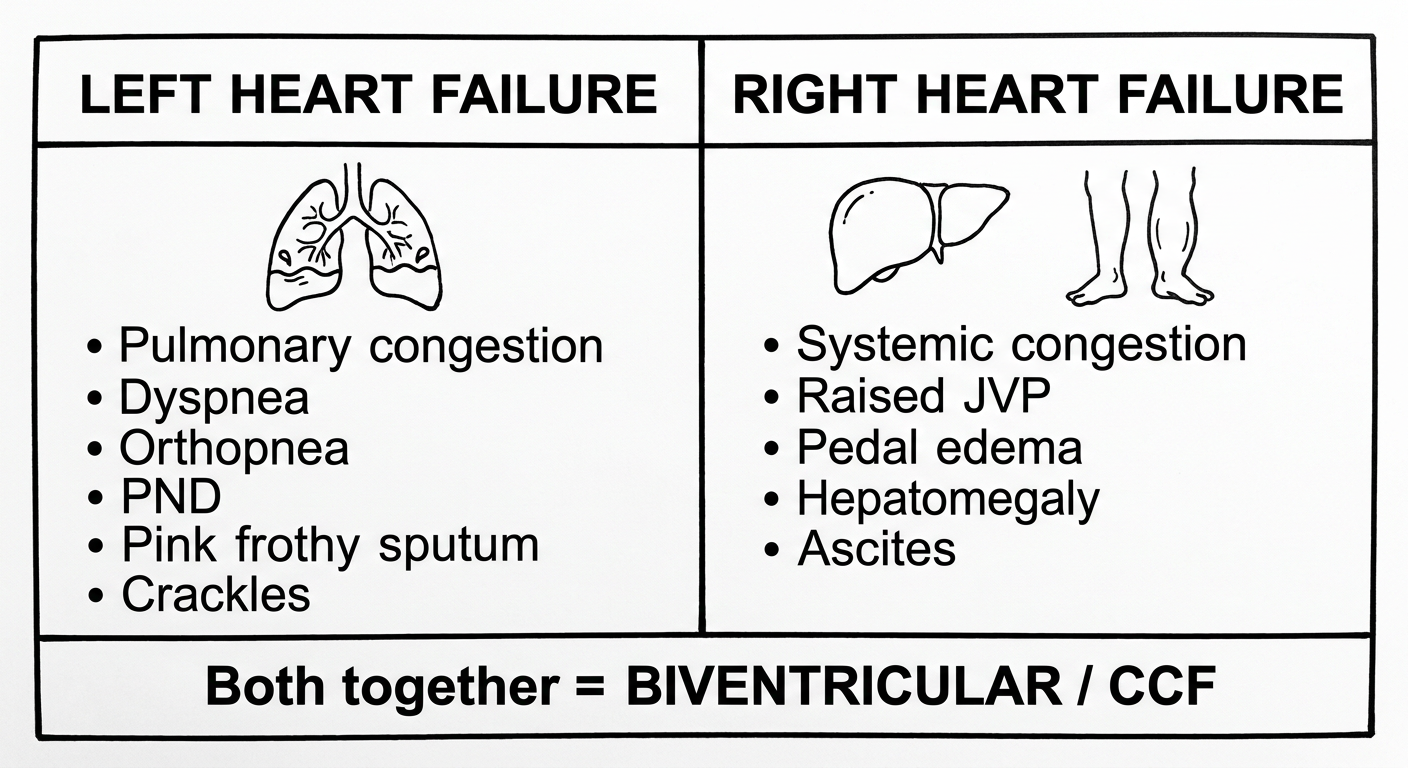
Simple clean medical exam diagram: Left Heart Failure vs Right Heart Failure comparison. Draw two columns with a clear divider. Left column "LEFT HEART FAILURE": Pulmonary congestion, Dyspnea, Orthopnea, PND, Pink frothy sputum, Crackles. Right column "RIGHT HEART FAILURE": Systemic congestion, Raised JVP, Pedal edema, Hepatomegaly, Ascites. Below both columns a shared box: "Both together = BIVENTRICULAR / CCF". Simple icons (lungs on left, liver/legs on right). White background, bold headers, easy to draw in exam.
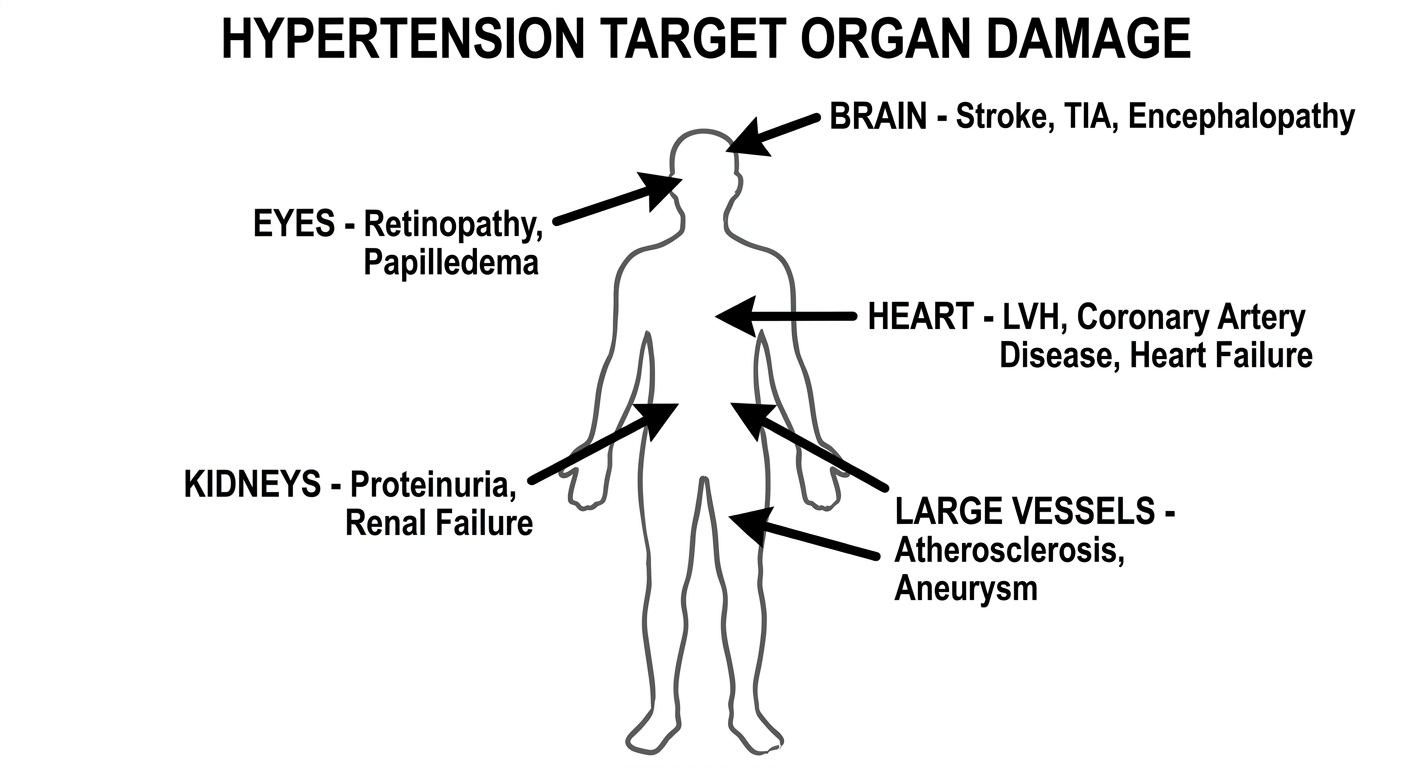
Simple clean medical exam diagram: Hypertension Target Organ Damage. Draw a simple human body silhouette outline. Draw arrows pointing to: Brain (top) - Stroke, TIA, Encephalopathy. Eyes - Retinopathy, Papilledema. Heart (center) - LVH, Coronary Artery Disease, Heart Failure. Kidneys (both sides) - Proteinuria, Renal Failure. Large Vessels - Atherosclerosis, Aneurysm. Each label is bold and clear. White background, minimal but clear body outline, very easy to sketch in 1 minute during exam.
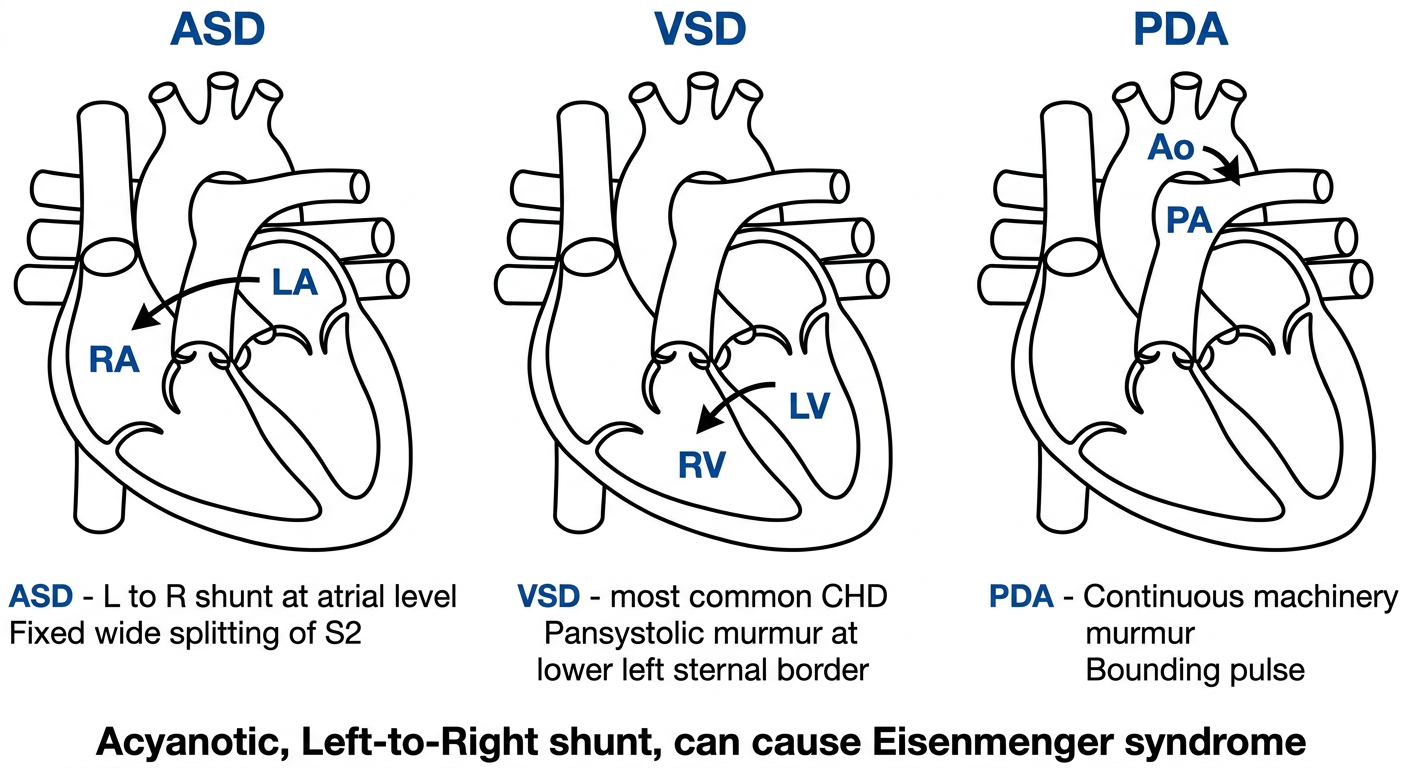
Simple clean medical exam diagram comparing ASD vs VSD vs PDA. Three side-by-side heart schematics. Heart 1 (ASD): Arrow crossing atrial septum from left to right atrium, labeled "ASD - L to R shunt at atrial level, Fixed wide splitting of S2". Heart 2 (VSD): Arrow crossing ventricular septum from left to right ventricle, labeled "VSD - most common CHD, Pansystolic murmur at lower left sternal border". Heart 3 (PDA): Arrow between Aorta and Pulmonary Artery, labeled "PDA - Continuous machinery murmur, Bounding pulse". All three: "Acyanotic, Left-to-Right shunt, can cause Eisenmenger syndrome". White background, simple outlines, bold labels.
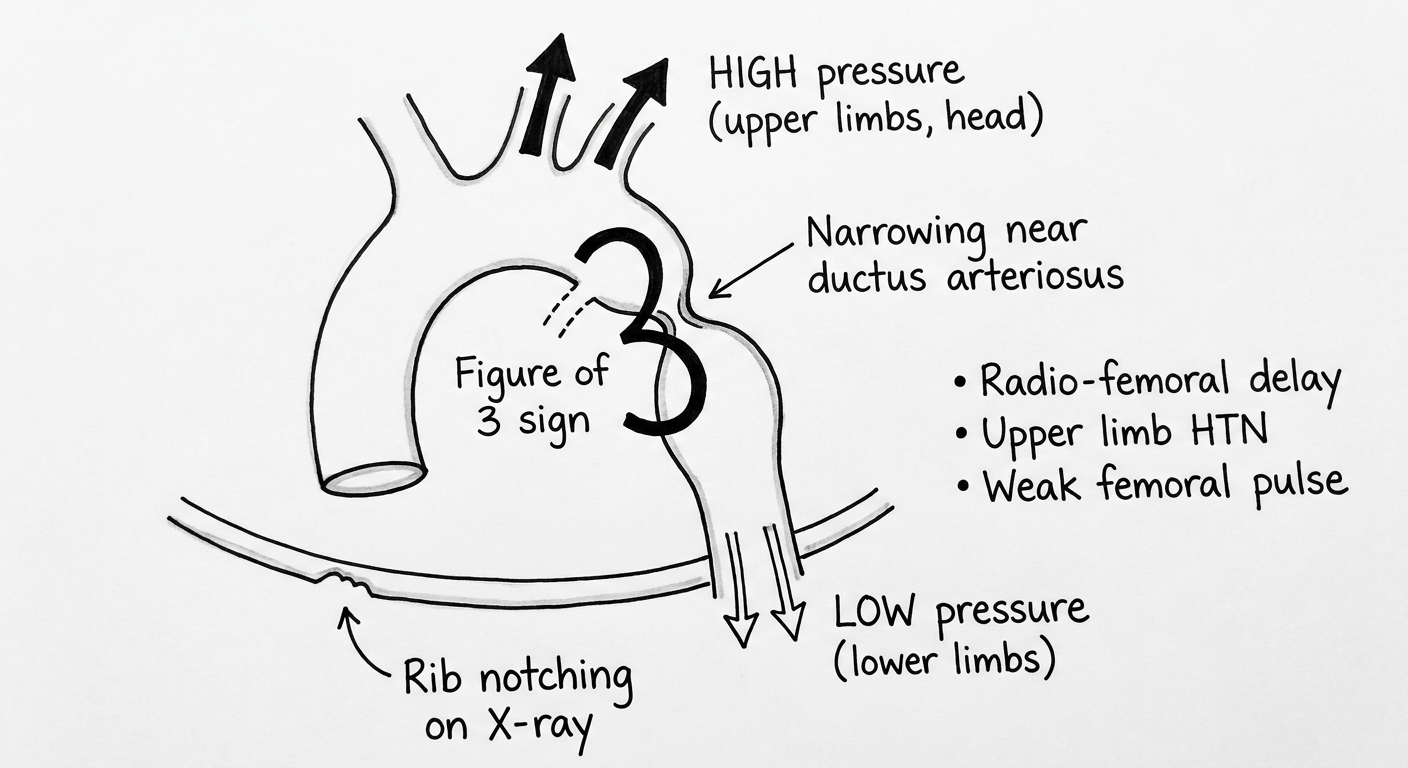
Simple clean medical exam diagram: Coarctation of Aorta. Draw a simple aortic arch outline showing a narrowing (pinch) just after the ductus arteriosus. Label: "Narrowing near ductus arteriosus". Draw arrows showing HIGH pressure above the narrowing (upper limbs, head) and LOW pressure below (lower limbs). Label: "Radio-femoral delay, Upper limb HTN, Weak femoral pulse". Draw a simple rib with notching labeled "Rib notching on X-ray". Draw a "figure of 3 sign" on the aorta shape. White background, clean simple lines, easy to reproduce in exam in under 1 minute.
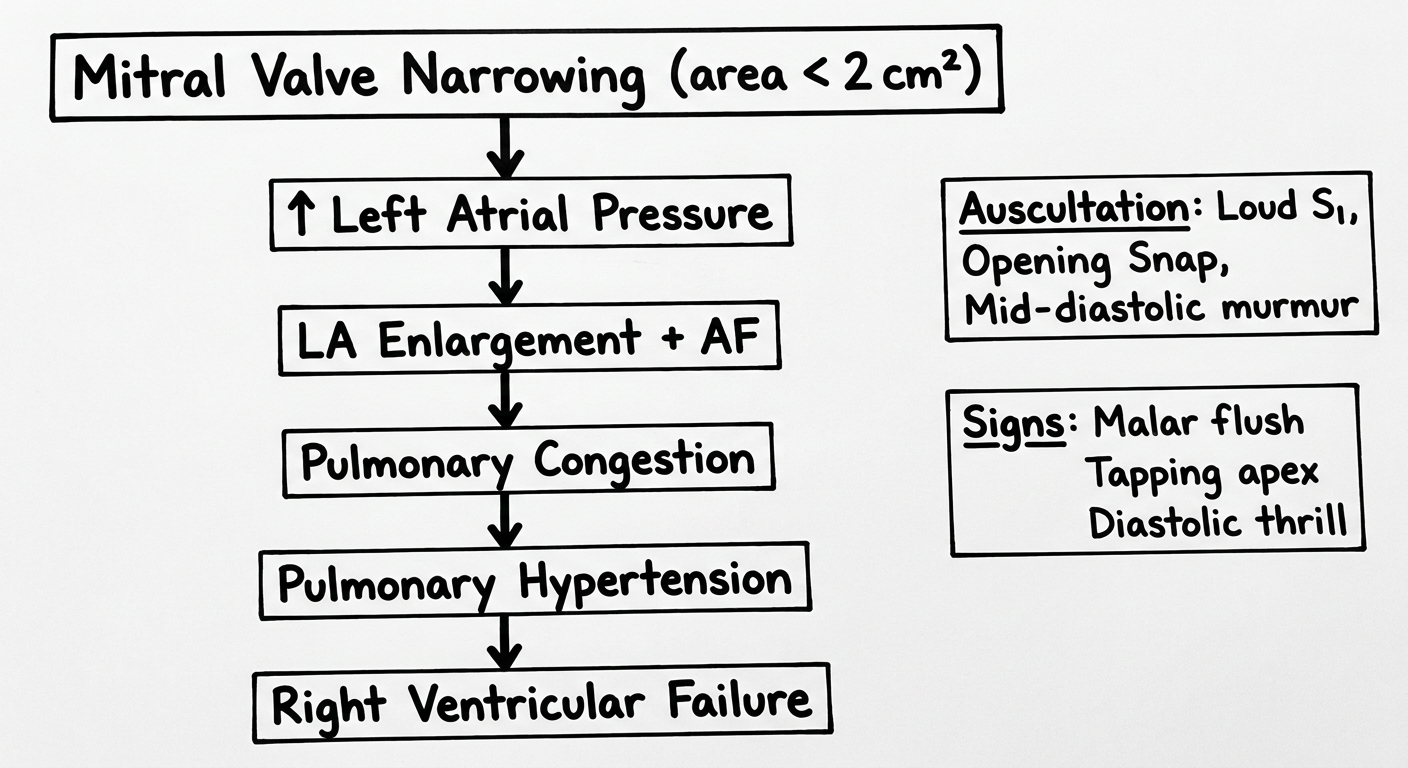
Simple clean medical exam diagram: Mitral Stenosis Pathophysiology cascade flowchart. Top-down flow with boxes and arrows: "Mitral Valve Narrowing (area < 2 cm²)" → "↑ Left Atrial Pressure" → "LA Enlargement + AF" → "Pulmonary Congestion" → "Pulmonary Hypertension" → "Right Ventricular Failure". On the side, two small note boxes: "Auscultation: Loud S1, Opening Snap, Mid-diastolic murmur" and "Signs: Malar flush, Tapping apex, Diastolic thrill". White background, vertical flow arrows, bold text, very easy to draw in 1 minute in an exam.
1. Jones Criteria (Acute Rheumatic Fever)
2. JVP Waveform (a, c, v waves + x, y descents)
3. AV Block Types (1st, 2nd, 3rd Degree)
4. Tetralogy of Fallot (4 Components)
5. Heart Sounds S1-S4 Timeline
6. Left vs Right Heart Failure Comparison
7. Hypertension Target Organ Damage
8. ASD vs VSD vs PDA Comparison
9. Coarctation of Aorta
10. Mitral Stenosis Pathophysiology Flow
Topics I left out (too complex or text-heavy for a 1-min sketch):
- Duke's Criteria for IE - too many bullets, better written than drawn
- Anti-arrhythmic drug classification (Vaughan Williams) - table format, not diagram-friendly
- Antihypertensive drug details - text-heavy
- Ludwig's/Vincent's angina - mostly clinical, no diagram advantage
- Dysphagia - text-based management
i dont want flow charts i want visual sketches diagrams colourful diagrams under one minute
Colourful hand-drawn sketch style medical diagram of the heart showing Tetralogy of Fallot. Draw a realistic but simple cartoon heart with 4 colour-coded labels with arrows: 1) RED arrow pointing to a hole between ventricles = "VSD", 2) BLUE arrow pointing to narrowed pulmonary valve = "Pulmonary Stenosis", 3) ORANGE arrow pointing to aorta sitting over the hole = "Overriding Aorta", 4) GREEN arrow pointing to thick right ventricular wall = "RVH". Show blue deoxygenated blood mixing with red oxygenated blood going to the body. In the corner: a simple boot-shaped heart silhouette labeled "Boot-shaped heart on X-ray". Bright colours, sketch/illustration style, no flowcharts, no text boxes.
Colourful hand-drawn sketch style medical diagram comparing ASD, VSD and PDA side by side. Draw three simple cartoon hearts next to each other. Heart 1 (ASD): blue arrow crossing through a hole in the atrial wall from left atrium to right atrium, labeled "ASD". Heart 2 (VSD): blue arrow crossing through hole in ventricular wall from left to right ventricle, labeled "VSD - most common CHD". Heart 3 (PDA): show aorta and pulmonary artery connected by a vessel with blood flowing from aorta to pulmonary artery, labeled "PDA - machinery murmur". Each heart a different background colour tint. All have a small arrow labeled "L→R shunt". Bright colours, sketch illustration style, no text-only boxes.
Colourful hand-drawn sketch medical diagram of the human body showing Hypertension Target Organ Damage. Draw a simple human body outline (front view). Colour each affected organ differently: BRAIN (purple) with label "Stroke, TIA, Encephalopathy". EYES (blue) with label "Retinopathy, Papilledema". HEART (red) with label "LVH, Heart Failure, CAD". KIDNEYS (orange, both sides) with label "Proteinuria, Renal Failure". LARGE VESSELS/AORTA (green) with label "Atherosclerosis, Aneurysm". Bold coloured arrows pointing to each organ. Bright illustrative sketch style, not a flowchart.
Colourful hand-drawn sketch medical diagram of the heart showing Mitral Stenosis vs Mitral Regurgitation side by side. Left heart (Mitral Stenosis): show a thickened, fused, narrowed mitral valve between left atrium and left ventricle, draw an enlarged purple left atrium above it, label "Loud S1, Opening Snap, Mid-diastolic murmur, Malar flush". Right heart (Mitral Regurgitation): show an incompetent mitral valve with blood leaking backward from LV to LA during systole with a red backflow arrow, draw enlarged left atrium and left ventricle, label "Soft S1, Pansystolic murmur". Bright colours, anatomical sketch style, colourful labels.
Colourful hand-drawn sketch medical diagram of Coarctation of Aorta. Draw the aortic arch and descending aorta with a visible narrowing (pinch) just after the ductus arteriosus. Above the narrowing: red blood vessels going to arms and head labeled "High BP, Strong pulse in upper limbs". Below the narrowing: pale blue vessels going to legs labeled "Low BP, Weak femoral pulse, Cold legs". Show collateral vessels (intercostal arteries) drawn around the narrowing as small winding vessels. On the ribs beside the aorta, show wavy rib notching labeled "Rib notching on X-ray". Show the aortic shape making a "3" shape labeled "Figure of 3 sign". Bright anatomical colours, sketch style.
Error calling model 'gemini-3-pro-image' (RESOURCE_EXHAUSTED): 429 RESOURCE_EXHAUSTED. {'error': {'code': 429, 'message': 'Resource has been exhausted (e.g. check quota).', 'status': 'RESOURCE_EXHAUSTED'}}
We encountered an error while processing your request. Please try again or reach out to us for help.
give
An error occurred (ValidationException) when calling the ConverseStream operation: Expected toolResult blocks at messages.16.content for the following Ids: tooluse_cAR6Pl4YioDaqjNi8RGk4w
We encountered an error while processing your request. Please try again or reach out to us for help.