
Morphology of bacteria
bacterial morphology shapes cocci bacilli spirilla arrangement
structure of a bacterial cell diagram capsule flagella pili plasmid
Gram-positive and Gram-negative bacteria cell wall
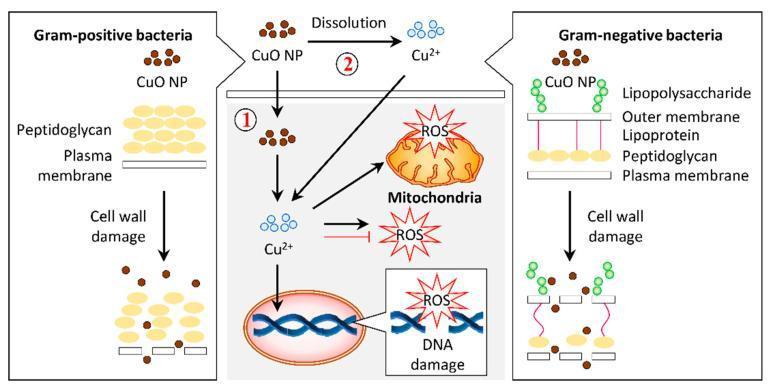
A pathophysiology diagram illustrating the antibacterial mechanisms of copper oxide nanoparticles (CuO NPs) on Gram-positive and Gram-negative bacteria. The left panel shows Gram-positive bacteria with a thick peptidoglycan layer above a plasma membrane. The right panel shows Gram-negative bacteria with a complex cell wall including lipopolysaccharides, an outer membrane, lipoproteins, and a thin peptidoglycan layer. Both panels demonstrate CuO NPs causing cell wall damage and lysis. The central panel details the intracellular bactericidal pathway labeled as mechanism 1 and 2. Mechanism 1 involves the internalization of CuO NPs into the cytosol, while mechanism 2 illustrates the dissolution of CuO NPs into copper ions (Cu2+) which then permeate the cell. Inside the cell, both Cu2+ ions and CuO NPs induce the production of reactive oxygen species (ROS). The resulting oxidative stress leads to mitochondrial disruption and DNA damage, ultimately resulting in cell death. This infographic highlights the role of nanoparticle morphology and ion release in targeting bacterial structural and metabolic integrity.
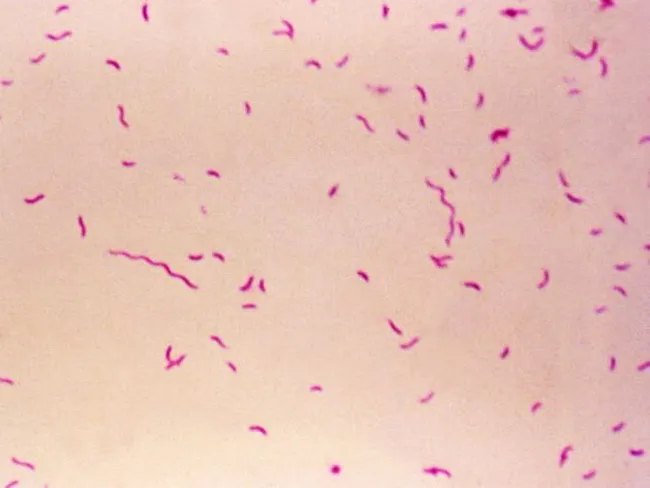
Bright-field light microscopy of a Gram-stained bacterial smear reveals numerous small, slender, curved Gram-negative rods with a characteristic gull-wing appearance consistent with Campylobacter species. The image captures bacteria oriented individually and in small clusters against a pale pink counterstain, illustrating Bacillary morphology typical of enteric pathogens. Gram staining shows purple/blue rods (crystal violet retained by cell wall) with a light pink background from the counterstain (safranin), enabling discrimination from Gram-positive organisms. The organisms appear slender and curved, with a single polar flagellum suggested by motility or alignment in the smear. Specimen type is a bacterial smear obtained from a gastrointestinal sample (feces or culture isolate), prepared for diagnostic microbiology. The imaging modality is bright-field microscopy at high magnification (approximately 1000x with oil immersion), following Gram staining to highlight bacterial cell wall structure. Clinically, detection of Campylobacter species supports infectious gastroenteritis; in the IPSID (immunoproliferative small intestinal disease) context, Campylobacter involvement has been proposed as a pathogenic trigger mirroring Helicobacter pylori's role in gastric MALT lymphoma. Differential diagnoses include Helicobacter, Vibrio, and other curved Gram-negative bacteria. This image serves educational and diagnostic utility for microbiology, clinical pathology, gastroenterology, and infectious disease research.
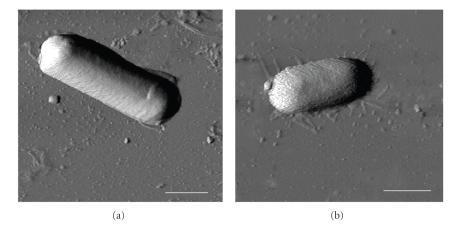
This diagnostic imaging set displays Atomic Force Microscopy (AFM) phase images of two distinct bacterial species, Bacillus cereus (a) and Escherichia coli (b), deposited on a mica surface. The images facilitate a morphological comparison between Gram-positive and Gram-negative bacteria at the nanometer scale. Panel (a) shows B. cereus as a distinctly elongated, rod-shaped cell with a relatively uniform, smooth surface texture and well-defined edges. In contrast, panel (b) depicts E. coli with a more compact, oval or capsule-shaped morphology. The E. coli cell exhibits a significantly rougher surface topography with visible granularity compared to the smoother envelope of B. cereus. The background depicts the mica substrate with faint thread-like structures visible around the E. coli cell, likely representing extracellular filaments or surface dehydration artifacts. A 1 μm scale bar is provided in both panels. These images are used in microbiology to study bacterial cell wall structural integrity, surface roughness (Rq), and biophysical responses to environmental conditions like relative humidity (RH).
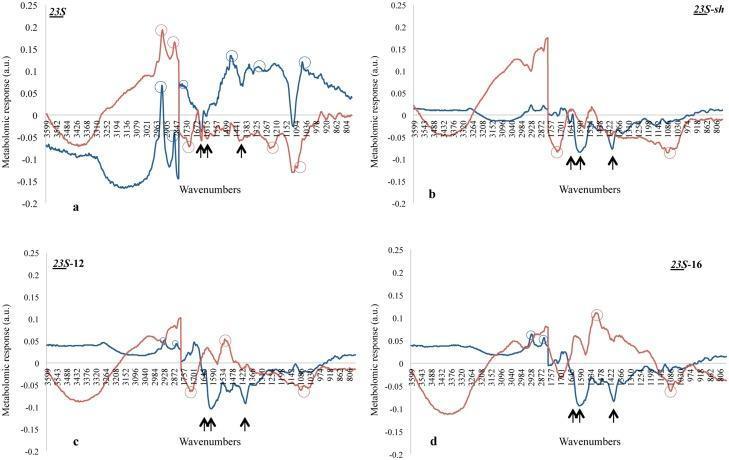
This Comparison Chart displays four panels (a, b, c, d) of Fourier-transform infrared (FTIR) response spectra, illustrating the metabolomic stress response of Escherichia coli (red curves) and Listeria innocua (blue curves) to four different surfactants: 23S, 23S-sh, 23S-12, and 23S-16. The y-axis represents the metabolomic response in arbitrary units (a.u.), and the x-axis indicates wavenumbers from approximately 3600 to 800 cm⁻¹. Panel (a) shows significant peaks in fatty acid regions (2920–2852 cm⁻¹) and lipid esters (1741 cm⁻¹) for 23S, suggesting high biocidal efficacy. Black arrows across all panels denote peptidoglycan-related wavenumbers (approximately 1657, 1600, and 1400 cm⁻¹), frequently appearing as negative peaks that indicate cell wall degradation. Open circles highlight major species-specific response peaks. These diagrams serve as an educational tool for microbiology and pharmacology, demonstrating how different molecular surfactant structures selectively stress the cell envelopes of Gram-negative (E. coli) versus Gram-positive (L. innocua) bacteria based on infrared spectroscopic signatures.
"bacterial morphology" OR "bacterial cell shape"
Gram stain cocci in clusters chains bacilli microscopy
Morphology of Bacteria
1. Size
- Bacteria range from 0.1 to 10 μm in their largest dimension. The largest described can reach 300 μm. Most are about 1 μm, so they are visible by light microscopy, whose resolution is about 0.2 μm. The smallest, Chlamydia and Rickettsia, are 0.1 to 0.2 μm. (Sherris & Ryan's Medical Microbiology, 8e, p. 807; Medical Microbiology 9e, p. 138)
2. Shape
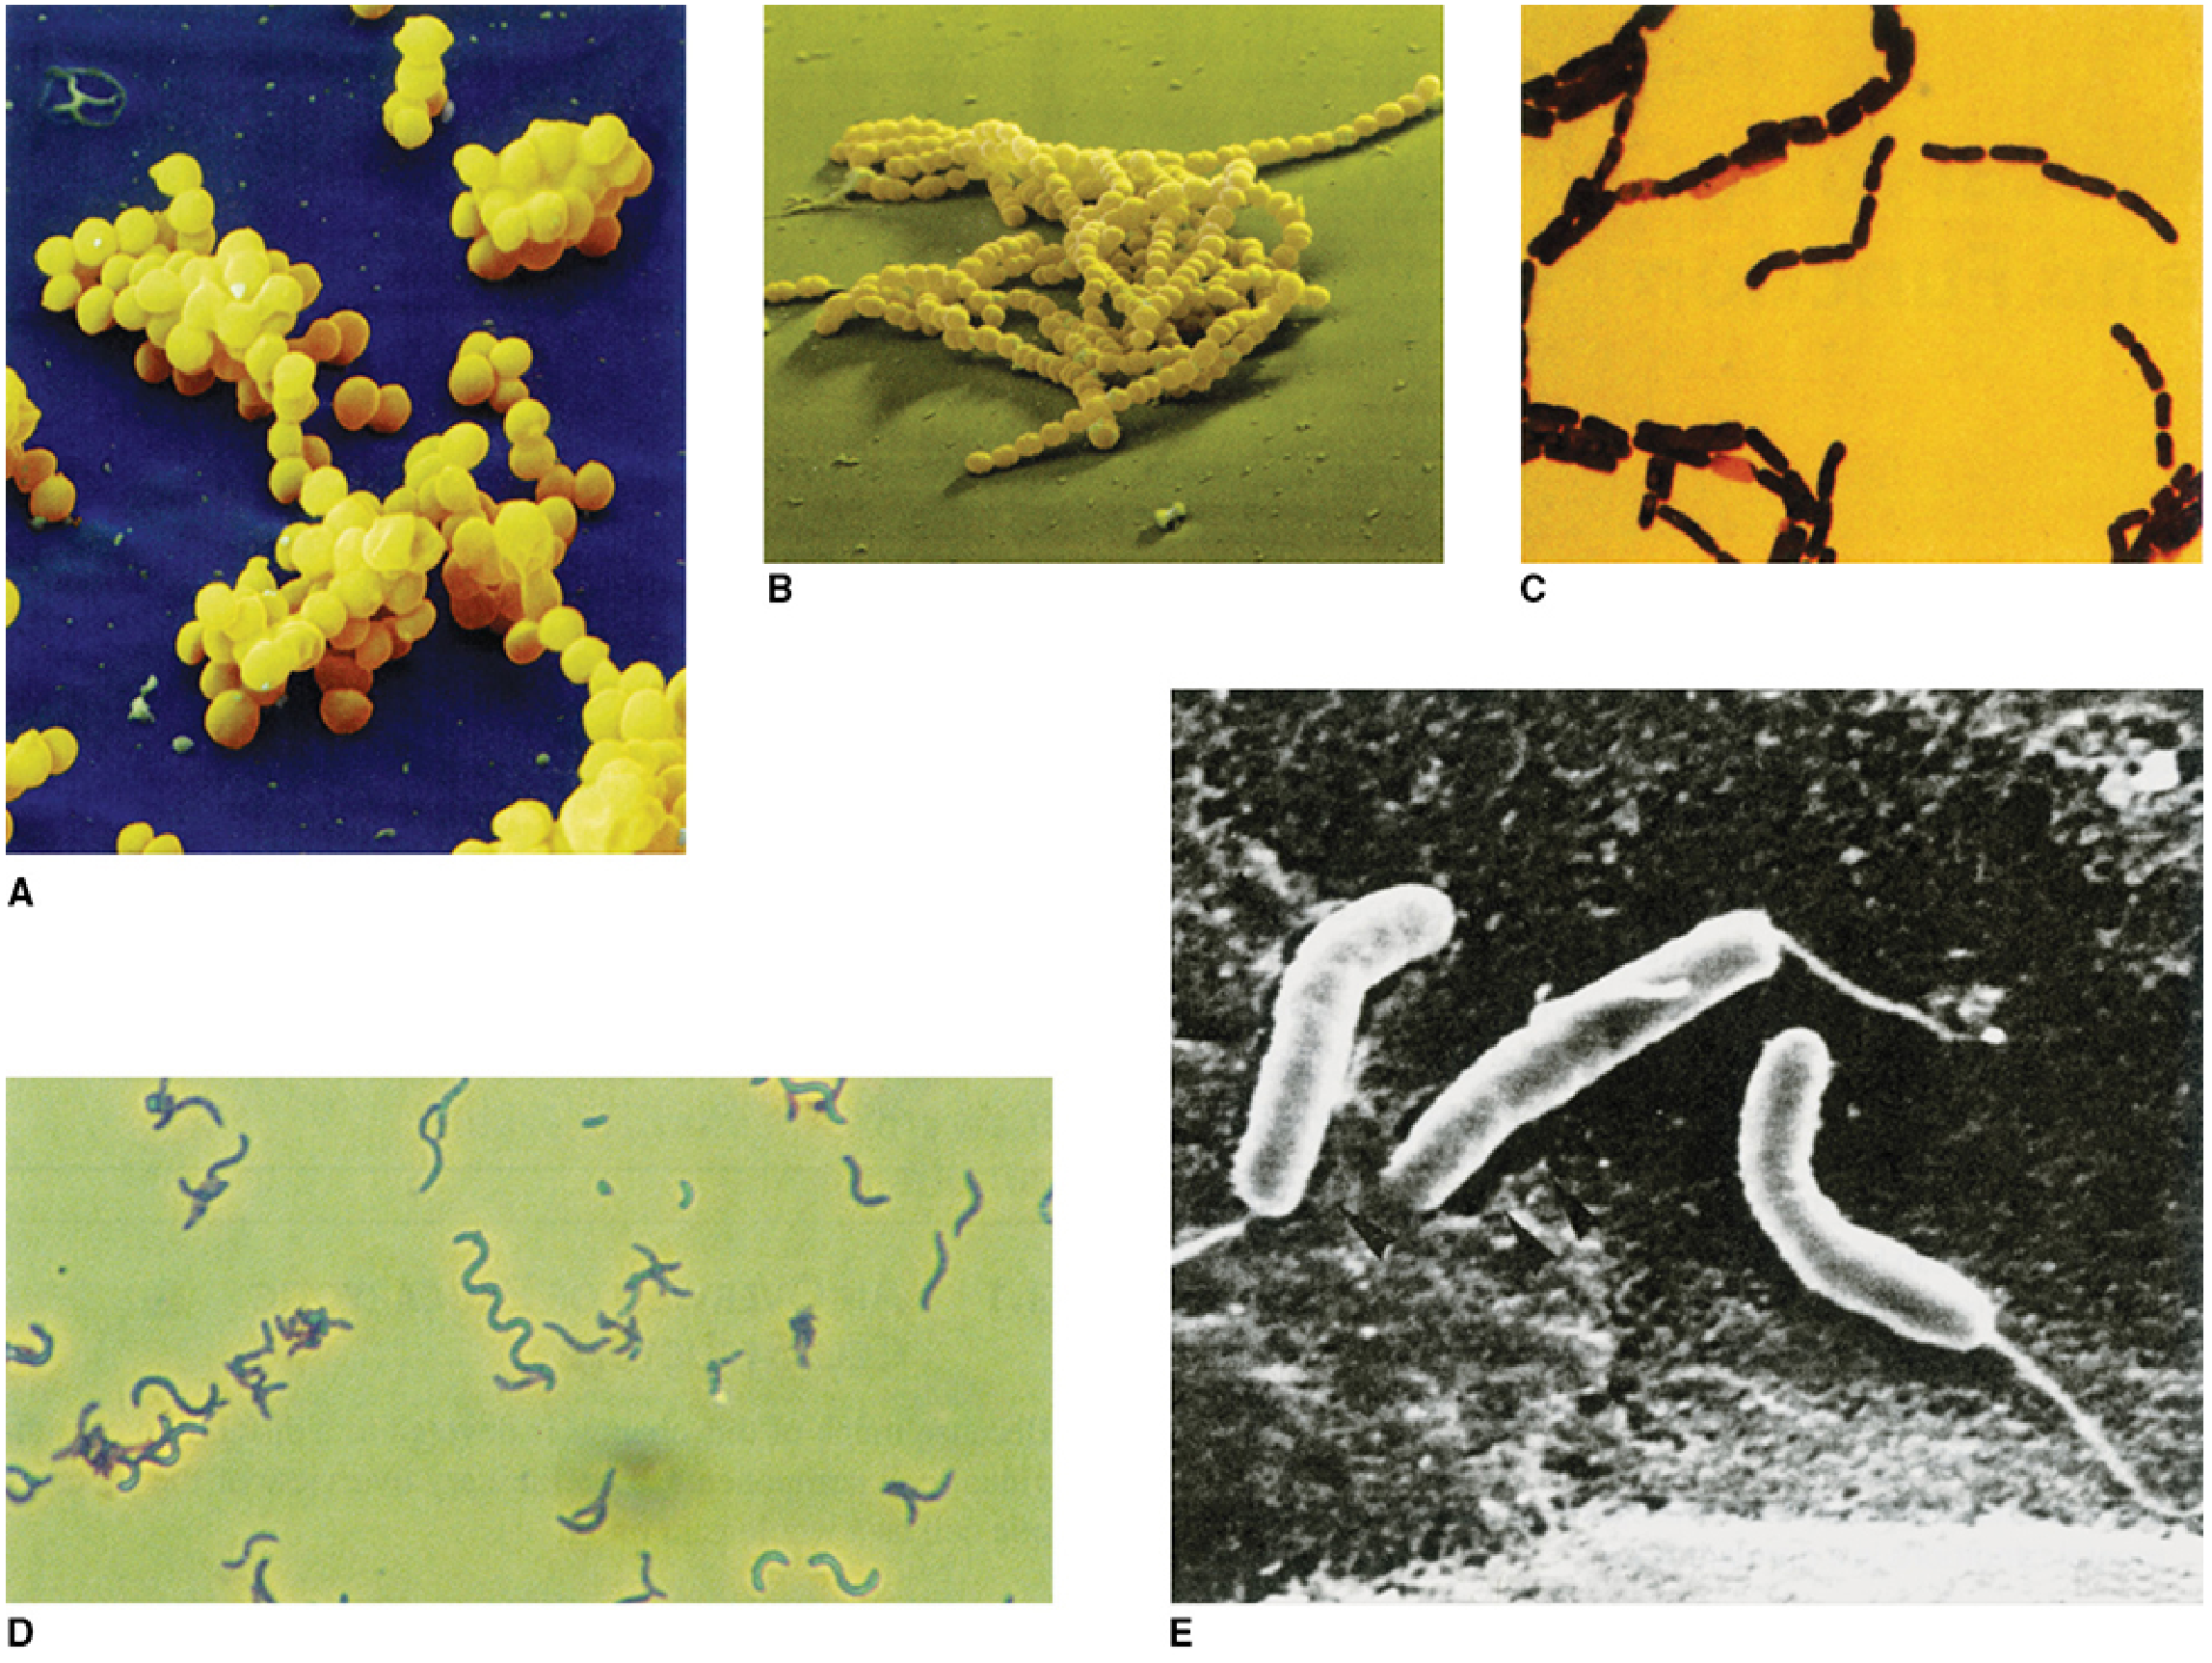
| Shape | Term | Examples |
|---|---|---|
| Spherical or oval | Cocci | Staphylococcus, Streptococcus |
| Rod | Bacilli (straight or curved) | E. coli, Bacillus |
| Short, pleomorphic rod resembling a coccus | Coccobacilli | Haemophilus, Brucella |
| Comma-shaped or curved rod | Vibrios | Vibrio cholerae |
| Rigid spiral | Spirilla | Spirillum |
| Flexible, undulating spiral | Spirochetes | Treponema, Borrelia, Leptospira |
| Branching filaments | Filamentous forms | Nocardia, Actinomyces (look like fungi) |
3. Arrangement
- Pairs (diplococci): S. pneumoniae, Neisseria.
- Chains: Streptococcus pyogenes.
- Grape-like clusters: Staphylococcus aureus.
- Tetrads and sarcinae (packets of 8): Micrococcus, Sarcina. This is from my own knowledge, not the retrieved text.
- Rods: these may lie as single cells, as chains (Bacillus, "bamboo stick" appearance in anthrax), as palisades or "Chinese letters" (Corynebacterium), or as streptobacilli.
4. Structure of the bacterial cell
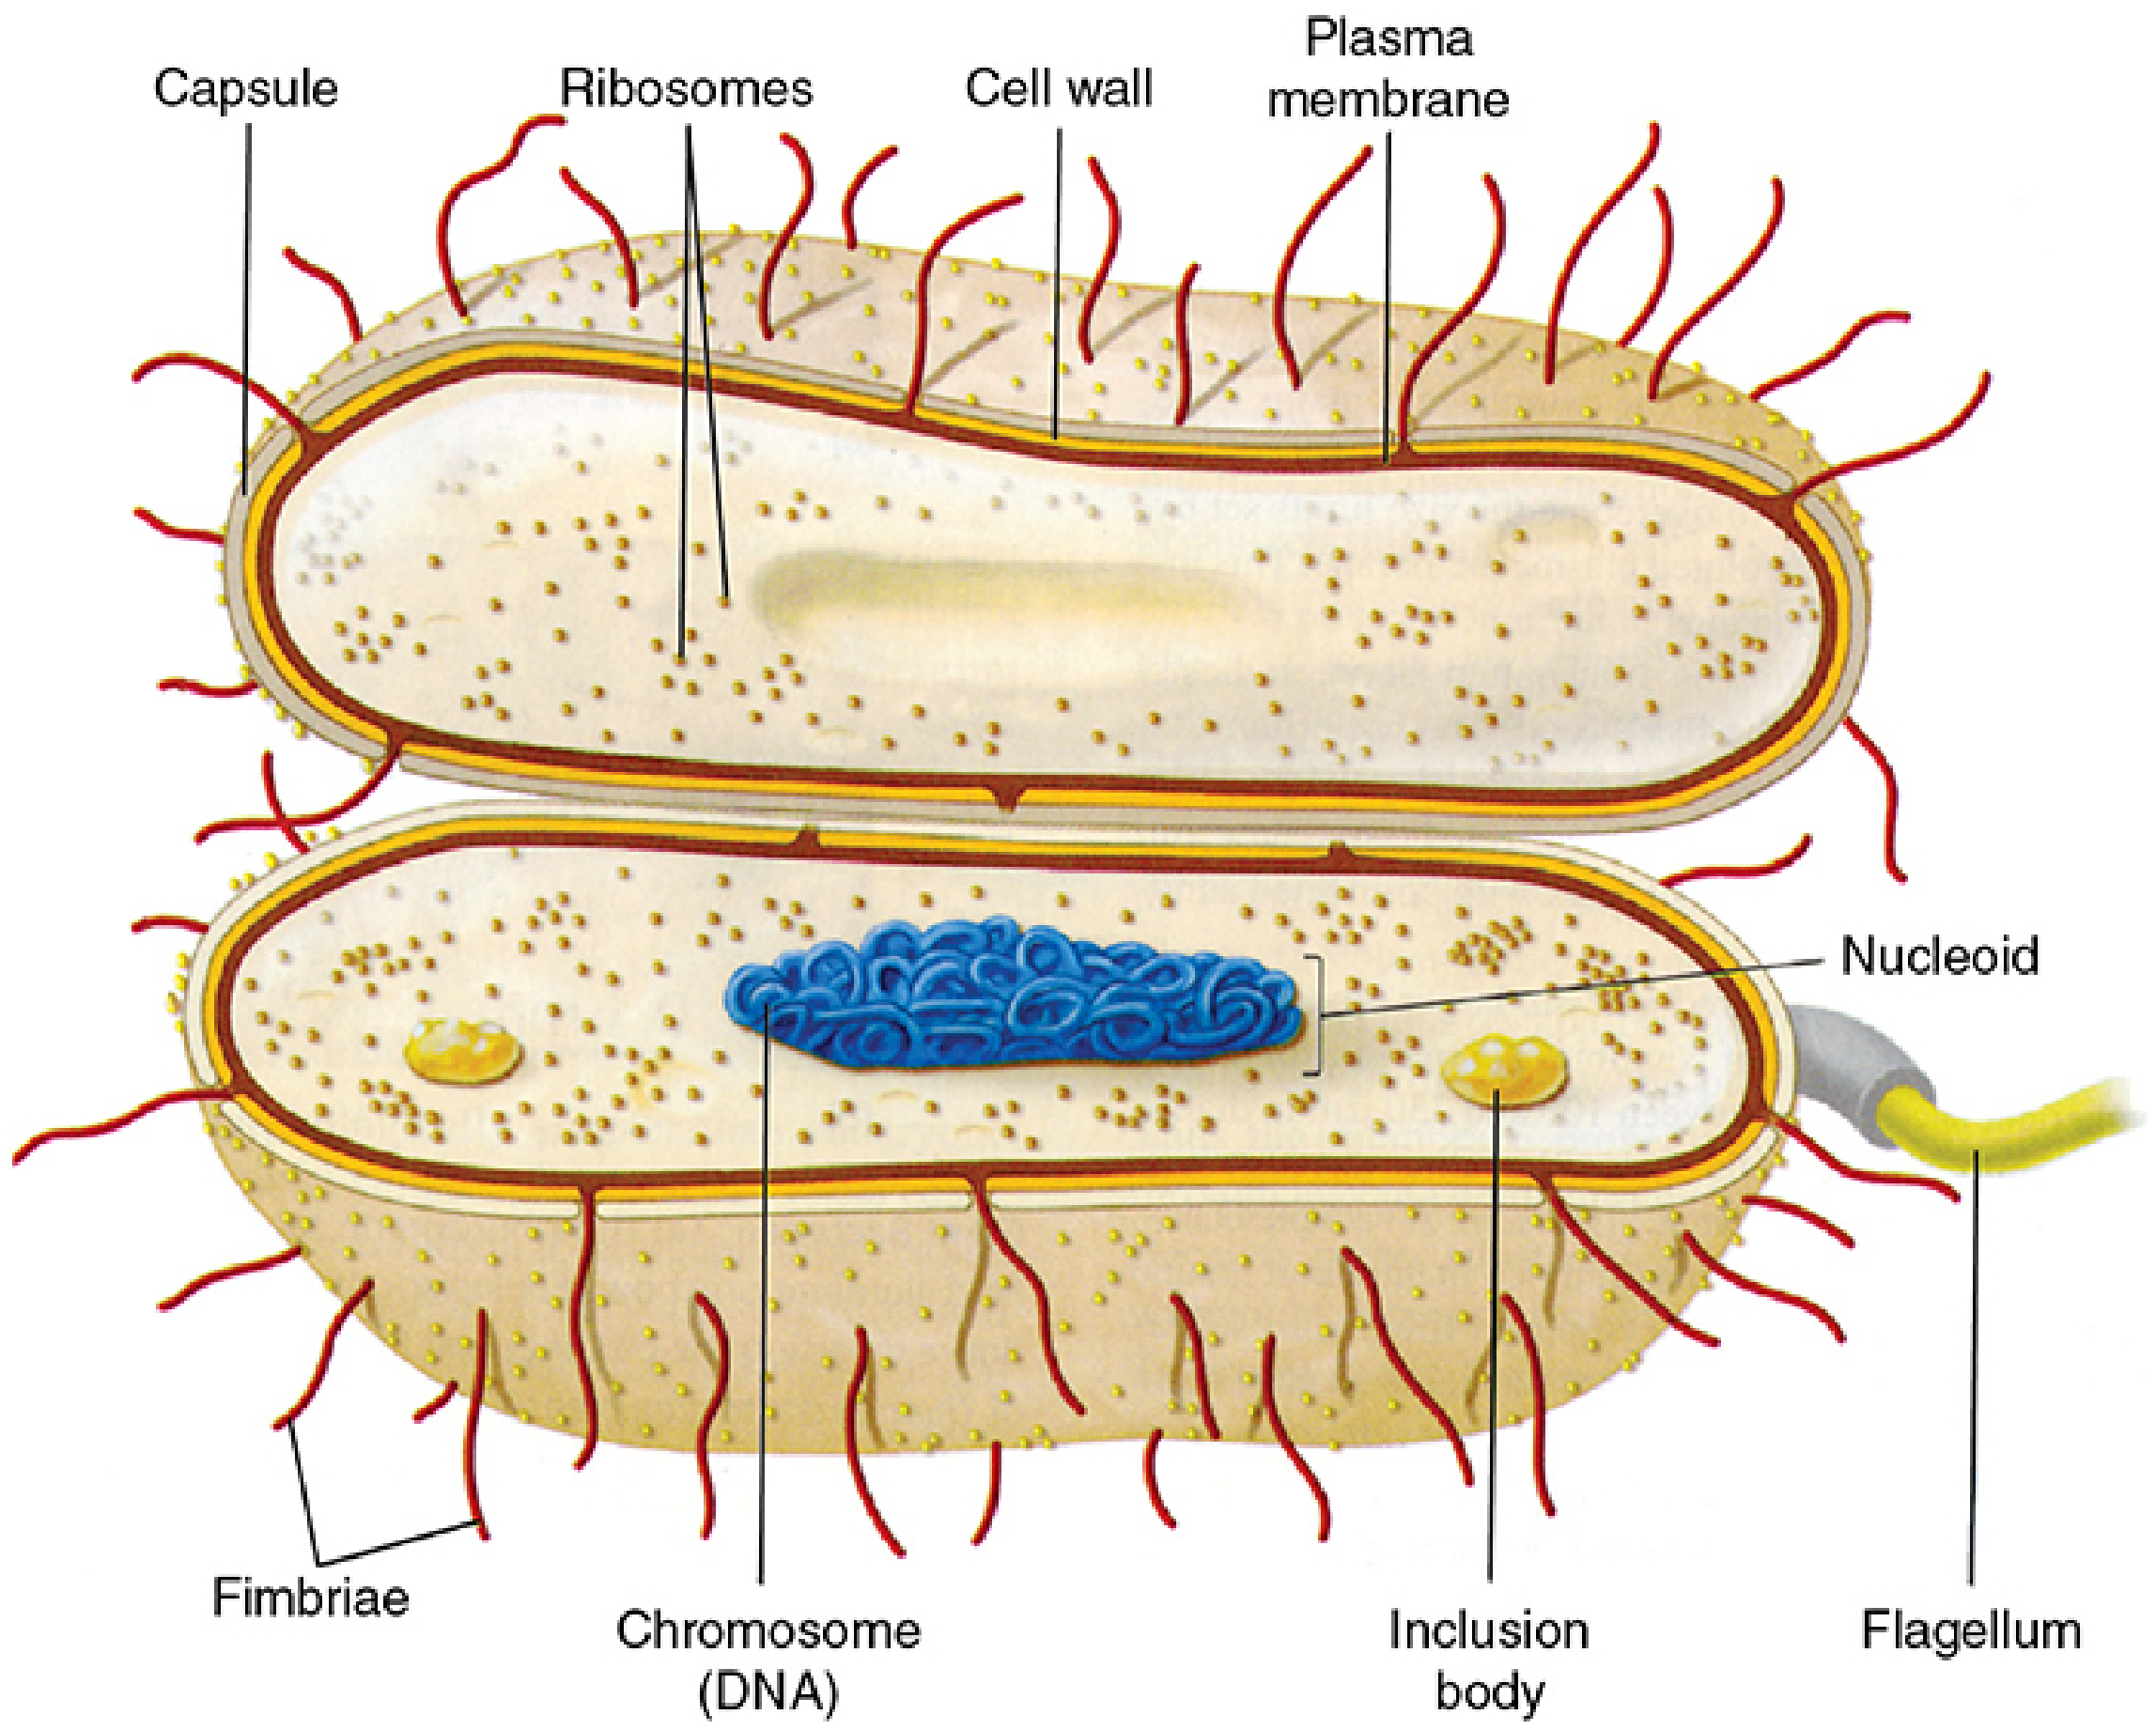
- Capsule or slime layer: polysaccharide or polypeptide. It is antiphagocytic and a virulence factor.
- Cell wall: peptidoglycan, with the following differences between Gram-positive and Gram-negative bacteria.
- Gram-positive bacteria have a thick peptidoglycan layer plus teichoic acid.
- Gram-negative bacteria have a thin peptidoglycan layer, a periplasmic space, and an outer membrane containing lipopolysaccharide (endotoxin).
- Cytoplasmic membrane: phospholipid and protein. It contains no sterols, except in Mycoplasma.
- Flagella: flagellin protein. They give motility, and the arrangement can be monotrichous, lophotrichous, amphitrichous or peritrichous.
- Pili (fimbriae): pilin protein. They mediate attachment to host cells, and the sex pilus mediates conjugation.
- Nucleoid: a single circular double-stranded DNA chromosome with no nuclear membrane. In E. coli it is about 5 million base pairs and about 1.3 mm long.
- Cytoplasm: 70S ribosomes (50S + 30S) and inclusion granules. There are no mitochondria, Golgi apparatus or endoplasmic reticulum.
- Plasmids: extrachromosomal DNA, often carrying antibiotic resistance.
- Endospores: formed by Bacillus and Clostridium. They are highly resistant dormant forms.
5. Staining and its link to morphology
- Gram stain: crystal violet, then iodine, then an acetone-based decolorizer, then safranin. Gram-positive cells trap crystal violet in the thick peptidoglycan and stay purple. Gram-negative cells lose the stain and appear red or pink. The mnemonic is "P-PURPLE-POSITIVE." The stain is unreliable in old or stationary-phase cultures.
- Acid-fast stain (Ziehl-Neelsen): used for mycobacteria, whose cell walls contain mycolic acid.
- Other methods: dark-field or phase contrast for spirochetes, and special stains for capsule (India ink), spores and flagella.
6. Prokaryote vs eukaryote
| Feature | Prokaryote | Eukaryote |
|---|---|---|
| Size | 0.5 to 3 μm | >5 μm |
| Nucleus | No membrane, single circular chromosome | Membrane-bound, diploid |
| Ribosomes | 70S | 80S |
| Organelles | Absent | Present |
| Cell wall | Peptidoglycan | Absent in animal cells; present in fungi and plants |