

Anaylyse this ecg carefully. Negative P wave inf leads. I see epsilon waves
ARVC arrhythmogenic right ventricular cardiomyopathy epsilon wave ECG
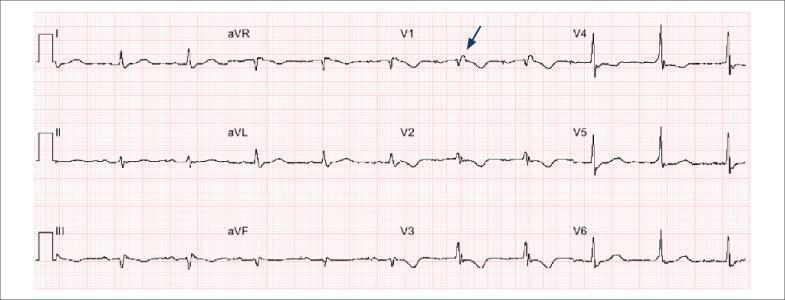
This diagnostic image is a 12-lead electrocardiogram (ECG) demonstrating key diagnostic features of Arrhythmogenic Right Ventricular Cardiomyopathy (ARVC). The tracing shows a normal sinus rhythm with low voltage in the frontal plane leads (I, II, III, aVR, aVL, aVF). A pathognomonic 'epsilon wave' is identified by a blue arrow in lead V1, appearing as a small, low-amplitude notch or positive deflection at the end of the QRS complex and the beginning of the ST segment. Significant repolarization abnormalities are present, specifically deep T-wave inversions across the right precordial leads (V1, V2, and V3). These findings, particularly the combination of terminal notch depolarization (epsilon wave) and precordial T-wave inversion, serve as major diagnostic criteria for ARVC. The educational focus of the image is to illustrate ECG manifestations of right ventricular disease and structural heart conditions associated with sudden cardiac arrest.
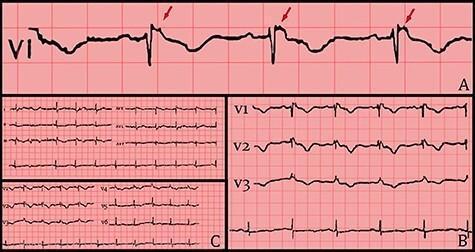
This diagnostic image contains three panels of electrocardiogram (ECG) tracings illustrating the electrical manifestations of Arrhythmogenic Right Ventricular Cardiomyopathy (ARVC). Panel A provides a high-magnification view of lead V1, where red arrows indicate the hallmark Epsilon wave—a low-amplitude notch or 'blip' occurring at the end of the QRS complex and the start of the ST segment. Panel B displays precordial leads V1 through V3, demonstrating a right bundle branch block (RBBB) morphology characterized by widened QRS complexes and persistent T-wave inversions. Panel C presents a standard 12-lead ECG overview following hemodynamic stabilization. The collection emphasizes key diagnostic criteria including repolarization abnormalities (T-wave inversion in V1-V3) and depolarization abnormalities (Epsilon waves). These visual findings are critical for medical students and clinicians in identifying structural right ventricular disease and assessing sudden cardiac death risk.
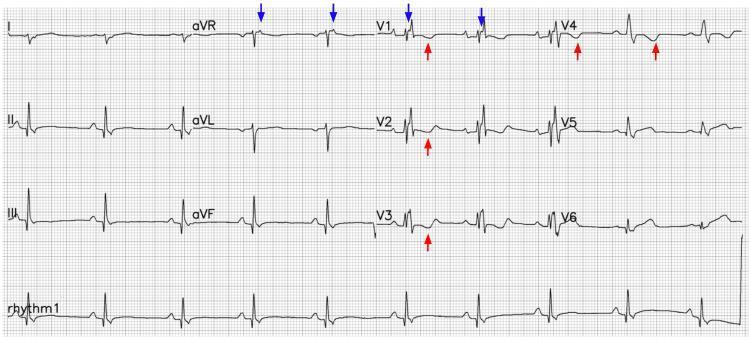
A 12-lead electrocardiogram (ECG) demonstrating key diagnostic features of Arrhythmogenic Right Ventricular Cardiomyopathy (ARVC). The tracing shows a sinus rhythm with a widened QRS complex and a morphology consistent with a Right Bundle Branch Block (RBBB). Blue arrows indicate the presence of Epsilon waves, characterized by low-amplitude positive deflections at the terminal end of the QRS complex, specifically visible in leads aVR and V1. Red arrows highlight deep, symmetrical T-wave inversions (TWI) across the precordial leads V1 through V4. These findings represent classic depolarization and repolarization abnormalities associated with ARVC. The image serves as a high-yield educational resource for cardiology and emergency medicine, illustrating the specific ECG criteria used for the diagnosis of right ventricular structural heart disease and the assessment of sudden cardiac death (SCD) risk factors in young adults.
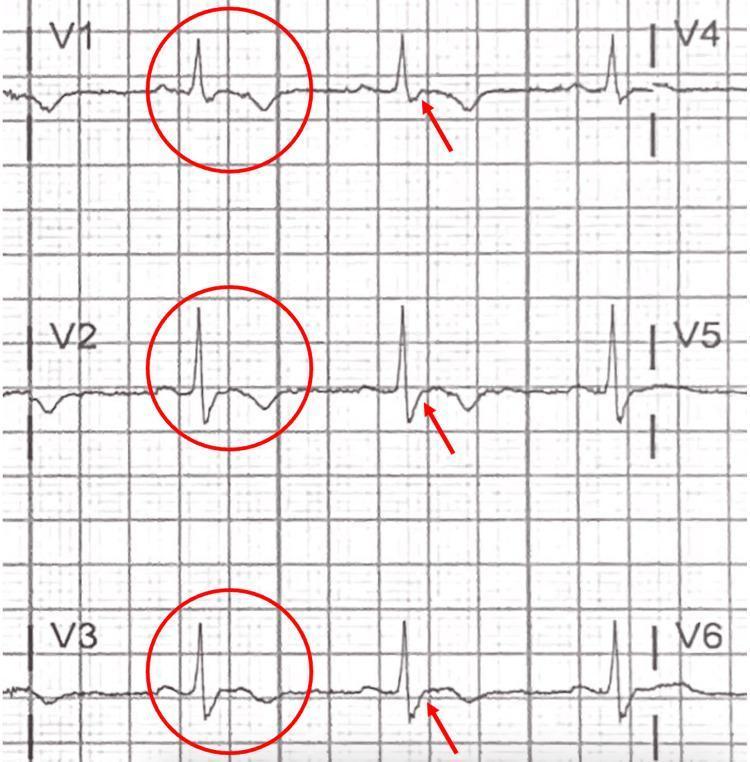
This diagnostic image displays a focused 12-lead electrocardiogram (ECG) tracing specifically highlighting the precordial leads V1 through V6. The visual focuses on the right precordial leads (V1, V2, and V3), which are marked with red circles and arrows to indicate diagnostic abnormalities. Key morphological features include prominent T-wave inversions in leads V1-V3, while the lateral leads V4-V6 show upright T-waves. A critical finding is the presence of an 'epsilon wave,' identified as a small positive deflection or notch at the terminal end of the QRS complex, occurring between the end of the S-wave and the start of the T-wave. These electrocardiographic signs—T-wave inversion in right precordial leads beyond V1 and the presence of epsilon waves—are highly characteristic of Arrhythmogenic Right Ventricular Cardiomyopathy (ARVC). This image serves as a clinical teaching tool for identifying subtle depolarization and repolarization abnormalities associated with fibrofatty replacement of the right ventricular myocardium.
ECG Analysis - Arrhythmogenic Right Ventricular Cardiomyopathy (ARVC)
Rate & Rhythm
- Rate: ~60-75 bpm (normal rate)
- Rhythm: Sinus rhythm - but with an important caveat (see P wave analysis below)
P Wave Analysis - The "Negative P in Inferior Leads" Finding
- Negative P waves inferiorly suggest low atrial or junctional rhythm - the impulse is depolarizing the atria in a retrograde (foot-to-head) direction rather than the normal top-down direction
- In ARVC patients, this can represent a low right atrial ectopic pacemaker or coronary sinus rhythm, which itself may reflect structural/electrical remodeling of the right atrium - a recognized feature of advanced ARVC
- Alternatively, if PR interval is very short, it may represent a junctional rhythm with retrograde P waves
- In ARVC specifically, right atrial involvement and atrial arrhythmias (including atrial flutter/fibrillation) are documented complications of the disease as it progresses
Epsilon Waves (Your Key Observation)
- These are small, low-amplitude notch-like deflections at the terminal end of the QRS complex, just before (or blending into) the ST segment
- They represent delayed, fractionated depolarization of residual viable cardiomyocytes within the fibrofatty replaced right ventricular free wall
- Seen in ~30% of ARVC patients - their presence is a Major Criterion under the 2010 Task Force Criteria
Complete ECG Finding Summary
| Feature | Observation | ARVC Criterion |
|---|---|---|
| Epsilon waves | Present in V1-V3 / aVR | Major |
| T-wave inversions V1-V3 | Deep, symmetric inversions across right precordial leads | Major (in absence of RBBB) |
| QRS prolongation / S-wave upstroke | Widened terminal QRS in V1-V3 (>110 ms) | Minor |
| RBBB-like morphology | Partial RBBB pattern (broad S waves in lateral leads) | Supports RV delay |
| Negative P waves inferiorly | Low atrial/junctional pacemaker or ectopic atrial rhythm | Suggests atrial involvement |
| Low voltage | Reduced QRS amplitude in frontal leads | Consistent with fibrofatty replacement |
| T-wave inversions V4-V5 | Extension beyond V3 | Major (if V4 or beyond) |
Reference ECG Images
Diagnosis: ARVC - Meets Multiple Major Criteria
- Epsilon waves in right precordial leads (V1-V3)
- T-wave inversions in V1-V3 (in a patient >14 years, without complete RBBB)
Clinical Implications
- Sudden cardiac death risk is significant - ARVC is one of the leading causes of SCD in young athletes
- The negative P waves inferiorly raise concern for concomitant right atrial remodeling/disease, which portends a more advanced disease state
- Patients are at risk for sustained monomorphic VT with LBBB morphology (RV origin) and inferior axis
- ICD implantation is recommended for high-risk patients (Harrison's Principles, 22E)
- Avoid vigorous exercise - physical activity accelerates disease progression and arrhythmia risk
- Workup should include: cardiac MRI (late gadolinium enhancement of RV free wall), echocardiography (RV dysfunction/dilation), signal-averaged ECG, Holter monitoring, and genetic testing (desmosomal protein mutations - most commonly plakophilin-2)
- Family screening is mandatory (autosomal dominant, ~50% familial transmission)
Differential Diagnoses to Exclude
| Condition | Distinguishing Features |
|---|---|
| Brugada syndrome | Coved ST elevation V1-V3 (not T-wave inversions), no epsilon waves |
| RV outflow tract VT (idiopathic) | Normal sinus ECG between episodes, no structural changes |
| Cardiac sarcoidosis | Similar epsilon waves and T-wave inversions but often with AV block; different MRI pattern |
| Dilated cardiomyopathy | Biventricular involvement, different distribution |