Cardiac cycle
Reading File
Finding Sources
Finding Sources
Reading File
Reading File
Reading File
Loading Image
Loading Image
Reading File
Loading Image
Reading File
I now have comprehensive content and excellent diagrams. Let me compile the full answer.
The Cardiac Cycle
The cardiac cycle comprises all the electrical and mechanical events that occur from the beginning of one heartbeat to the beginning of the next. At a resting heart rate of 72 beats/min, one complete cycle lasts approximately 0.83 seconds. It is initiated by spontaneous depolarization of the sinoatrial (SA) node in the right atrium, which spreads through the atria, delays at the AV node (>0.1 s), then activates the ventricles via the His-Purkinje system. This delay allows the atria to prime the ventricles before ventricular contraction begins.
The Wiggers Diagram
The classic representation of the cardiac cycle plots, simultaneously over time: left ventricular pressure, aortic pressure, left atrial pressure, ventricular volume, the ECG, venous pulse, and heart sounds.
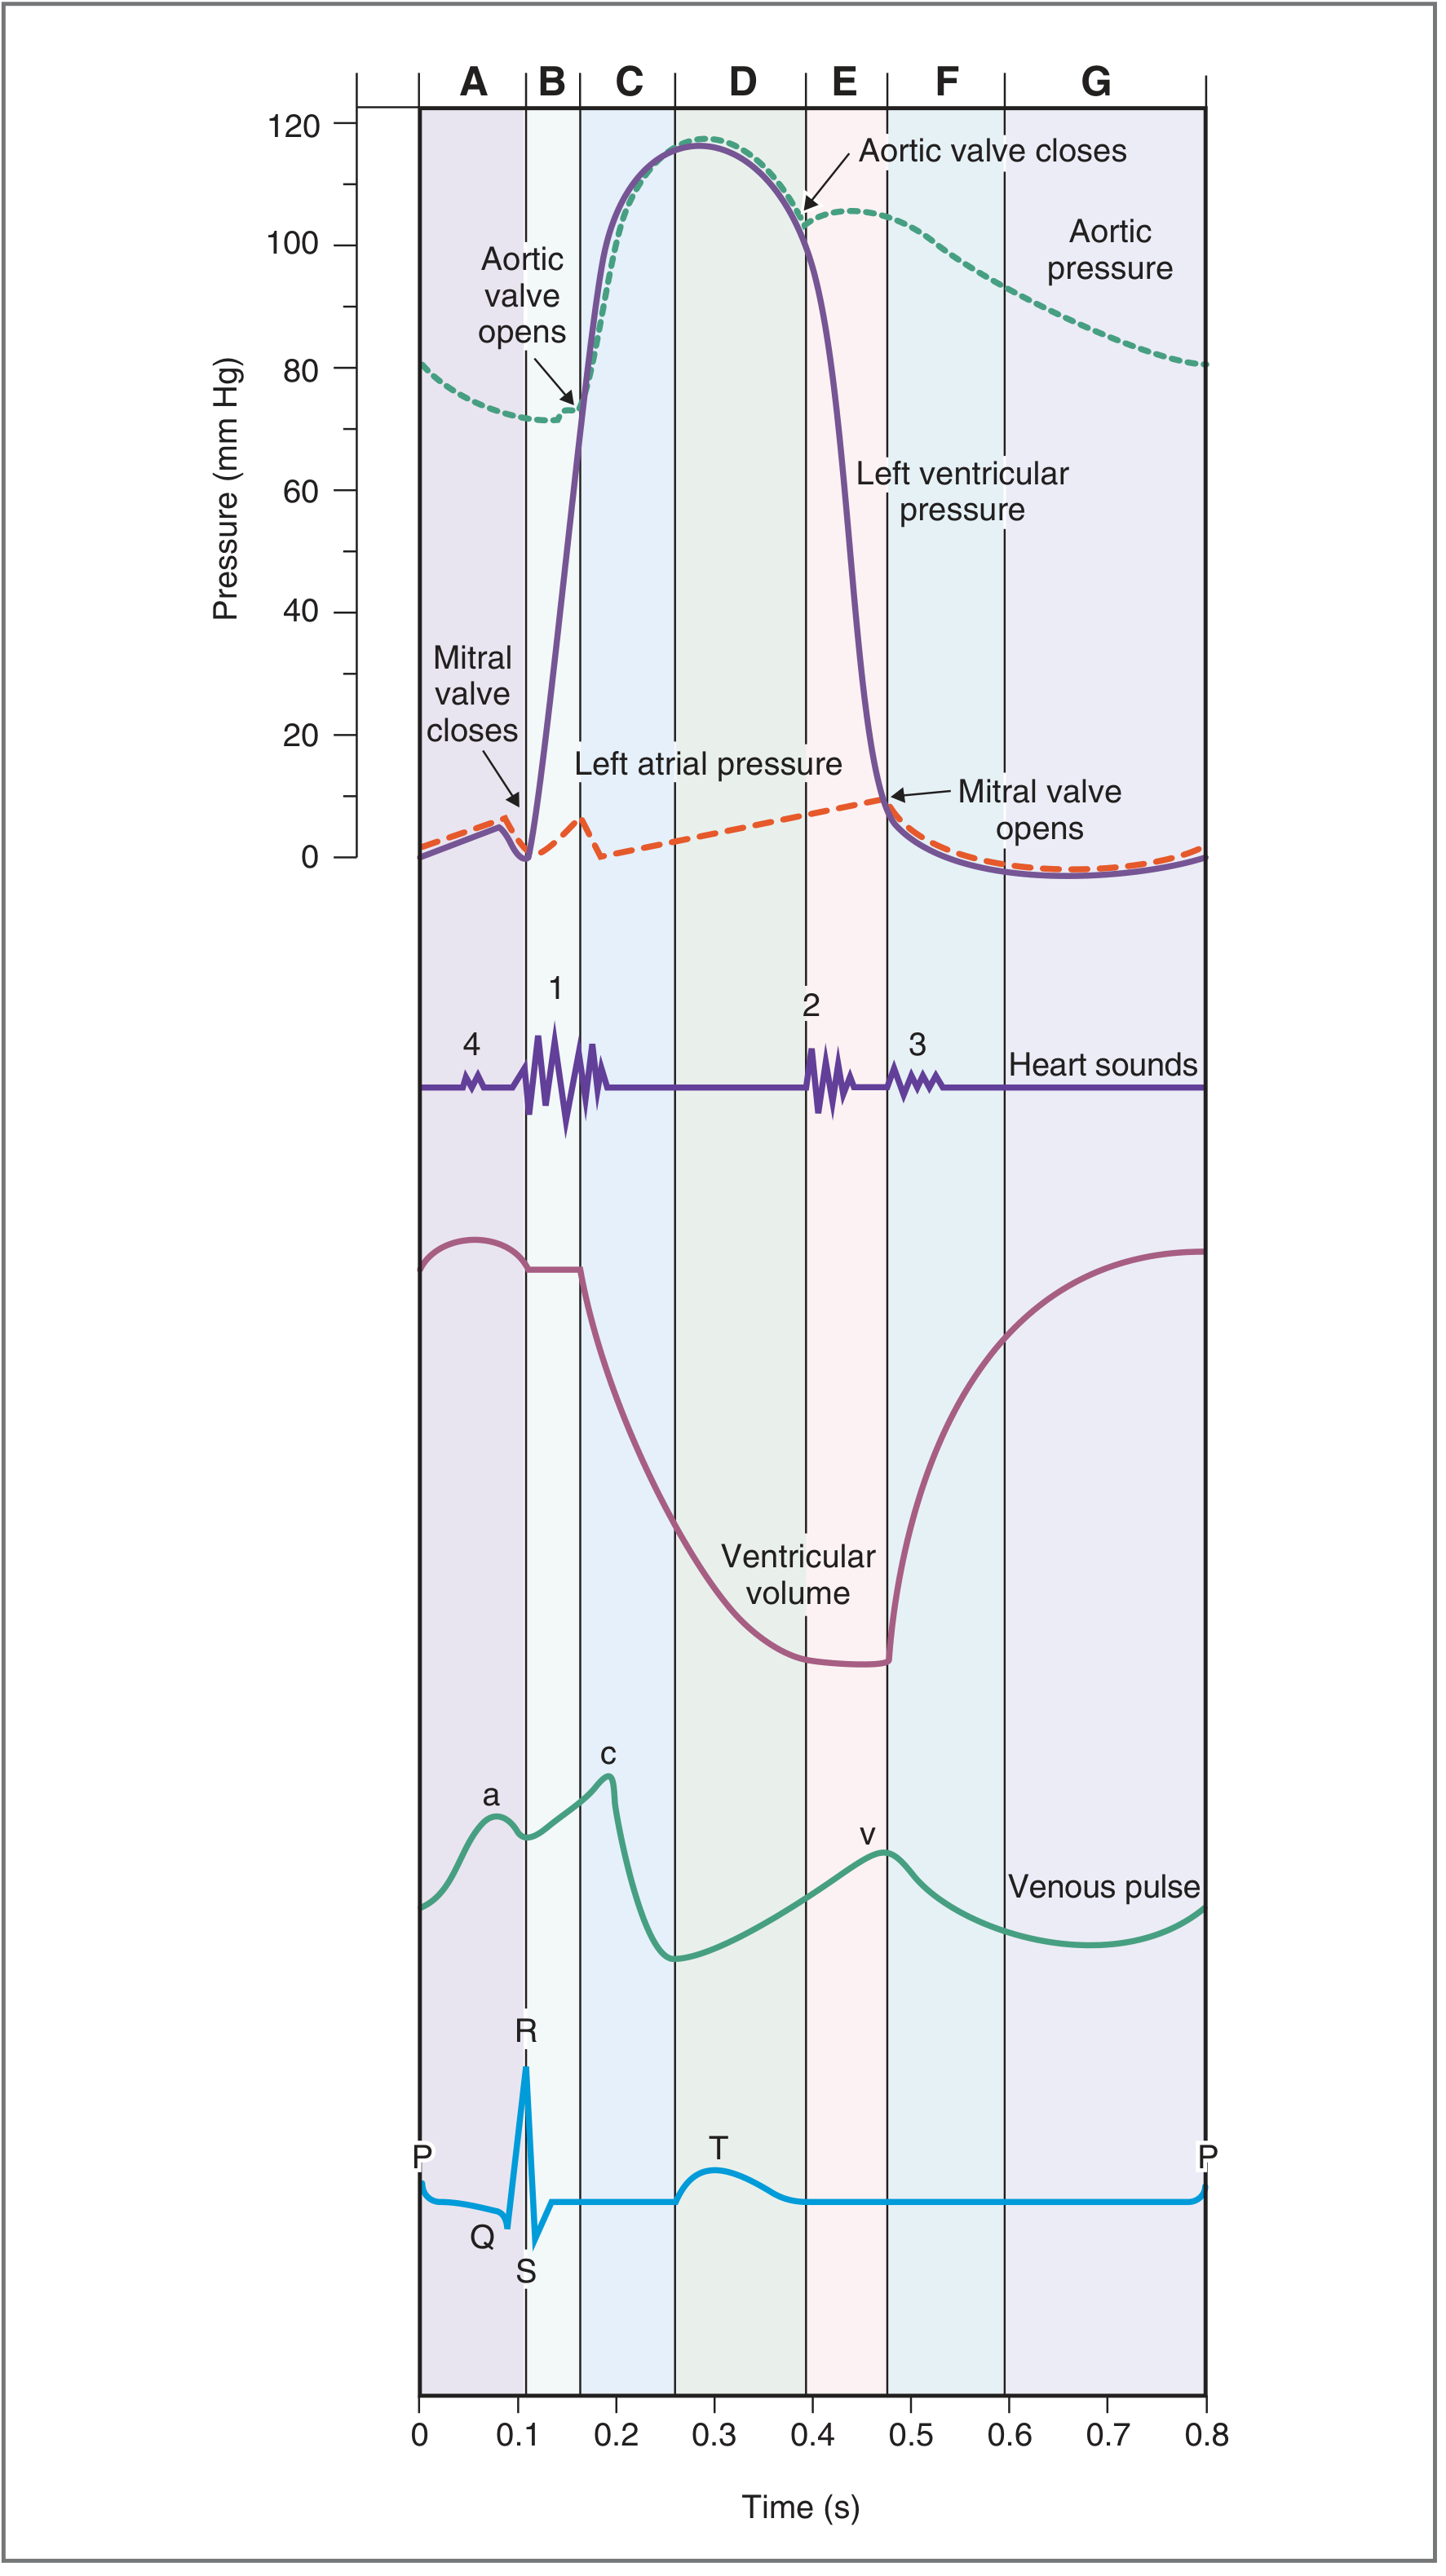
Fig. 4.25 — Costanzo Physiology, 7th Edition
Seven Phases (Left Heart)
Phase A — Atrial Systole
- ECG: P wave (atrial depolarization)
- The left atrium contracts, boosting left ventricular filling. The ventricle is still relaxed with the mitral valve open.
- Contributes 20–30% of total ventricular filling (the remaining 70–80% fills passively in diastole).
- S4 heart sound: not audible in normal adults; heard in pathological states (e.g., ventricular hypertrophy) where ventricular compliance is reduced. It is caused by atrial contraction against a stiffened ventricle.
Phase B — Isovolumetric Ventricular Contraction
- ECG: QRS complex (ventricular depolarization)
- Ventricular contraction begins. As soon as LV pressure > LA pressure, the mitral valve closes → S1 (first heart sound; split because mitral closes slightly before tricuspid).
- All valves are closed → ventricular pressure rises sharply but volume is constant.
- LV pressure rises from ~0 to ~80 mmHg.
Phase C — Rapid Ventricular Ejection
- ECG: ST segment
- When LV pressure exceeds aortic pressure (~80 mmHg), the aortic valve opens.
- Most of the stroke volume (~70%) is ejected rapidly; ventricular volume falls dramatically.
- Aortic pressure rises to its peak (~120 mmHg systolic).
- Left atrial pressure slowly rises as pulmonary venous return begins to fill the atrium again.
Phase D — Reduced Ventricular Ejection
- ECG: T wave (ventricular repolarization begins)
- Ventricles begin to repolarize and relax; ejection continues but at a slower rate.
- Ventricular volume reaches its minimum = end-systolic volume (ESV, ~50 mL).
- Aortic pressure begins to fall as blood runs off peripherally faster than it is replenished.
- Stroke volume = EDV − ESV (normally ~70 mL); Ejection fraction = SV/EDV (~60%).
Phase E — Isovolumetric Ventricular Relaxation
- ECG: after T wave (fully repolarized)
- LV pressure drops rapidly. When LV pressure < aortic pressure, the aortic valve closes → S2 (second heart sound; physiologically split on inspiration due to delayed pulmonic valve closure from increased RV filling).
- The dicrotic notch (incisura) on the aortic pressure trace represents the brief pressure fluctuation at aortic valve closure.
- All valves closed again → pressure falls but volume is constant.
Phase F — Rapid Ventricular Filling
- LV pressure falls below LA pressure → mitral valve opens.
- Blood flows rapidly from atrium to ventricle driven by the pressure gradient; ventricular volume rises quickly.
- S3 heart sound: occurs here. Normal in children/young adults; pathological in adults (suggests volume overload or reduced ventricular compliance, e.g., heart failure).
Phase G — Reduced Ventricular Filling (Diastasis)
- Continued slow passive filling; pressures in atrium and ventricle equilibrate.
- Ends when the next P wave fires, restarting Phase A.
Summary Table
| Phase | ECG Event | Valves | Heart Sound | Volume Change |
|---|---|---|---|---|
| A: Atrial Systole | P wave | Mitral open | S4 (abnormal) | LV ↑ slightly |
| B: Isovolumetric Contraction | QRS | Mitral closes | S1 | Constant |
| C: Rapid Ejection | ST segment | Aortic opens | — | LV ↓ rapidly |
| D: Reduced Ejection | T wave | — | — | LV ↓ slowly → ESV |
| E: Isovolumetric Relaxation | After T | Aortic closes | S2 | Constant |
| F: Rapid Filling | — | Mitral opens | S3 (abnormal in adults) | LV ↑ rapidly |
| G: Diastasis | — | — | — | LV ↑ slowly → EDV |
Venous (JVP) Waveforms
Three waves are visible on atrial/central venous pressure tracings, synchronized to the cardiac cycle:
| Wave/Descent | Cause |
|---|---|
| a wave | Atrial contraction (Phase A) |
| c wave | AV valve bulging into atrium during early ventricular contraction |
| x descent | Atrial relaxation + downward displacement of AV valve during systole |
| v wave | Venous return building up while AV valve is closed |
| y descent | AV valve opens → atrial emptying |
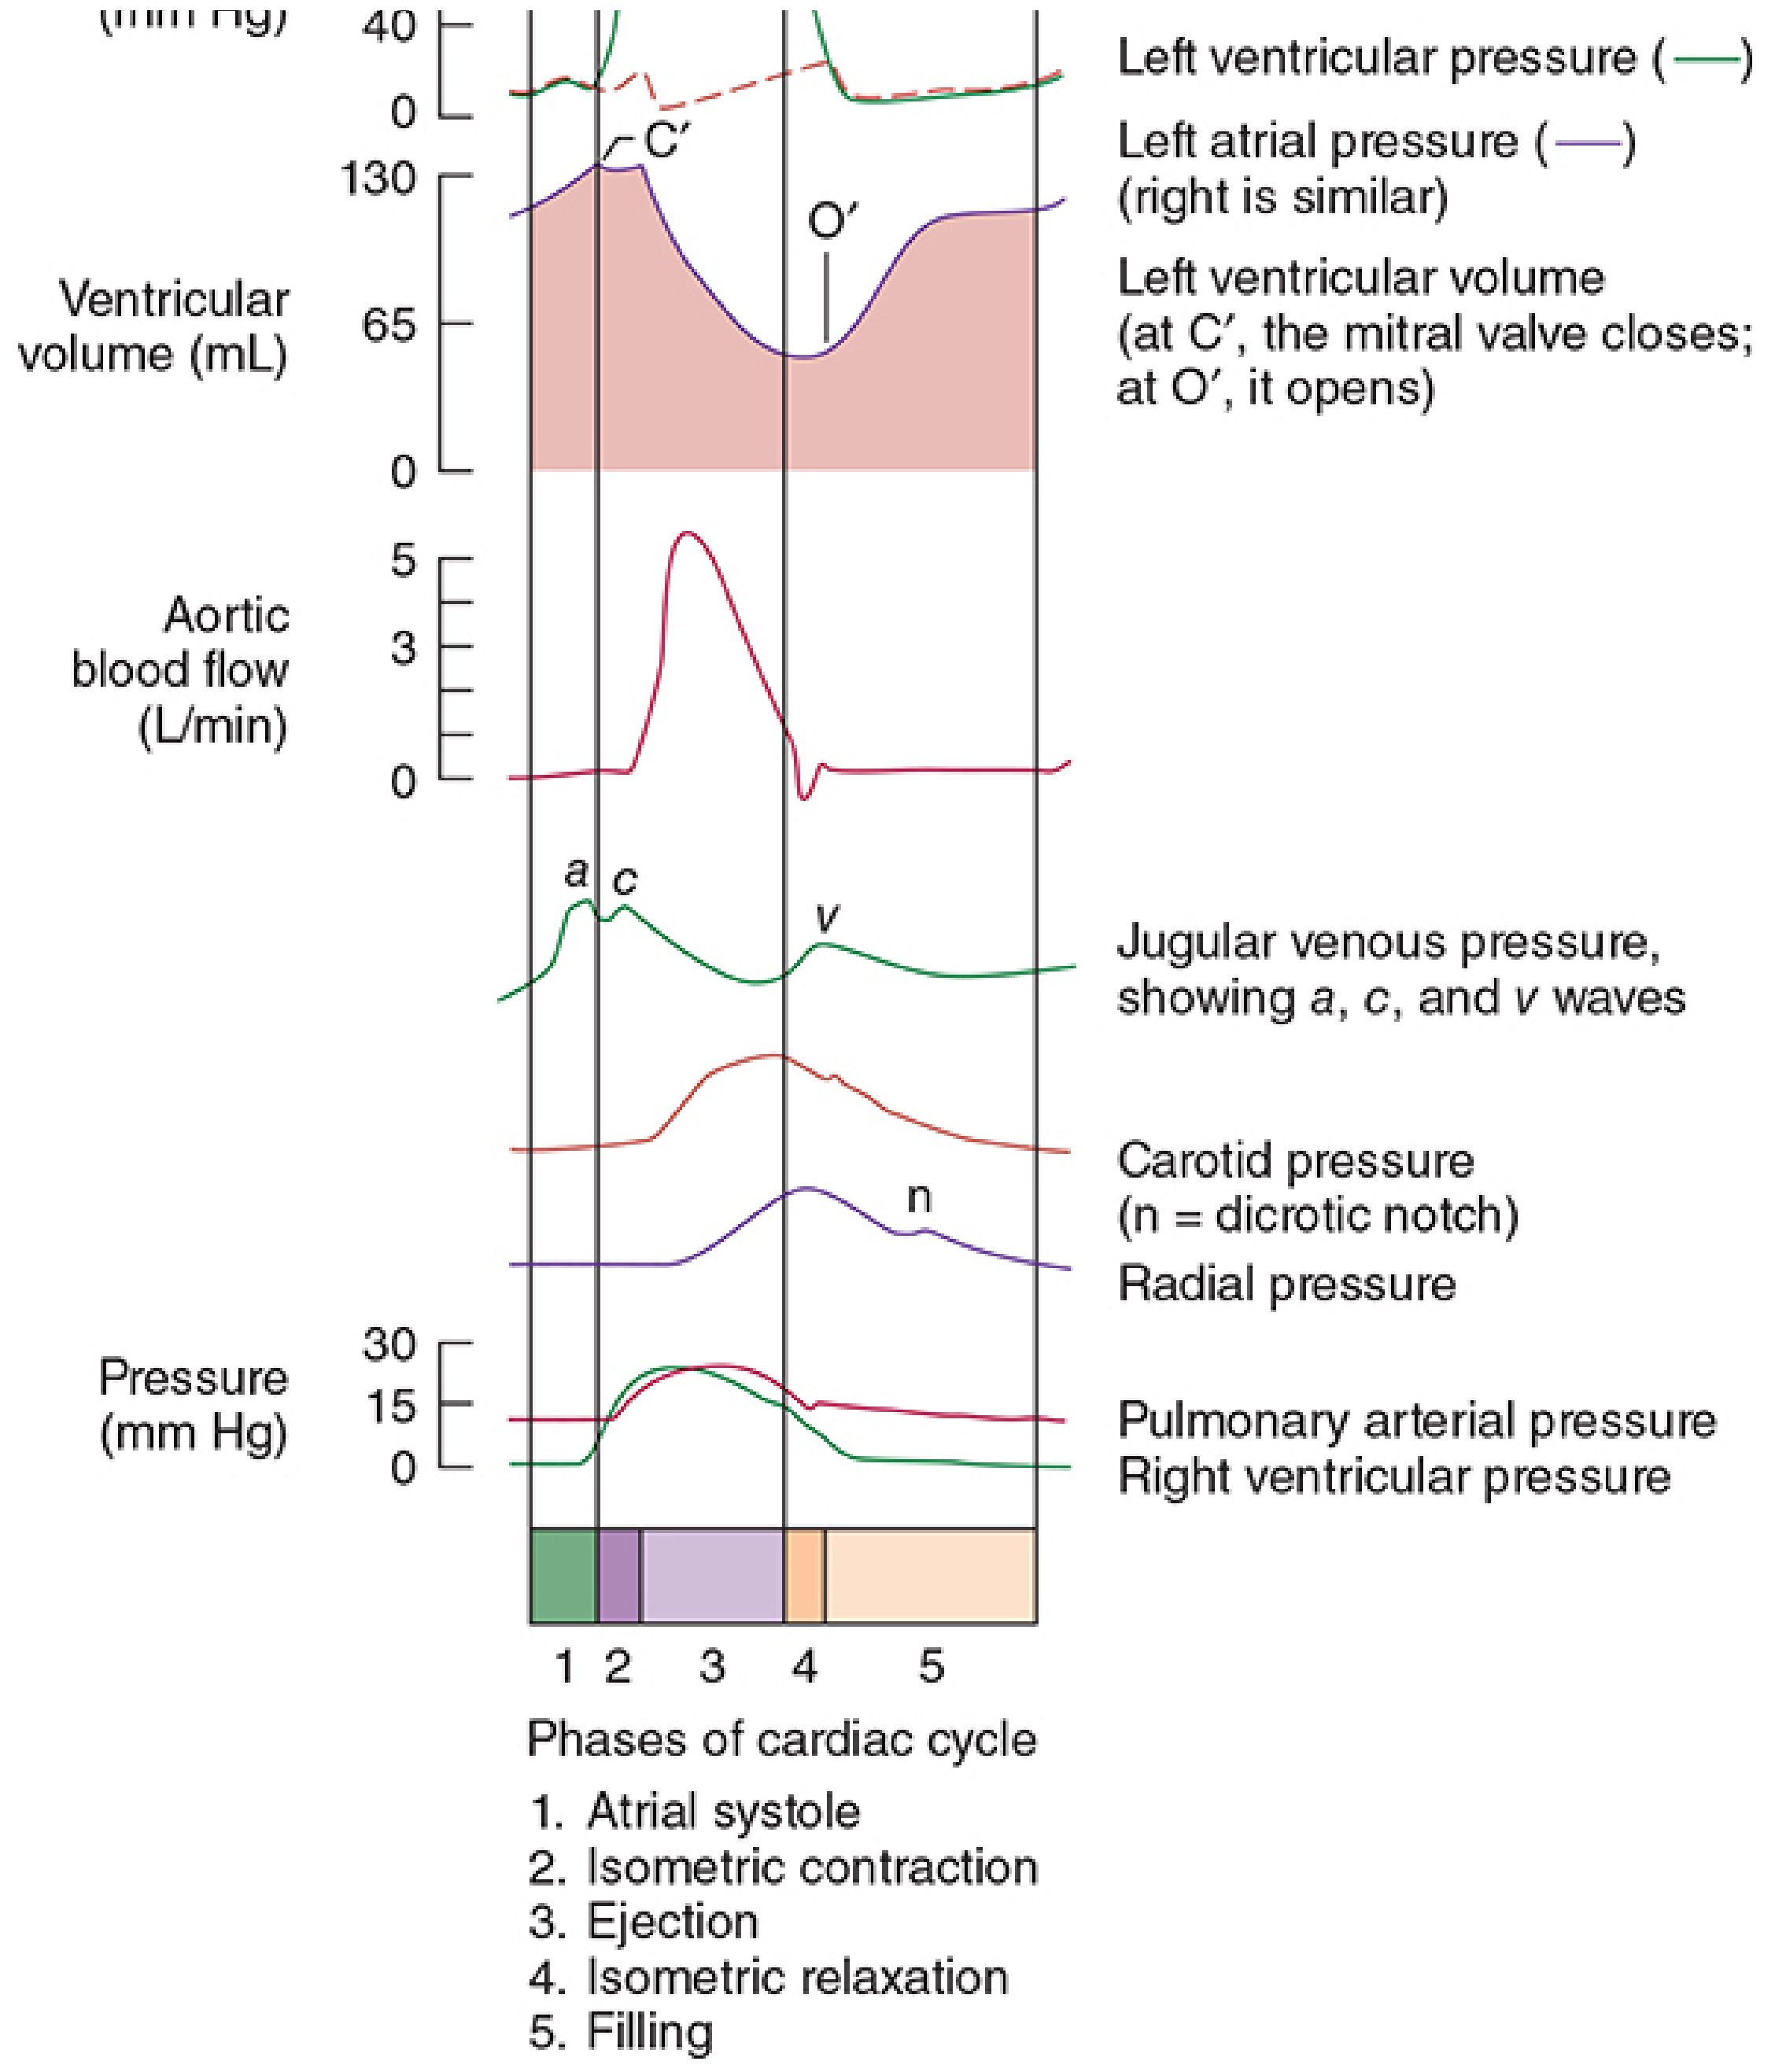
FIGURE 20-4 — Morgan and Mikhail's Clinical Anesthesiology, 7th Edition
Effect of Heart Rate on Cycle Duration
When heart rate increases, diastole shortens disproportionately more than systole. At a heart rate of 72 bpm, systole accounts for ~40% of the cycle; at very high rates (e.g., 200 bpm), systole can occupy ~65% of the cycle. This means the ventricles have insufficient time to fill, reducing stroke volume and potentially cardiac output.
Key Numerical Values (at rest, left heart)
| Parameter | Value |
|---|---|
| Heart rate | ~72 beats/min |
| Cycle duration | ~0.83 s |
| End-diastolic volume (EDV) | ~120–130 mL |
| End-systolic volume (ESV) | ~50–60 mL |
| Stroke volume (SV) | ~70 mL |
| Ejection fraction (EF) | ~60% |
| LV peak systolic pressure | ~120 mmHg |
| LV end-diastolic pressure | ~8–12 mmHg |
| Aortic diastolic pressure | ~80 mmHg |
Sources: Costanzo Physiology, 7th Ed. | Guyton and Hall Medical Physiology | Morgan and Mikhail's Clinical Anesthesiology, 7th Ed.
This is a shared conversation. Sign in to Orris to start your own chat.