
Signal transduction
signal transduction pathway diagram receptor second messenger
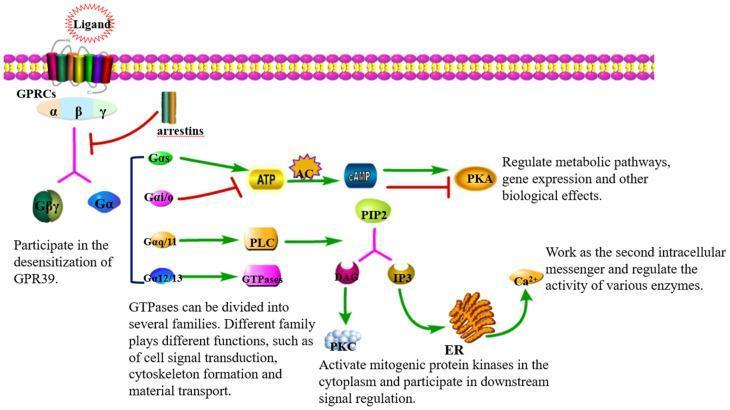
This pathophysiology diagram illustrates G-protein-coupled receptor (GPCR) signal transduction pathways across a plasma membrane. The schematic details four primary Gα subunit cascades. The Gαs pathway activates adenylate cyclase (AC) to convert ATP into cAMP, which stimulates Protein Kinase A (PKA). Conversely, Gαi/o inhibits AC, reducing cAMP and inhibiting PKA activity. The Gαq/11 pathway activates Phospholipase C (PLC), which cleaves PIP2 into diacylglycerol (DAG) and inositol triphosphate (IP3). DAG subsequently activates Protein Kinase C (PKC), while IP3 triggers calcium (Ca2+) release from the endoplasmic reticulum (ER) to serve as a second messenger. The Gα12/13 pathway is shown activating GTPases, involved in cytoskeleton and signal regulation. Additionally, the diagram depicts GPCR desensitization through arrestins and the dissociation of the Gβγ complex. The visual highlights the molecular mechanisms by which extracellular ligands regulate metabolic pathways, gene expression, and enzyme activity in human cellular physiology.
![A pathophysiology diagram illustrating the signal transduction pathway of Group I metabotropic glutamate receptors (mGluRs). The visual depicts a serpentine G-protein-coupled receptor (GPCR) embedded in a gray horizontal bar representing the cell membrane. On the extracellular side, a red circle representing glutamate binds to the receptor complex. Intracellularly, the receptor is associated with a heterotrimeric G-protein complex consisting of beta (dark red), gamma (yellow), and alpha-q (pink) subunits. Upon activation, an arrow with a '+' symbol indicates the stimulation of phospholipase C (PLC), represented as a light blue oval. The pathway bifurcates from PLC, leading to 'Inositolphosphate turnover' and the production of inositol trisphosphate (IP3). IP3 is shown acting on an intracellular storage organelle (white circle) to trigger the release of calcium ions (Ca2+), labeled as increased 'Intracellular [Ca2+]'. This schematic summarizes the biochemical cascade from neurotransmitter binding to secondary messenger activation in neural signaling.](https://cdn.orris.care/cdss_images/pmc_clinical_VQA_a3f08fc82b656188a7dd21fdb517356d1f359b36cf8221f82686b9ebf72dbc71.jpg)
A pathophysiology diagram illustrating the signal transduction pathway of Group I metabotropic glutamate receptors (mGluRs). The visual depicts a serpentine G-protein-coupled receptor (GPCR) embedded in a gray horizontal bar representing the cell membrane. On the extracellular side, a red circle representing glutamate binds to the receptor complex. Intracellularly, the receptor is associated with a heterotrimeric G-protein complex consisting of beta (dark red), gamma (yellow), and alpha-q (pink) subunits. Upon activation, an arrow with a '+' symbol indicates the stimulation of phospholipase C (PLC), represented as a light blue oval. The pathway bifurcates from PLC, leading to 'Inositolphosphate turnover' and the production of inositol trisphosphate (IP3). IP3 is shown acting on an intracellular storage organelle (white circle) to trigger the release of calcium ions (Ca2+), labeled as increased 'Intracellular [Ca2+]'. This schematic summarizes the biochemical cascade from neurotransmitter binding to secondary messenger activation in neural signaling.
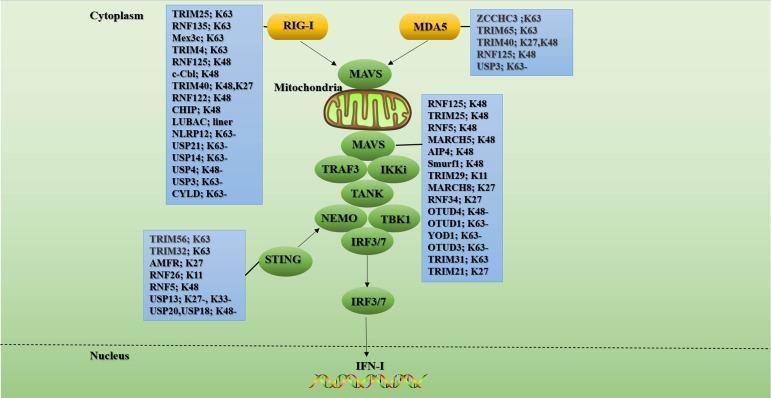
A pathophysiology diagram illustrating the RLR (RIG-I-like receptor) signaling pathway and its regulation by ubiquitination. The pathway originates in the cytoplasm where RIG-I and MDA5 recognize viral ligands and converge on the mitochondrial adaptor protein MAVS. Downstream signal transduction proceeds through a complex of TRAF3, IKKi, TANK, NEMO, and TBK1, leading to the phosphorylation of transcription factors IRF3 and IRF7. These factors translocate from the cytoplasm into the nucleus to initiate Type I Interferon (IFN-I) production. The diagram highlights the extensive regulatory role of E3 ubiquitin ligases and deubiquitinating enzymes (DUBs), listed in blue boxes adjacent to key signaling proteins (RIG-I, MDA5, MAVS, and STING). It specifies various ubiquitin linkage types (K63, K48, K27, K11, and linear) associated with specific regulators such as TRIM25, RNF125, and various USPs. K63-linked chains generally promote signaling activation, while K48-linked chains typically lead to proteasomal degradation for pathway attenuation. This visual serves as a comprehensive educational map for innate antiviral immunity and post-translational protein modification.
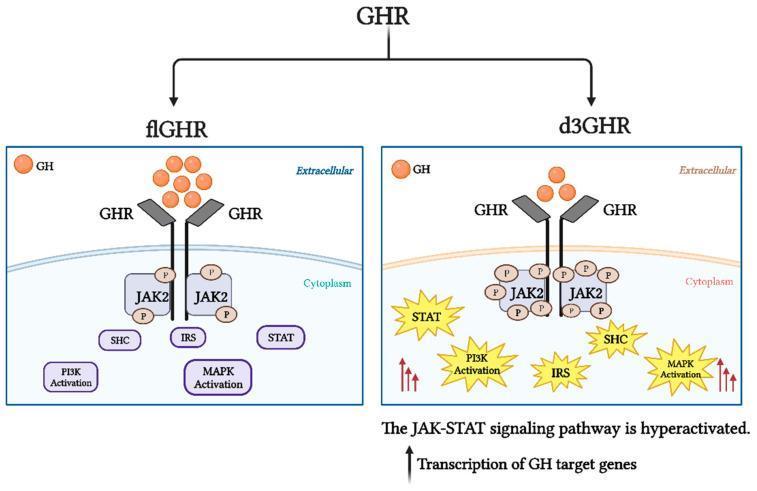
This pathophysiology diagram compares the intracellular signaling pathways of the full-length growth hormone receptor (flGHR) and the exon 3-deleted growth hormone receptor (d3GHR). Both pathways illustrate Growth Hormone (GH) binding to the extracellular domain of the GHR, leading to the recruitment and phosphorylation of Janus kinase 2 (JAK2) in the cytoplasm. Downstream signal transduction involves the activation of SHC, IRS, STAT, PI3K, and MAPK pathways. In the d3GHR variant, the diagram depicts hyperactivation of these signaling cascades, visually indicated by 'burst' icons around the cytoplasmic proteins (STAT, PI3K, IRS, MAPK), multiple phosphorylation markers on JAK2, and red upward arrows. This hyperactivation in the d3GHR pathway is associated with increased sensitivity of the JAK-STAT pathway, resulting in enhanced transcription of GH target genes compared to the standard flGHR isoform. The illustration serves as an educational tool for endocrinology and molecular biology to demonstrate how genetic variations in receptor structure influence hormonal signal intensity and gene expression.
Signal Transduction
- Medical Physiology (Boron & Boulpaep), p. 73-84
- Robbins & Cotran Pathologic Basis of Disease, 10e, p. 33-34
- Harrison's Principles of Internal Medicine, 22e, p. 3696
1. Modes of Intercellular Communication
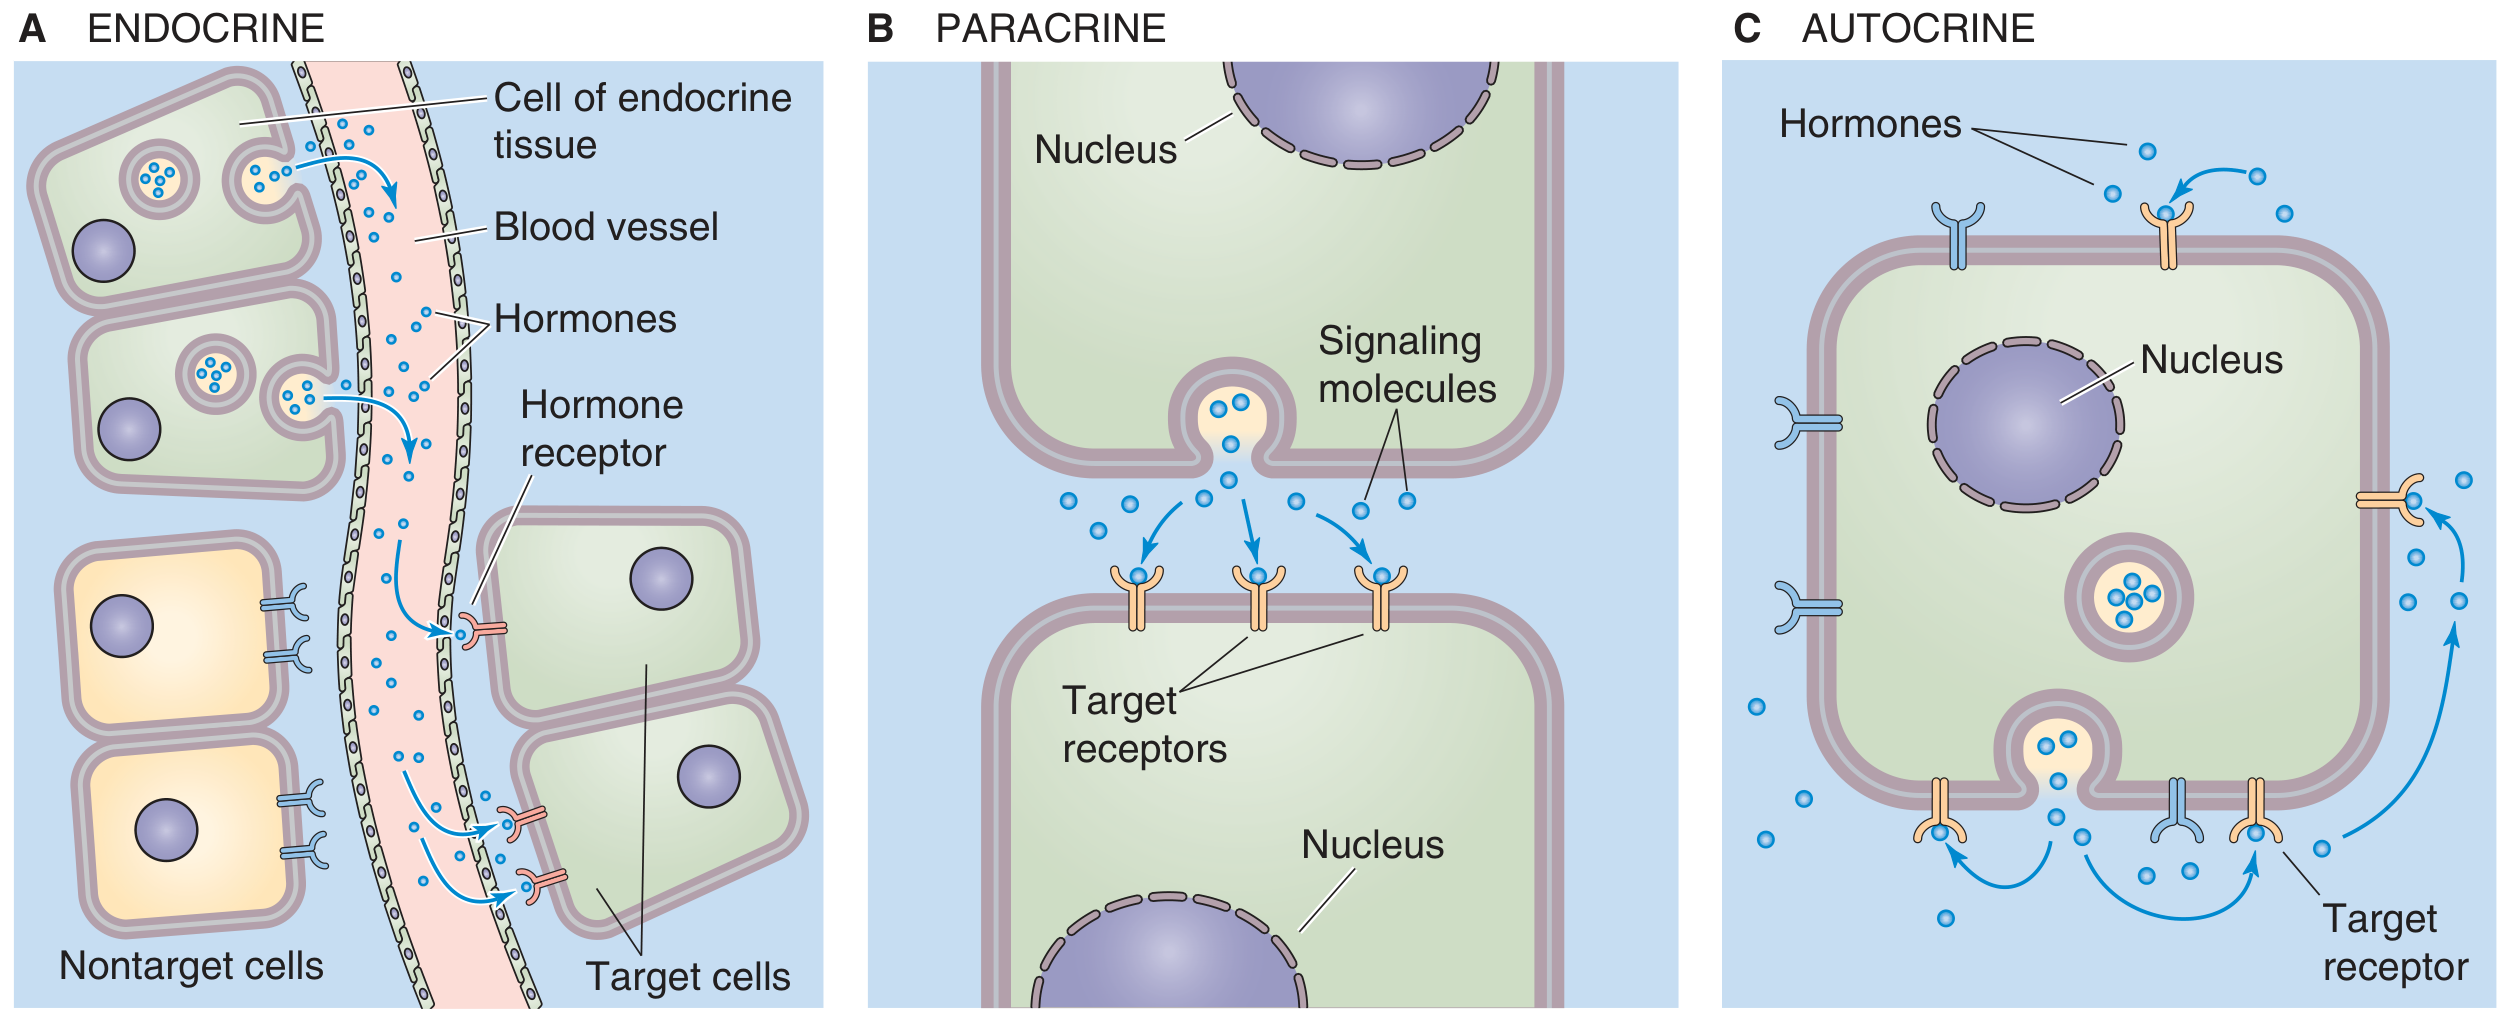
| Mode | Mechanism | Example |
|---|---|---|
| Endocrine | Hormone enters blood, acts on distant tissue | Insulin from pancreas acting on liver |
| Paracrine | Signal acts on neighboring cells in same tissue | ACh at the neuromuscular junction |
| Autocrine | Signal acts back on the cell that released it | Growth factors in cancer cells |
| Juxtacrine | Direct cell-cell or cell-matrix contact | Notch/Delta signaling |
2. Classes of Extracellular Signaling Molecules
- Amines - epinephrine, dopamine, serotonin
- Peptides & proteins - insulin, angiotensin II, growth factors
- Steroids - aldosterone, estrogens, retinoic acid
- Other small molecules - amino acids, nucleotides, Ca²⁺, nitric oxide (NO)
3. Receptor Classes and Their Mechanisms
3.1 Ligand-Gated Ion Channels
- Hybrid receptor-channel proteins. Ligand binding causes rapid conformational change, opening an ion pore.
- Produces an electrical signal (change in membrane potential).
- Examples: nicotinic ACh receptor (Na⁺/K⁺), GABA-A receptor (Cl⁻), NMDA receptor (Ca²⁺/Na⁺).
- Speed: milliseconds - fastest signaling modality.
3.2 G Protein-Coupled Receptors (GPCRs)
- Over 1,500 GPCRs identified; the largest receptor superfamily.
- Characterized by 7 transmembrane helices (serpentine/heptahelical receptors).
- Work indirectly through a heterotrimeric GTP-binding protein (Gα, Gβ, Gγ subunits).
- Ligand binds → GPCR changes conformation
- GPCR associates with G protein (GDP-bound, inactive)
- GDP exchanged for GTP → Gα dissociates from Gβγ
- Active Gα (or Gβγ) modulates downstream effectors
- Intrinsic GTPase activity of Gα hydrolyzes GTP → GDP → system returns to rest
| Gα subunit | Effector | Second messenger / Effect |
|---|---|---|
| Gαs | Activates adenylyl cyclase (AC) | ↑ cAMP → activates PKA |
| Gαi/o | Inhibits adenylyl cyclase | ↓ cAMP → inhibits PKA |
| Gαq/11 | Activates phospholipase C-β (PLC-β) | ↑ IP₃ + DAG → Ca²⁺ release + PKC activation |
| Gα12/13 | Activates RhoGEFs → Rho GTPases | Cytoskeletal reorganization |
3.3 Catalytic (Enzyme-Linked) Receptors
Receptor Tyrosine Kinases (RTKs)
- Examples: insulin receptor, EGF receptor, PDGF receptor, VEGF receptor.
- Ligand binding induces receptor dimerization → trans-autophosphorylation of tyrosine residues → recruitment of SH2 domain-containing adaptor proteins.
- Key downstream cascades:
- RAS/MAPK pathway: Ras (small GTPase) → Raf → MEK → ERK → transcription factors (proliferation, differentiation)
- PI3K/Akt pathway: PI3K phosphorylates PIP₂ → PIP₃ → recruits PDK1 and Akt → promotes cell survival, growth, metabolism
- JAK-STAT pathway: used by many cytokine receptors (not classical RTKs but same logic)
Non-receptor Tyrosine Kinases
- Receptors with no intrinsic catalytic activity (immune receptors, integrins) recruit cytoplasmic kinases.
- Src-family kinases (c-Src, Lck, Fyn) are the prototype - contain SH2 and SH3 domains that mediate protein-protein interactions.
- SH2 domains bind phosphotyrosine-containing sequences; SH3 domains bind proline-rich sequences.
Receptor Serine/Threonine Kinases
- Examples: TGF-β receptors (type I and II).
- Phosphorylate SMAD proteins → nuclear translocation → gene regulation.
Receptor Guanylyl Cyclases
- Ligand binding (e.g., atrial natriuretic peptide [ANP]) activates the intracellular guanylyl cyclase domain → converts GTP to cGMP → activates PKG.
3.4 Nuclear (Intracellular) Receptors
- Ligands: steroid hormones (cortisol, aldosterone, sex steroids), thyroid hormones, vitamin D, retinoids.
- Receptors reside in cytosol or nucleus; ligand binding triggers conformational change, dimerization, and binding to hormone response elements (HREs) in DNA.
- Can activate or repress gene transcription.
- Slowest signaling (hours) - but produces long-lasting changes in gene expression.
3.5 Receptors That Undergo Regulated Cleavage (RIP)
- Examples: Notch receptor, APP (amyloid precursor protein).
- Ligand binding triggers proteolytic cleavage (by metalloproteases and then γ-secretase) → release of an intracellular fragment → nuclear translocation → transcription.
4. Second Messengers
cAMP (cyclic adenosine monophosphate)
- Synthesized by adenylyl cyclase from ATP; degraded by phosphodiesterases (PDEs).
- Primary effector: Protein Kinase A (PKA) - phosphorylates serine/threonine residues on target proteins.
- PKA also phosphorylates the transcription factor CREB (cAMP response element-binding protein) → gene expression changes.
- Physiological roles: glycogen breakdown (liver), lipolysis (adipose), cardiac inotropy (heart), gluconeogenesis.
cGMP (cyclic guanosine monophosphate)
- Synthesized by guanylyl cyclase (membrane-bound or soluble forms; the soluble form is activated by nitric oxide, NO).
- Primary effectors: PKG, cyclic nucleotide-gated ion channels, PDEs.
- Roles: smooth muscle relaxation (vasodilation), visual phototransduction, platelet inhibition.
IP₃ / DAG (Phosphoinositide pathway)
- Phospholipase C (PLC) cleaves PIP₂ into two second messengers:
- IP₃ (inositol-1,4,5-trisphosphate): water-soluble, diffuses to ER → opens IP₃-gated Ca²⁺ channels → cytoplasmic Ca²⁺ spike
- DAG (diacylglycerol): lipid-soluble, remains in membrane → activates Protein Kinase C (PKC)
- PKC phosphorylates many substrates → gene expression, cell growth, secretion.
Ca²⁺
- A universal second messenger. Cytosolic [Ca²⁺] is kept very low (~100 nM at rest vs. 1 mM extracellular) by pumps (SERCA, PMCA) and exchangers.
- Released from ER via IP₃ receptors or ryanodine receptors (RyRs), or enters from outside via voltage-gated or receptor-operated channels.
- Acts through calmodulin (CaM) → Ca²⁺-CaM complex activates CaM kinases (CaMKII), calcineurin (phosphatase), and other enzymes.
5. Signal Amplification and Cascade Logic
- Each step can be modulated by inhibitors or activators, conferring specificity.
- The same second messenger (e.g., cAMP) can produce different responses in different cell types depending on which PKA substrates and effectors are present.
- Example of diversity: ACh stimulates skeletal muscle contraction (via nicotinic receptors), inhibits cardiac muscle contraction (via muscarinic M2 → Gαi → ↓cAMP), and stimulates glandular secretion (via muscarinic M3 → Gαq → IP₃/Ca²⁺).
- Crosstalk: signaling cascades are not linear silos - they intersect extensively. PKA can phosphorylate components of the MAPK pathway; Ca²⁺-CaM kinases can modulate cAMP signaling; and PI3K products influence GTPase activity.
6. Regulation and Termination of Signals
| Mechanism | Example |
|---|---|
| Receptor internalization/downregulation | GPCR internalization via β-arrestin + clathrin |
| Ligand degradation | Acetylcholinesterase degrades ACh |
| GTPase activity | Gα self-inactivates by hydrolyzing GTP to GDP |
| Phosphatases | Protein tyrosine phosphatases (PTPs) oppose RTK phosphorylation |
| Phosphodiesterases | PDEs degrade cAMP and cGMP |
| Negative feedback | PKA phosphorylates and inhibits upstream components |
| RGS proteins | "Regulators of G-protein Signaling" - accelerate GTPase activity of Gα |
7. Clinical Relevance
| Disease | Signal Transduction Defect |
|---|---|
| Cancer | Mutant Ras (constitutively GTP-bound, always "on") in ~30% of human cancers; gain-of-function receptor tyrosine kinase mutations (e.g., BCR-ABL, mutant EGFR) |
| Type 2 Diabetes | Insulin receptor signaling impairment; downstream PI3K/Akt pathway resistance |
| Cholera | Cholera toxin permanently ADP-ribosylates Gαs → constitutive adenylyl cyclase activation → massive cAMP → Cl⁻/water secretion |
| Pertussis (whooping cough) | Pertussis toxin ADP-ribosylates Gαi → cannot inhibit AC → excess cAMP |
| McCune-Albright syndrome | Activating mutation of Gαs (GNAS) in mosaic distribution |
| Bipolar disorder / Lithium | Lithium inhibits GSK3β and phosphoinositide-recycling enzymes (inositol monophosphatase) → dampens PKC-mediated signaling |
| Targeted therapy | Imatinib (BCR-ABL kinase inhibitor), trastuzumab (anti-HER2), vemurafenib (BRAF V600E inhibitor) all target signal transduction nodes |
Summary Diagram
Extracellular ligand
        ↓ (binds)
    GPCR (7-TM)
        ↓ (activates)
    G protein (Gα-GTP released)
       /          \
   Gαs             Gαq
     ↓               ↓
Adenylyl           PLC-β
cyclase              ↓
   ↓         IP₃ + DAG
 cAMP           /       \
   ↓          Ca²⁺     PKC
  PKA            ↓        ↓
   ↓         CaM-KII   Phosphorylation
  CREB →                  cascades
Gene expression