
ECG from basics to advance
Asking for Preferences
What's the main purpose of this ECG content? · What's your current level? · What format do you want?
Searching sources...
Let me pull comprehensive ECG content from the medical library across all major topics simultaneously.
Reading File
Finding Sources
Finding Sources
Finding Sources
Finding Sources
Finding Sources
Finding Sources
Now let me read the key sections from authoritative textbooks:
Reading File
Reading File
Reading File
Loading Image
Reading File
Reading File
Reading File
Finding Sources
Finding Sources
Reading File
Reading File
Loading Image
Reading File
Reading File
Reading File
Loading Image
Reading File
I now have comprehensive content from authoritative textbooks. Let me compile the complete ECG guide.
ECG: Basics to Advanced - Exam Preparation Guide
Sources: Guyton & Hall Medical Physiology, Goldman-Cecil Medicine, Harrison's Principles of Internal Medicine, Costanzo Physiology, Harrison's 22nd Edition
PART 1: WHAT IS AN ECG?
An electrocardiogram (ECG or EKG) records the tiny electrical potentials that appear on the body surface as the cardiac impulse travels through the heart. When a cardiac impulse passes through the heart, electrical current spreads into the adjacent tissues and to the skin surface. Electrodes placed on the skin capture these potential differences and display them as a tracing over time.
- Standard ECG: 12 leads (10 electrodes - 4 limb, 6 chest + right leg ground)
- Paper speed: 25 mm/second (standard)
- Calibration: 1 mV = 10 small squares (10 mm) vertically
PART 2: THE CONDUCTION SYSTEM
Understanding the conduction system is the foundation of ECG interpretation.
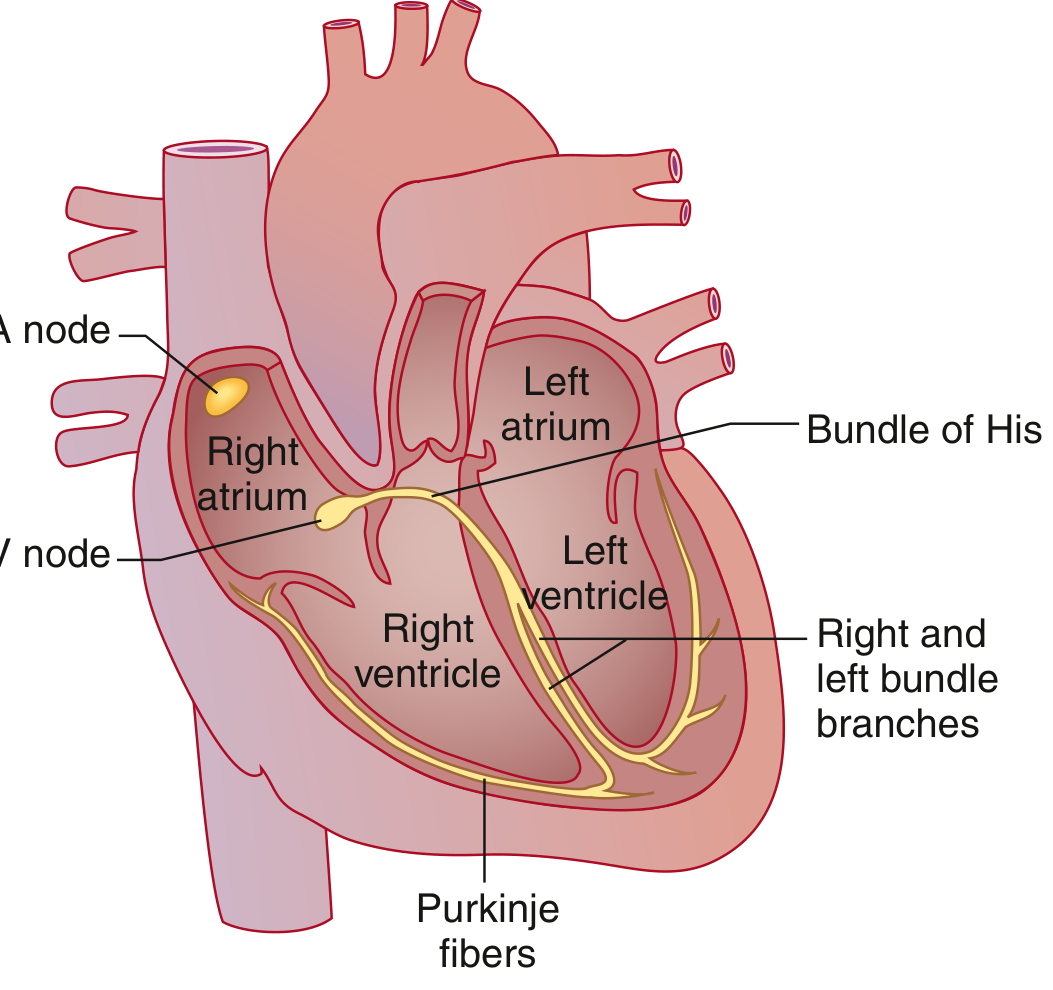
The pathway of electrical activation (as described in Goldman-Cecil Medicine):
- SA node (sinoatrial node) - high lateral right atrium near the superior vena cava; the dominant pacemaker, fires spontaneously at the highest rate (60-100 bpm intrinsic)
- Bachmann's bundle - speeds depolarization to the left atrium
- AV node - the ONLY electrical connection between atria and ventricles; physiologic conduction delay occurs here
- Bundle of His - exits the AV node; capable of rapid conduction
- Right and left bundle branches - the left divides into left anterior and left posterior fascicles
- Purkinje fibers - finest ramifications; distribute depolarization to ventricular myocardium
- Ventricular myocardium - contracts after electrical depolarization
Backup pacemaker rates (important for exams):
| Pacemaker site | Intrinsic rate |
|---|---|
| SA node | 60-100 bpm |
| AV node / junctional | 40-60 bpm |
| Ventricle (idioventricular) | 20-40 bpm |
PART 3: THE ECG PAPER

Grid squares:
- Small box = 1 mm = 0.04 sec (horizontally), 0.1 mV (vertically)
- Large box = 5 mm = 0.20 sec (horizontally), 0.5 mV (vertically)
PART 4: ECG WAVES, INTERVALS AND SEGMENTS
This section is the most tested area for beginners.
The Waves
| Wave | What it represents | Notes |
|---|---|---|
| P wave | Atrial depolarization | Normal: <0.12 sec, <2.5 mm tall; positive in leads I, II, aVF |
| QRS complex | Ventricular depolarization | Q = first negative; R = positive; S = negative after R |
| T wave | Ventricular repolarization | Normally same direction as QRS; broad and slightly asymmetric |
| U wave | Late repolarization (Purkinje / mid-myocardial M-cells) | Small, after T wave; more prominent with hypokalemia and bradycardia |
Key concept (Guyton & Hall): Atrial repolarization also occurs but is buried in the QRS complex and never seen on a normal ECG because the ventricular mass is far larger.
The Intervals
| Interval | Measured from... | Normal value | What it includes |
|---|---|---|---|
| PR interval | Start of P to start of QRS | 0.12 - 0.20 sec (120-200 ms) | Atrial depolarization + AV node delay |
| QRS duration | Start to end of QRS | <0.10 sec; abnormal >0.12 sec | Ventricular depolarization |
| QT interval | Start of QRS to end of T | ~0.35-0.40 sec (rate-dependent) | Total ventricular electrical activity |
| QTc (corrected) | QT / √RR (Bazett's formula) | Men: <450 ms; Women: <460 ms | Heart-rate-corrected QT |
The ST segment (from J-point to start of T wave): corresponds to the plateau of the ventricular action potential. Normally isoelectric (flat). Any deviation is clinically significant.
How to Calculate Heart Rate From ECG
Method 1 (regular rhythm):
Heart rate = 300 ÷ number of large boxes between R waves
Method 2 (exact):
Heart rate = 1500 ÷ number of small boxes between R waves
Example: RR interval = 5 large boxes → HR = 300/5 = 60 bpm
PART 5: THE 12 LEADS - WHERE THEY "LOOK"
Limb Leads (Frontal Plane)
| Lead | View | Positive electrode |
|---|---|---|
| I | Lateral | Left arm |
| II | Inferior-lateral | Left leg |
| III | Inferior | Left leg |
| aVR | Right shoulder (cavity) | Right arm |
| aVL | High lateral | Left arm |
| aVF | Inferior | Left foot |
Precordial (Chest) Leads - V1 to V6 (Horizontal Plane)
| Lead | Anatomical territory |
|---|---|
| V1-V2 | Right ventricle / septal |
| V3-V4 | Anterior wall |
| V5-V6 | Lateral wall |
| II, III, aVF | Inferior wall |
| I, aVL, V5-V6 | Lateral wall |
Lead placement (chest leads):
- V1: 4th intercostal space, right sternal border
- V2: 4th intercostal space, left sternal border
- V3: Between V2 and V4
- V4: 5th intercostal space, midclavicular line
- V5: Anterior axillary line (same horizontal level as V4)
- V6: Midaxillary line (same horizontal level as V4)
PART 6: CARDIAC AXIS
The QRS axis represents the average direction of ventricular depolarization in the frontal plane.
| Axis | Degrees | Normal? |
|---|---|---|
| Normal | -30° to +90° | Yes |
| Left axis deviation (LAD) | More negative than -30° | Abnormal |
| Right axis deviation (RAD) | More positive than +90° | Abnormal |
| Extreme (northwest) | -90° to ±180° | Abnormal |
Quick method to estimate axis:
- Look at leads I and aVF
- If QRS is positive in I and positive in aVF: Normal axis
- If QRS is positive in I and negative in aVF: Left axis deviation
- If QRS is negative in I and positive in aVF: Right axis deviation
- If QRS is negative in both: Extreme axis
Causes of LAD: Left anterior fascicular block (most common in adults), inferior MI, WPW, LBBB
Causes of RAD: Right ventricular hypertrophy, left posterior fascicular block, pulmonary embolism, lateral MI, WPW, RBBB, normal variant (young/thin individuals)
PART 7: SYSTEMATIC APPROACH TO READING AN ECG
Always use a systematic approach to avoid missing findings. The Goldman-Cecil Medicine approach:
- Rate - Calculate heart rate
- Rhythm - Is it regular? Are P waves present? Is every P followed by a QRS?
- Axis - Normal, LAD, or RAD?
- PR interval - Short/normal/prolonged?
- QRS duration - Narrow or wide? Any bundle branch block?
- ST segments - Elevation, depression, or normal?
- T waves - Normal direction? Peaked, inverted, flat?
- QT interval - Prolonged?
- Examine by regions - Septal (V3-V4), anterior (V2-V4), lateral (I, aVL, V5-V6), inferior (II, III, aVF)
PART 8: HEART BLOCKS (CONDUCTION DELAYS)
AV Blocks
| Block | ECG finding | Clinical significance |
|---|---|---|
| 1st degree AV block | PR interval >200 ms; every P conducts | Usually benign |
| 2nd degree - Mobitz I (Wenckebach) | Progressive PR lengthening until a P wave is dropped (no QRS); then resets | AV node disease; often reversible |
| 2nd degree - Mobitz II | Fixed PR interval, sudden non-conducted P wave | Below AV node; can progress to complete block |
| 3rd degree (Complete) | P waves and QRS are independent; AV dissociation | Medical emergency; needs pacemaker |
Memory tip: Mobitz I = "longer, longer, longer, DROP (then have a shorter break)" = Wenckebach
Bundle Branch Blocks (QRS >0.12 sec)
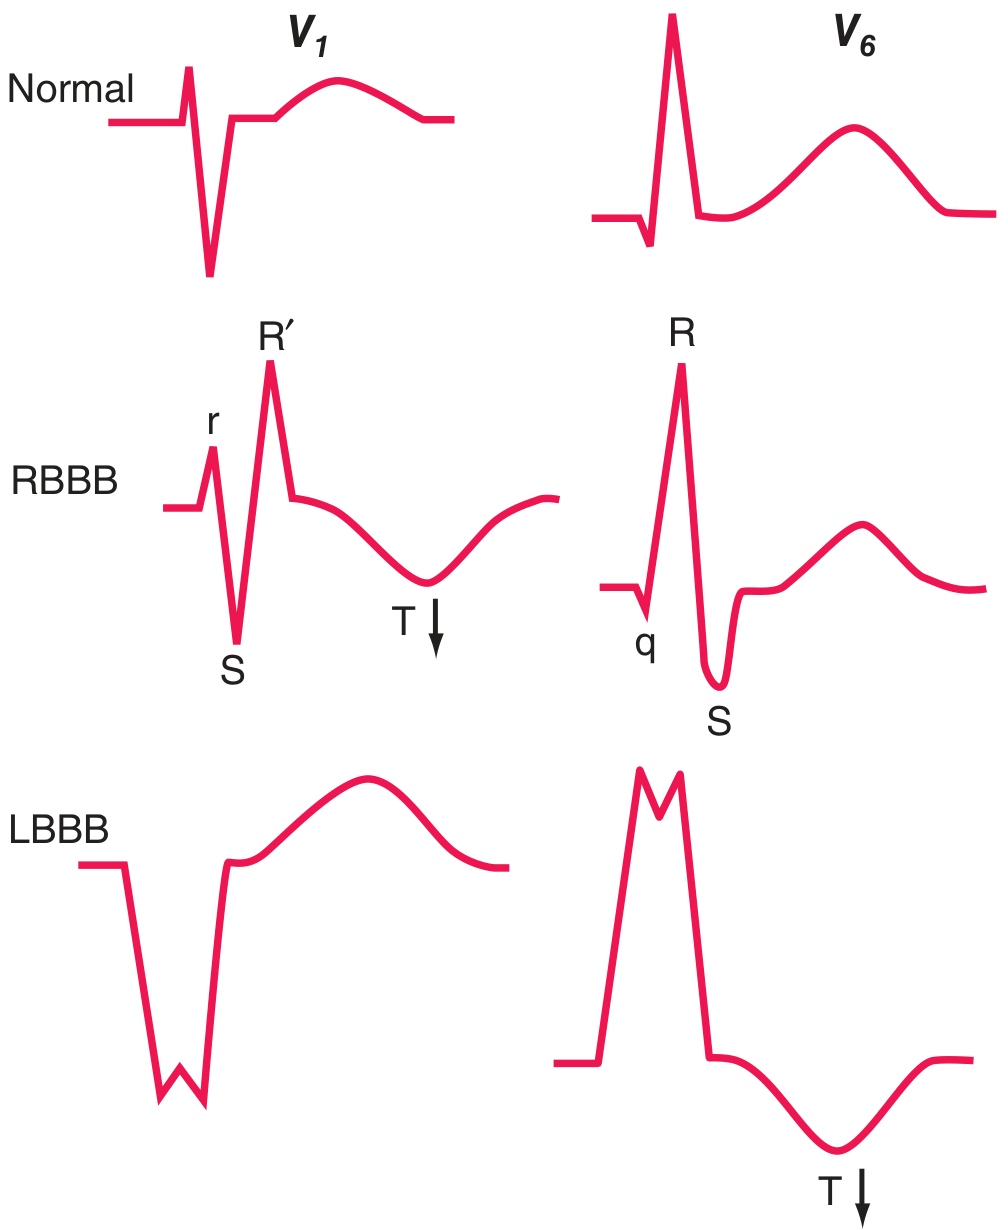
Right Bundle Branch Block (RBBB):
- QRS ≥0.12 sec
- rSR' pattern in V1 ("rabbit ears" or "M" pattern)
- Wide, slurred S wave in I, V5, V6
- T-wave inversion in V1-V3 (secondary change)
- Mnemonic: MaRRoW (RBBB: M in V1, W in V6)
Left Bundle Branch Block (LBBB):
- QRS ≥0.12 sec
- Broad monophasic R (no Q) in I, V5, V6
- QS or rS in V1
- T-wave inversion in lateral leads (secondary change - concordance with QRS)
- Mnemonic: WiLLiaM (LBBB: W in V1, M in V6)
Clinical pearl: New LBBB with chest pain = STEMI equivalent until proven otherwise. LBBB is a marker of significant cardiac disease (coronary artery disease, hypertensive heart disease, cardiomyopathy, aortic valve disease).
Fascicular blocks (hemiblocks): Affect a fascicle of the left bundle; QRS <0.12 sec but axis shifts
- Left anterior fascicular block: LAD (axis more negative than -45°)
- Left posterior fascicular block: RAD (axis more positive than +110°); rare; must exclude other causes
PART 9: CHAMBER ENLARGEMENT
| Finding | ECG criteria |
|---|---|
| Right atrial enlargement (P pulmonale) | P wave >2.5 mm tall in II, III, aVF; peaked |
| Left atrial abnormality (P mitrale) | P wave >0.12 sec wide; notched (bifid) in II; biphasic in V1 with negative terminal portion >1 mm |
| Left ventricular hypertrophy (LVH) | SV1 + RV5 or RV6 >35 mm (Sokolow-Lyon); may have ST depression + T-wave inversion ("strain") in lateral leads |
| Right ventricular hypertrophy (RVH) | R/S ratio >1 in V1; RAD; ST depression + T-wave inversion in V1-V3; dominant R in V1 |
PART 10: ISCHEMIA AND INFARCTION
Phases of STEMI (ST Elevation MI)
| Phase | Time from onset | ECG changes |
|---|---|---|
| Hyperacute | Minutes | Tall, broad "hyperacute" T waves |
| Acute | Hours | ST elevation (tombstone); then T-wave inversion begins |
| Subacute | Days | ST elevation settling; deep Q waves forming; T-wave inversions |
| Old / chronic | Weeks-months | Pathological Q waves; ST may normalize |
Definition of pathological Q wave: >0.04 sec (1 small box) wide AND >25% of R wave height in that lead.
Localization of MI by Leads
| Territory | Leads with changes | Artery involved |
|---|---|---|
| Anterior | V1-V4 | LAD (left anterior descending) |
| Anteroseptal | V1-V3 | LAD (septal branches) |
| Lateral | I, aVL, V5-V6 | Circumflex (LCx) |
| Anterolateral | V1-V6 + I, aVL | LAD or LCx |
| Inferior | II, III, aVF | RCA (right coronary artery); rarely LCx |
| Posterior | Reciprocal ST depression in V1-V3; tall R in V1 | RCA or LCx |
| Right ventricular | ST elevation in V3R, V4R (right chest leads) | Proximal RCA |
Key rule from Harrison's: ST elevations in a regional distribution (matching a coronary territory) = STEMI. Non-regional ST changes may represent Brugada, pericarditis, hypokalemia, etc.
Pericarditis vs. STEMI:
| Feature | STEMI | Pericarditis |
|---|---|---|
| ST elevation | Regional (one territory) | Diffuse (multiple territories) |
| Shape | Convex upward ("tombstone") | Concave upward ("saddle-shaped") |
| Reciprocal changes | Present | Absent (except aVR) |
| PR depression | Absent | Present (classic) |
| Q waves | Develop | Do not develop |
NSTEMI / Unstable Angina
- No ST elevation
- ST depression or T-wave inversions in the territory of ischemia
- Subendocardial ischemia: ST vector shifts toward the endocardium; overlying leads show ST depression
PART 11: ARRHYTHMIAS
Tachyarrhythmias (HR >100 bpm)
Step 1: Is the QRS narrow (<0.12 sec) or wide (≥0.12 sec)?
Narrow Complex Tachycardias (SVT - Supraventricular)
| Rhythm | Rate | P waves | Regularity |
|---|---|---|---|
| Sinus tachycardia | 100-180 | Normal, before each QRS | Regular |
| Atrial fibrillation (AF) | Ventricular 100-180 | None; fibrillatory baseline | Irregularly irregular |
| Atrial flutter | Atrial 300; ventricular 150 (2:1) | "Sawtooth" waves in II, III, aVF | Regular or regular-irregular |
| AVNRT | 150-250 | Retrograde P (buried in QRS or just after) | Regular |
| AVRT (WPW) | 150-250 | Retrograde P after QRS | Regular |
| Multifocal atrial tachycardia (MAT) | 100-150 | ≥3 different P morphologies | Irregular |
Atrial Fibrillation is the most common sustained cardiac arrhythmia. Key features:
- Absent P waves; replaced by irregular fibrillatory baseline (f waves)
- Irregularly irregular ventricular response
- Narrow QRS (unless aberrant conduction or WPW)
Atrial Flutter:
- "Sawtooth" pattern at 300 bpm in inferior leads (II, III, aVF)
- Usually 2:1 AV block → ventricular rate ~150 bpm
- Regular ventricular response
Wide Complex Tachycardias
- Ventricular tachycardia (VT): QRS >0.12 sec; AV dissociation; fusion beats; capture beats; QRS axis often extreme
- SVT with aberrant conduction (BBB): Wide QRS but SVT origin
- Pre-excited tachycardia (WPW): Delta waves, short PR
Brugada criteria to distinguish VT from SVT with BBB:
- Absence of RS complex in all precordial leads → VT
- RS interval >100 ms in any precordial lead → VT
- AV dissociation → VT
- Morphology criteria for VT (if none of above) → SVT with BBB
In doubt: always treat wide complex tachycardia as VT until proven otherwise
Special Patterns
WPW (Wolff-Parkinson-White):
- Short PR (<0.12 sec)
- Delta wave (slurred upstroke at start of QRS)
- Wide QRS
- ST-T changes discordant from QRS
- Accessory pathway (Bundle of Kent) bypasses the AV node
Long QT Syndrome:
- QTc >450 ms (men), >460 ms (women)
- Predisposes to Torsades de Pointes (TdP) - a polymorphic VT
- Causes: drugs (antiarrhythmics, antibiotics, antipsychotics), hypokalemia, hypomagnesemia, congenital LQTS
- Never give QT-prolonging drugs without checking baseline QTc
Brugada Syndrome:
- ST elevation in V1-V3 with RBBB-like pattern (Type 1: "coved" pattern with ≥2 mm J-point elevation)
- Normal coronary arteries
- Risk of sudden cardiac death from VF
- Triggered by fever, sodium channel blockers
Bradyarrhythmias (HR <60 bpm)
| Rhythm | Rate | ECG finding |
|---|---|---|
| Sinus bradycardia | <60 | Normal P, QRS, T but slow |
| Junctional rhythm | 40-60 | No P wave or retrograde P (negative in II) |
| Idioventricular rhythm | 20-40 | Wide QRS, no P, very slow |
| Complete heart block | <40 (escape) | P waves and QRS completely independent |
PART 12: ELECTROLYTE AND DRUG EFFECTS
Hyperkalemia (High K+) - Progressive Changes
| Level | ECG change |
|---|---|
| 5.5-6.5 mEq/L | Tall peaked (tented) T waves in precordial leads |
| 6.5-7.5 mEq/L | PR prolongation; P wave flattening |
| 7.5-8.0 mEq/L | Wide QRS (>0.12 sec); loss of P waves |
| >8.0 mEq/L | Sine wave pattern; VF; asystole |
Hypokalemia (Low K+)
- Flattened/inverted T waves
- Prominent U wave (may merge with T, appearing as prolonged QT)
- ST depression
- QTc prolongation
Hypercalcemia
- Short QT interval (most specific finding)
Hypocalcemia
- Long QT interval (prolonged ST segment)
Digoxin
- "Salvador Dali mustache" or "reverse tick" ST depression (scooped/concave) in lateral leads
- PR prolongation, bradycardia
- AV block at toxic levels
- Bidirectional VT at very toxic levels
Tricyclic Antidepressants (Overdose)
- Sinus tachycardia (most common)
- QRS prolongation >100 ms (sodium channel blockade - most dangerous finding)
- Prolonged QT
- Right axis deviation of terminal 40 ms
- RBBB pattern
- Risk of VF at QRS >160 ms
PART 13: COMMON EXAM HIGH-YIELD PATTERNS
| Pattern | Diagnosis to think of |
|---|---|
| ST elevation V1-V3 + RBBB morphology (coved) | Brugada syndrome |
| Short PR + delta wave | WPW |
| Sawtooth at 300 bpm | Atrial flutter |
| Irregularly irregular, no P waves | Atrial fibrillation |
| Progressive PR lengthening → dropped beat | Mobitz I (Wenckebach) |
| Fixed PR → sudden dropped beat | Mobitz II |
| P and QRS completely independent | Complete heart block |
| RSR' in V1 + wide S in V5/V6 | RBBB |
| Wide R (no Q) in V5/V6 + QS in V1 | LBBB |
| Peaked T waves + wide QRS | Hyperkalemia |
| Prominent U wave | Hypokalemia |
| Short QT | Hypercalcemia |
| Long QT | Hypocalcemia, hypokalemia, drugs |
| Diffuse concave ST + PR depression | Pericarditis |
| Regional ST elevation + reciprocal changes | STEMI |
| S1Q3T3 | Pulmonary embolism |
| Tall R in V1 + RAD + RVH strain | Pulmonary hypertension |
PART 14: NORMAL VALUES SUMMARY
| Parameter | Normal range |
|---|---|
| Heart rate | 60-100 bpm |
| PR interval | 0.12-0.20 sec |
| QRS duration | <0.10 sec (borderline 0.10-0.12; abnormal >0.12) |
| QT interval | ~0.35-0.40 sec (rate dependent) |
| QTc (Bazett) | Men <450 ms; Women <460 ms |
| QRS axis | -30° to +90° |
| P wave | <0.12 sec, <2.5 mm |
PART 15: MEMORY AIDS AND MNEMONICS
- "WiLLiaM MaRRoW" → LBBB = W in V1, M in V6; RBBB = M in V1, W in V6
- "DIRT" → ST Depression = Ischemia, RBBB, Tachycardia (reciprocal)
- "ELEVATION" → ST Elevation in STEMI
- Rate rule of 300: 300-150-100-75-60-50 (1,2,3,4,5,6 large boxes between R waves)
- AV blocks: "Longer, longer, longer, DROP, shorter RP" = Wenckebach/Mobitz I
- Axis: "Thumbs up = normal; Left thumb up, right down = LAD; Left down, right up = RAD"
This guide draws from:
- Guyton and Hall Textbook of Medical Physiology, Chapters 11-12
- Goldman-Cecil Medicine, 27th Edition, Chapter 42
- Harrison's Principles of Internal Medicine, 22nd Edition, Chapter 247
- Costanzo Physiology, 7th Edition, Chapter 4
This is a shared conversation. Sign in to Orris to start your own chat.