
O2 dissociation curve full details for md exams 10 marks
Reading File
Now let me search the library and web simultaneously for comprehensive content.
Finding Sources
Searching the Web
oxygen dissociation curve physiology MD exam detailed notes shifts Bohr effect
Now let me read all three textbook sources in parallel:
Reading File
Reading File
Finding Sources
Excellent content. Let me fetch the key images and get more Guyton content on special hemoglobins and HbF:
Loading Image
Loading Image
Finding Sources
Great - I have both key diagrams and rich textbook content. Let me get more Guyton data on special hemoglobins (HbF, CO, myoglobin) and read more from Fishman's:
Reading File
Reading File
Finding Sources
I now have all the content needed for a thorough MD exam answer. Let me fetch the Fishman's shift diagram as well:
Loading Image
I now have everything needed to write a complete, exam-ready answer. Here it is:
Oxygen Dissociation Curve - Complete MD Exam Notes (10 Marks)
1. Definition
The oxygen dissociation curve (ODC) represents the relationship between the partial pressure of oxygen (PO2) and the percentage saturation of hemoglobin with oxygen (SpO2). It graphically depicts how readily hemoglobin acquires and releases oxygen to tissues.
- Fishman's Pulmonary Diseases and Disorders, p. 256
- Guyton and Hall Textbook of Medical Physiology
2. The Standard Curve - Key Values
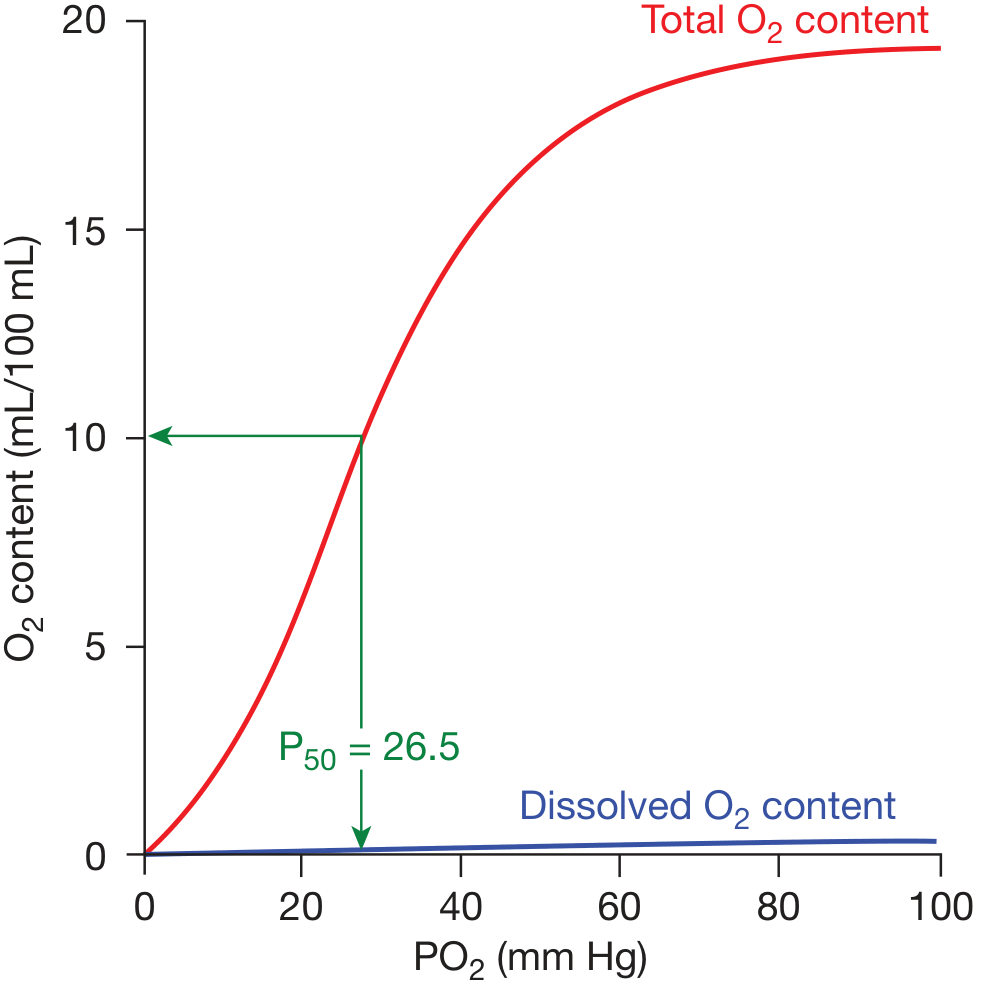
Standard conditions: pH 7.40, temperature 37°C, atmospheric pressure 760 mmHg
| Reference Point | PO2 (mmHg) | Saturation (%) | Clinical Meaning |
|---|---|---|---|
| Arterial blood (lungs) | 100 | 97-98% | Near-full saturation |
| Mixed venous blood (rest) | 40 | ~75% | Only 25% O2 extracted |
| P50 (standard) | 26.5 | 50% | Index of Hb-O2 affinity |
| Tissue capillary threshold | ~60 | ~90% | "Safe" lower limit |
Important: At PO2 ≥60 mmHg, saturation stays above 90% due to the flat upper portion of the curve - this is why significant lung disease can exist without severe desaturation, as long as PO2 stays ≥60 mmHg.
3. Shape of the Curve - Why Sigmoid (S-shaped)?
The curve is sigmoid (S-shaped), not a simple hyperbola, because of cooperative binding (positive cooperativity):
- Hemoglobin is a tetramer (2α + 2β chains), each with one heme group
- Binding of the first O2 molecule causes conformational change: T-state (tense, low affinity) → R-state (relaxed, high affinity)
- Each successive O2 binds with increasing ease - the affinity of remaining heme groups rises progressively
- This is the basis of the sigmoidal shape
- Myoglobin (single subunit) shows a hyperbolic curve - no cooperativity
T-state vs R-state: Deoxygenated Hb is in T-state (tight/tense). Oxygenated Hb adopts the R-state (relaxed). Factors that stabilize the T-state (acid, CO2, 2,3-DPG, high temperature) reduce O2 affinity and shift the curve right.
4. Functional Significance of the Sigmoid Shape
The curve has two physiologically important regions:
A. Upper flat portion (PO2 60-100 mmHg) - Lungs:
- Small drops in alveolar PO2 cause minimal change in saturation
- Ensures near-complete loading of Hb with O2 even at altitude or with mild lung disease
- "Safety buffer" in O2 loading
B. Steep portion (PO2 20-60 mmHg) - Tissues:
- Large amounts of O2 are unloaded with small drops in PO2
- Venous PO2 at rest is ~40 mmHg (75% saturation)
- During exercise, tissue PO2 falls further, releasing even more O2
- Ensures efficient O2 delivery to metabolizing tissues
5. P50 - The Key Index
- P50 = the PO2 at which hemoglobin is 50% saturated
- Normal P50 = 26.5 mmHg (standard conditions)
- Increased P50 = right shift = decreased Hb-O2 affinity = better O2 delivery to tissues
- Decreased P50 = left shift = increased Hb-O2 affinity = better O2 loading in lungs but reduced tissue delivery
6. Factors Shifting the Curve
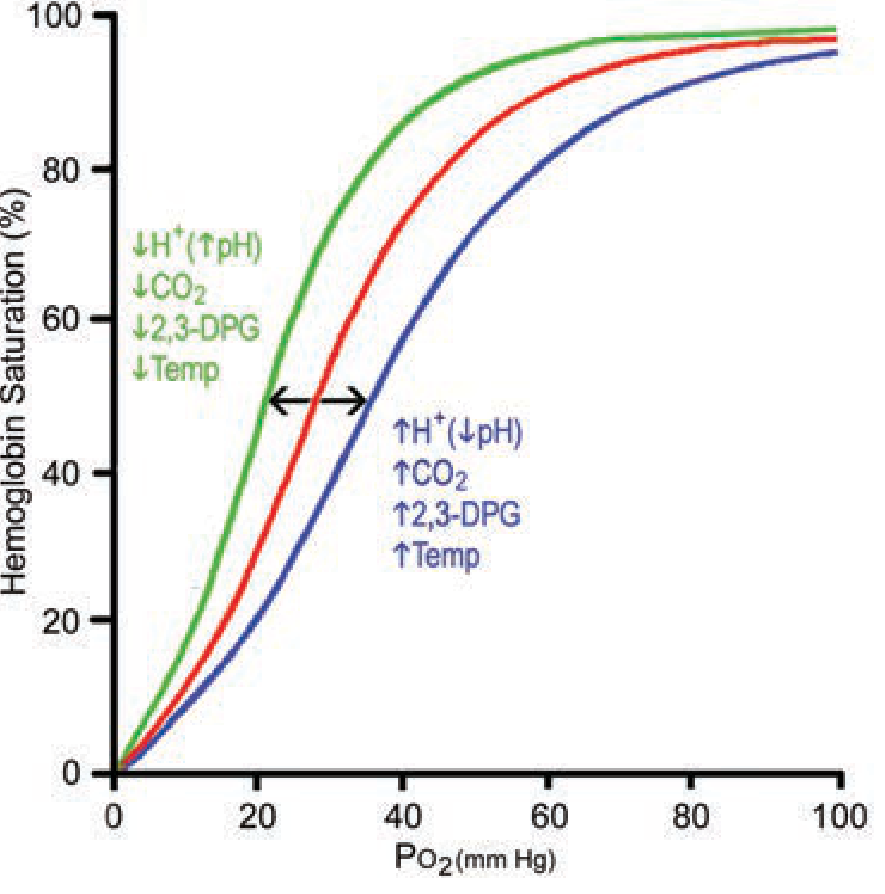
RIGHT SHIFT (Increased P50 - Decreased O2 affinity - More O2 delivered to tissues)
Mnemonic: CADET - CO2, Acid, DPG, Exercise, Temperature
| Factor | Mechanism |
|---|---|
| ↑ CO2 (↑ PCO2) | Carbamino compounds form; CO2 → H2CO3 → H+ (Bohr effect) |
| ↑ H+ (↓ pH, acidosis) | H+ binds β-chain histidines → stabilizes T-state |
| ↑ 2,3-DPG | Binds β-chains, stabilizes deoxy-Hb (T-state) |
| ↑ Temperature | Weakens Hb-O2 bond |
| ↑ ADP / Exercise | Combination of all the above |
LEFT SHIFT (Decreased P50 - Increased O2 affinity - Better O2 loading)
| Factor | Clinical Example |
|---|---|
| ↓ CO2 | Hyperventilation, lungs |
| ↓ H+ (↑ pH, alkalosis) | Respiratory alkalosis |
| ↓ 2,3-DPG | Stored blood, hypothyroidism |
| ↓ Temperature | Hypothermia, stored blood |
| Fetal Hb (HbF) | HbF has reduced DPG binding |
| COHb (Carbon monoxide) | CO shifts remaining curve left |
| Methemoglobin | Oxidized Fe3+ - left shift |
7. The Bohr Effect (Most Important Right-Shift Mechanism)
Named after Christian Bohr (1904):
Hemoglobin's affinity for O2 decreases with increasing CO2 and H+ concentration.
At the tissues:
- Metabolizing cells produce CO2 → diffuses into blood
- CO2 + H2O → H2CO3 → H+ + HCO3- (catalyzed by carbonic anhydrase)
- Rising CO2 and H+ shift the curve right
- Hb releases more O2 to the tissues
At the lungs:
- CO2 diffuses out into alveoli
- PCO2 and H+ fall in blood
- Curve shifts left
- Hb picks up O2 more avidly
The Bohr effect is a self-regulating feedback mechanism that automatically matches O2 delivery to metabolic demand.
- Guyton and Hall, p. 526
8. Role of 2,3-Diphosphoglycerate (2,3-DPG)
- Produced in red blood cells via glycolysis (Rapoport-Luebering pathway)
- Normal concentration: ~5 mM
- Binds the positively charged central cavity between the β-chains of deoxy-Hb (T-state)
- The β-chains are more widely separated in deoxygenated state, allowing DPG entry
- Stabilizes T-state → reduces O2 affinity → right shift
Clinical importance of 2,3-DPG changes:
| Condition | 2,3-DPG | P50 | Effect |
|---|---|---|---|
| High altitude | ↑ | ↑ | Adaptive right shift - more O2 released |
| Anemia | ↑ | ↑ | Compensatory O2 unloading |
| Hypoxemia (chronic) | ↑ | ↑ | Adaptation |
| Stored blood (bank blood) | ↓ | ↓ | Left shift - impaired O2 delivery |
| Hypothyroidism | ↓ | ↓ | Reduced DPG synthesis |
HbF and DPG: Fetal hemoglobin (α2γ2) has γ-chains that cannot bind 2,3-DPG effectively (unlike adult β-chains). This keeps HbF's curve to the left - HbF has higher O2 affinity (P50 ~19 mmHg vs 26.5 mmHg), allowing the fetus to extract O2 from maternal blood at the placenta.
- Fishman's Pulmonary Diseases and Disorders, p. 256
9. Shift During Exercise
During vigorous exercise, multiple factors simultaneously shift the curve to the right:
- ↑ CO2 from working muscles
- ↑ Lactic acid → ↓ pH
- ↑ Muscle temperature (2-3°C rise)
- ↑ 2,3-DPG
This allows O2 to be released to muscle even at PO2 as high as 40 mmHg, even when 70% of O2 has already been extracted. The lungs show the reverse - efficient reloading of O2.
10. Special Hemoglobins and Their Curves
| Hemoglobin | Curve | P50 | Key Feature |
|---|---|---|---|
| Adult HbA (α2β2) | Sigmoid | 26.5 mmHg | Normal |
| Fetal HbF (α2γ2) | Sigmoid (left) | ~19 mmHg | Poor DPG binding → O2 extraction from mother |
| Myoglobin | Hyperbolic (extreme left) | ~1 mmHg | O2 storage in muscle, single subunit - no cooperativity |
| COHb (CO poisoning) | Left shift | ↓ | CO has 240x affinity vs O2; remaining curve shifts left |
| MetHb | Left shift | ↓ | Fe3+ cannot bind O2; remaining sites shift left |
| HbS (Sickle cell) | Right shift | ↑ | Reduced O2 affinity |
Carbon monoxide has a dual harmful effect:
- Reduces functional Hb available (functional anemia)
- Left-shifts remaining curve → impairs O2 delivery to tissues
- Fishman's Pulmonary Diseases and Disorders, p. 256
11. Oxygen Content of Blood (Fick Equation Context)
Total O2 content = Dissolved O2 + Hb-bound O2
CaO2 = (Hb × 1.34 × SaO2) + (0.003 × PaO2)
- 1.34 mL O2 per gram Hb (Hüfner's constant)
- 0.003 = solubility coefficient for O2 in plasma
- At Hb = 15 g/dL: total O2 content ≈ 20 mL/100 mL
- Dissolved O2 is normally minimal but becomes critical in hyperbaric conditions
12. Clinical Applications (High-Yield for MD Exams)
| Clinical Scenario | Shift | Mechanism | Net Effect |
|---|---|---|---|
| Exercise | Right | ↑CO2, ↓pH, ↑temp, ↑DPG | ↑O2 delivery to muscles |
| Altitude acclimatization | Right | ↑2,3-DPG (within hours) | Adaptation to hypoxia |
| Stored blood transfusion | Left | ↓2,3-DPG | Impaired O2 delivery after transfusion |
| Carbon monoxide poisoning | Left | COHb | Tissue hypoxia despite normal PO2 |
| Hypothermia | Left | ↓temp | Hb holds onto O2 more tightly |
| Metabolic acidosis | Right | ↑H+ | More O2 released to tissues |
| Respiratory alkalosis (hyperventilation) | Left | ↓PCO2, ↑pH | Tetany risk - O2 not released |
| Septic shock | Right | ↓pH, ↑temp, ↑DPG | Protective - ↑O2 unloading |
13. Summary Table - Exam Quick Reference
| Factor | Right Shift (↑P50) | Left Shift (↓P50) |
|---|---|---|
| pH | Acidosis (↓pH) | Alkalosis (↑pH) |
| CO2 | Increased | Decreased |
| Temperature | Increased | Decreased |
| 2,3-DPG | Increased | Decreased |
| Hemoglobin type | HbS, adult HbA | HbF, Myoglobin |
| CO | - | COHb (left shift) |
| Effect | ↓ Hb-O2 affinity → ↑ tissue O2 delivery | ↑ Hb-O2 affinity → ↑ lung O2 loading |
Sources: Guyton and Hall Textbook of Medical Physiology; Fishman's Pulmonary Diseases and Disorders; Lippincott Biochemistry; Murray & Nadel's Respiratory Medicine
This is a shared conversation. Sign in to Orris to start your own chat.