
Explain me 10 common heart diseases with ECG changes and ECG images of those diseases
Reading File
Now let me search the library for ECG-related content across multiple heart diseases simultaneously.
Finding Sources
Finding Sources
Searching the Web
ECG changes 10 common heart diseases images atrial fibrillation MI heart block
Now let me read the key textbook sections and search for ECG images across multiple diseases in parallel.
Reading File
Finding Sources
Finding Sources
Reading File
Reading File
Finding Sources
Finding Sources
Now let me fetch the key ECG images from the textbook and search for more ECG images across other diseases:
Loading Image
Loading Image
Finding Sources
Finding Sources
Reading File
Reading File
Searching the Web
ECG images heart block ventricular tachycardia hypertrophic cardiomyopathy long QT syndrome brugada wikimedia commons
Excellent! Now let me fetch more ECG images from the textbooks and web in parallel:
Loading Image
Loading Image
Loading Image
Searching the Web
complete heart block third degree AV block ECG image ventricular tachycardia ECG wikimedia
Loading Image
Loading Image
Loading Image
Searching the Web
atrial flutter ECG sawtooth pattern WPW Wolf Parkinson White ECG delta wave image site:wikimedia.org OR site:litfl.com
Loading Image
Loading Image
I now have comprehensive textbook content and ECG images. Let me compile the complete, well-illustrated answer.
10 Common Heart Diseases: ECG Changes and Images
Here is a comprehensive guide to the ECG findings in 10 major cardiac conditions, drawing from Harrison's Principles of Internal Medicine (22nd Ed.), Guyton & Hall Medical Physiology, Braunwald's Heart Disease, and other authoritative textbooks.
1. Acute Myocardial Infarction (STEMI / NSTEMI)
What it is: Occlusion of a coronary artery causing myocardial necrosis. ECG changes depend on whether the infarct is transmural (STEMI) or subendocardial (NSTEMI).
ECG Changes:
- Hyperacute phase: Tall, broad (hyperacute) T waves - the earliest sign
- Acute phase (STEMI): ST-segment elevation in leads over the infarcted zone (e.g., V1-V4 for anterior wall; II, III, aVF for inferior wall). Reciprocal ST depression in opposite leads.
- NSTEMI: ST depression and T-wave inversions without ST elevation. Troponin is elevated.
- Evolving phase: T-wave inversions develop in the same leads
- Q-wave formation: Pathological Q waves (width >40 ms, depth >25% of R wave) represent dead myocardium - may persist permanently
- Localizing the infarct: Anterior (V1-V4), Lateral (I, aVL, V5-V6), Inferior (II, III, aVF), Posterior (tall R in V1-V2 with ST depression)
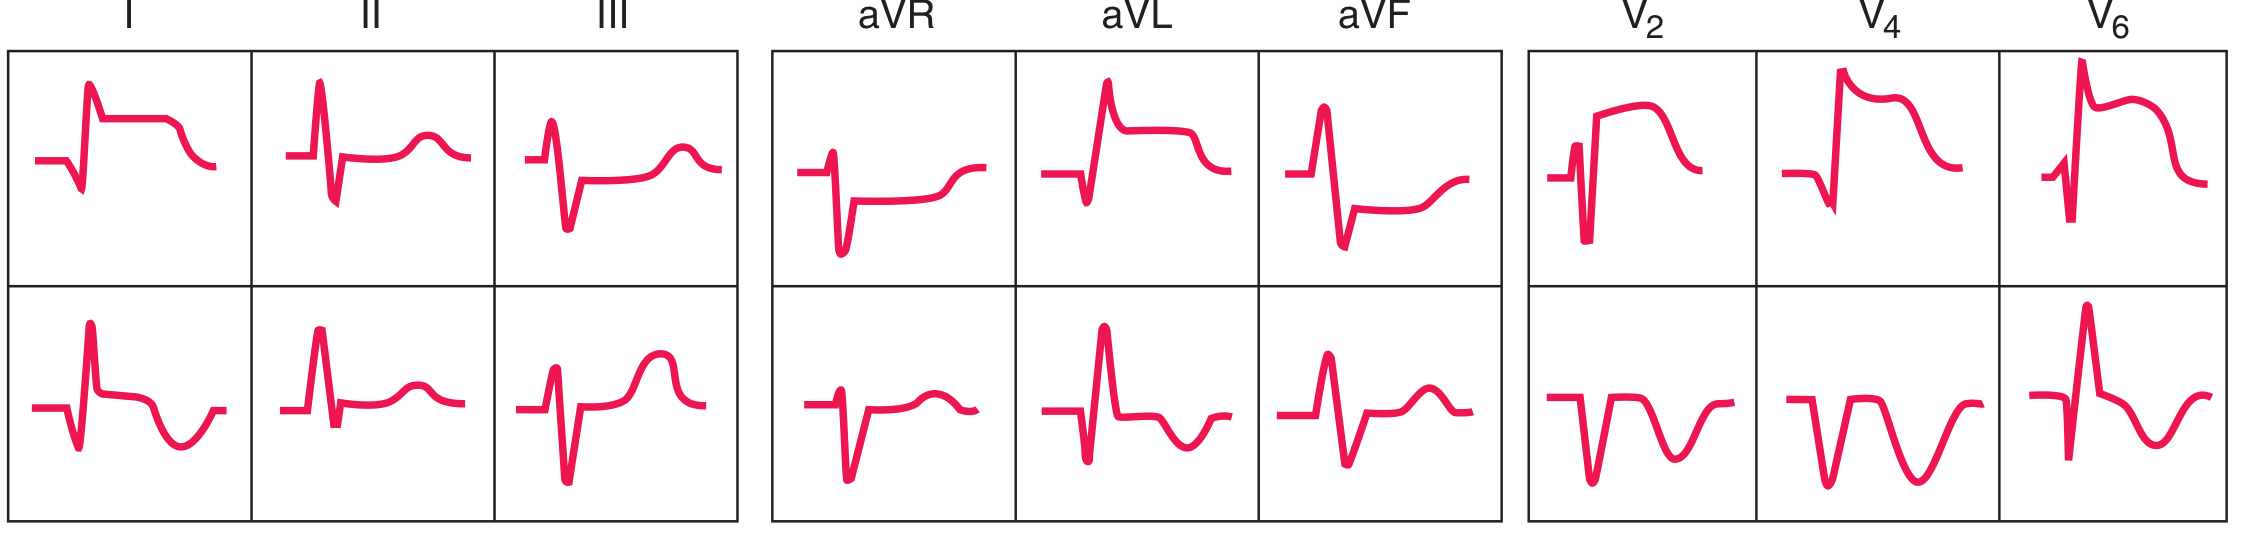
ECG sequence with anterior ST-elevation/Q-wave infarction. Top row = Acute phase (ST elevation); Bottom row = Evolving phase (T-wave inversions, Q waves). Leads I, II, III, aVR, aVL, aVF, V2, V4, V6 shown. - Harrison's Principles of Internal Medicine 22E, Fig. 247-13
2. Atrial Fibrillation (AF)
What it is: The most common sustained arrhythmia, caused by chaotic, disorganized electrical activity throughout the atria. Multiple re-entrant wavelets replace organized atrial depolarization.
ECG Changes:
- No discernible P waves - replaced by chaotic, low-amplitude fibrillatory (f) waves at 350-600 bpm
- Irregularly irregular R-R intervals - the hallmark finding (ventricular response is unpredictable)
- Normal QRS morphology (unless aberrant conduction or pre-existing bundle branch block)
- Ventricular rate typically 100-160 bpm (rapid ventricular response) if untreated
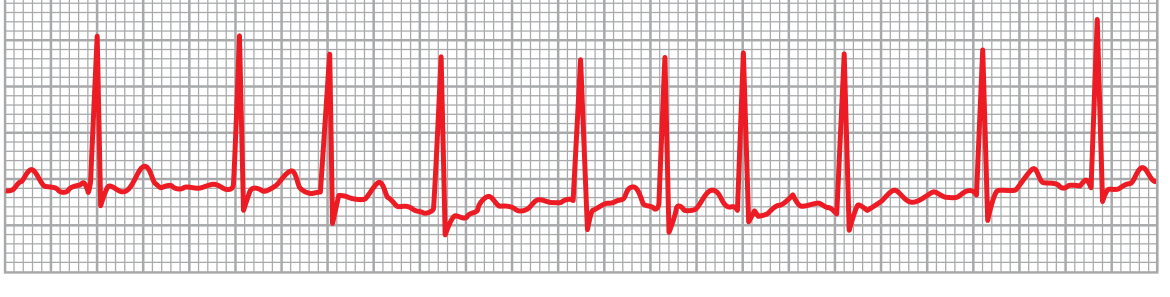
Atrial fibrillation (lead II). Only ventricular QRS and T waves are visible. The rhythm is irregularly irregular with no P waves - the fibrillatory baseline replaces organized atrial activity. - Guyton & Hall Medical Physiology, Fig. 13.20
3. Atrial Flutter
What it is: A macro-reentrant atrial tachycardia, typically circling around the tricuspid valve annulus (cavotricuspid isthmus-dependent).
ECG Changes:
- Sawtooth flutter waves (F waves) at 250-350 bpm - most visible in leads II, III, aVF and V1
- Regular atrial activity (unlike AF)
- Fixed AV block ratio - most commonly 2:1, giving ventricular rate ~150 bpm; also 3:1, 4:1
- QRS complexes are normal unless aberrant conduction exists
- Flutter waves may be partially hidden within QRS or T waves
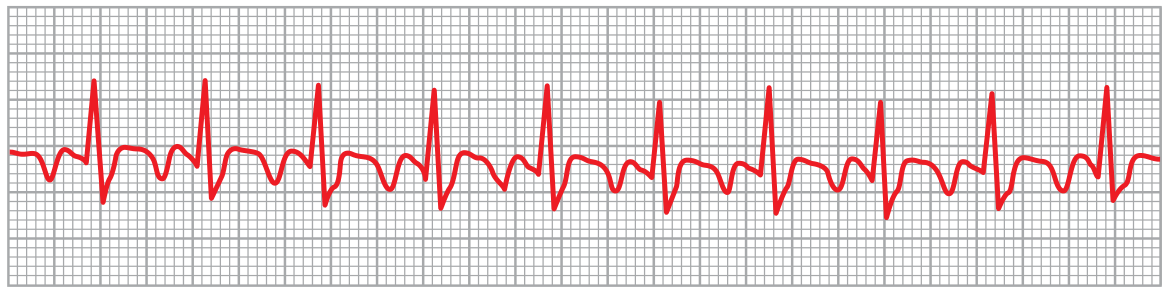
Atrial flutter (lead II). The sawtooth flutter waves are visible between QRS complexes. The atrial rate is ~300 bpm with a 2:1 AV conduction ratio. - Guyton & Hall Medical Physiology, Fig. 13.21
4. Complete (Third-Degree) Heart Block
What it is: Complete interruption of conduction between atria and ventricles. The atria and ventricles beat independently (AV dissociation). Caused by ischemia, degenerative disease, infiltrative disorders, or drug toxicity.
ECG Changes:
- P waves and QRS complexes are completely dissociated - P waves "march through" at their own rate (60-100 bpm), QRS complexes beat at their own escape rate
- Atrial rate > Ventricular rate always
- Escape rhythm depends on block location:
- Junctional escape (narrow QRS, 40-60 bpm) = block at AV node
- Ventricular escape (wide QRS, 20-40 bpm) = block below bundle of His
- Bradycardia is prominent

Complete (third-degree) heart block. P waves (atrial activity) are completely dissociated from QRS complexes (ventricular escape beats). The P-P intervals are regular, the R-R intervals are regular, but there is no relationship between them. - Wikimedia Commons (CC BY-SA 3.0)
5. Left Ventricular Hypertrophy (LVH)
What it is: Thickening of the left ventricular wall due to chronic pressure overload (hypertension, aortic stenosis) or volume overload. The increased muscle mass generates larger electrical forces.
ECG Changes:
- Voltage criteria: Sokolow-Lyon: S in V1 + R in V5 or V6 ≥35 mm; Cornell: R in aVL + S in V3 ≥28 mm (men) or ≥20 mm (women)
- Left axis deviation (QRS axis between -30° and -90°)
- Prolonged QRS duration (may approach 110 ms)
- Strain pattern: ST-segment depression and asymmetric T-wave inversion in I, aVL, V5-V6 (the "strain" pattern, actually a repolarization abnormality)
- Left atrial enlargement pattern (broad, notched P waves in lead II; biphasic P in V1 with prominent terminal negative component)
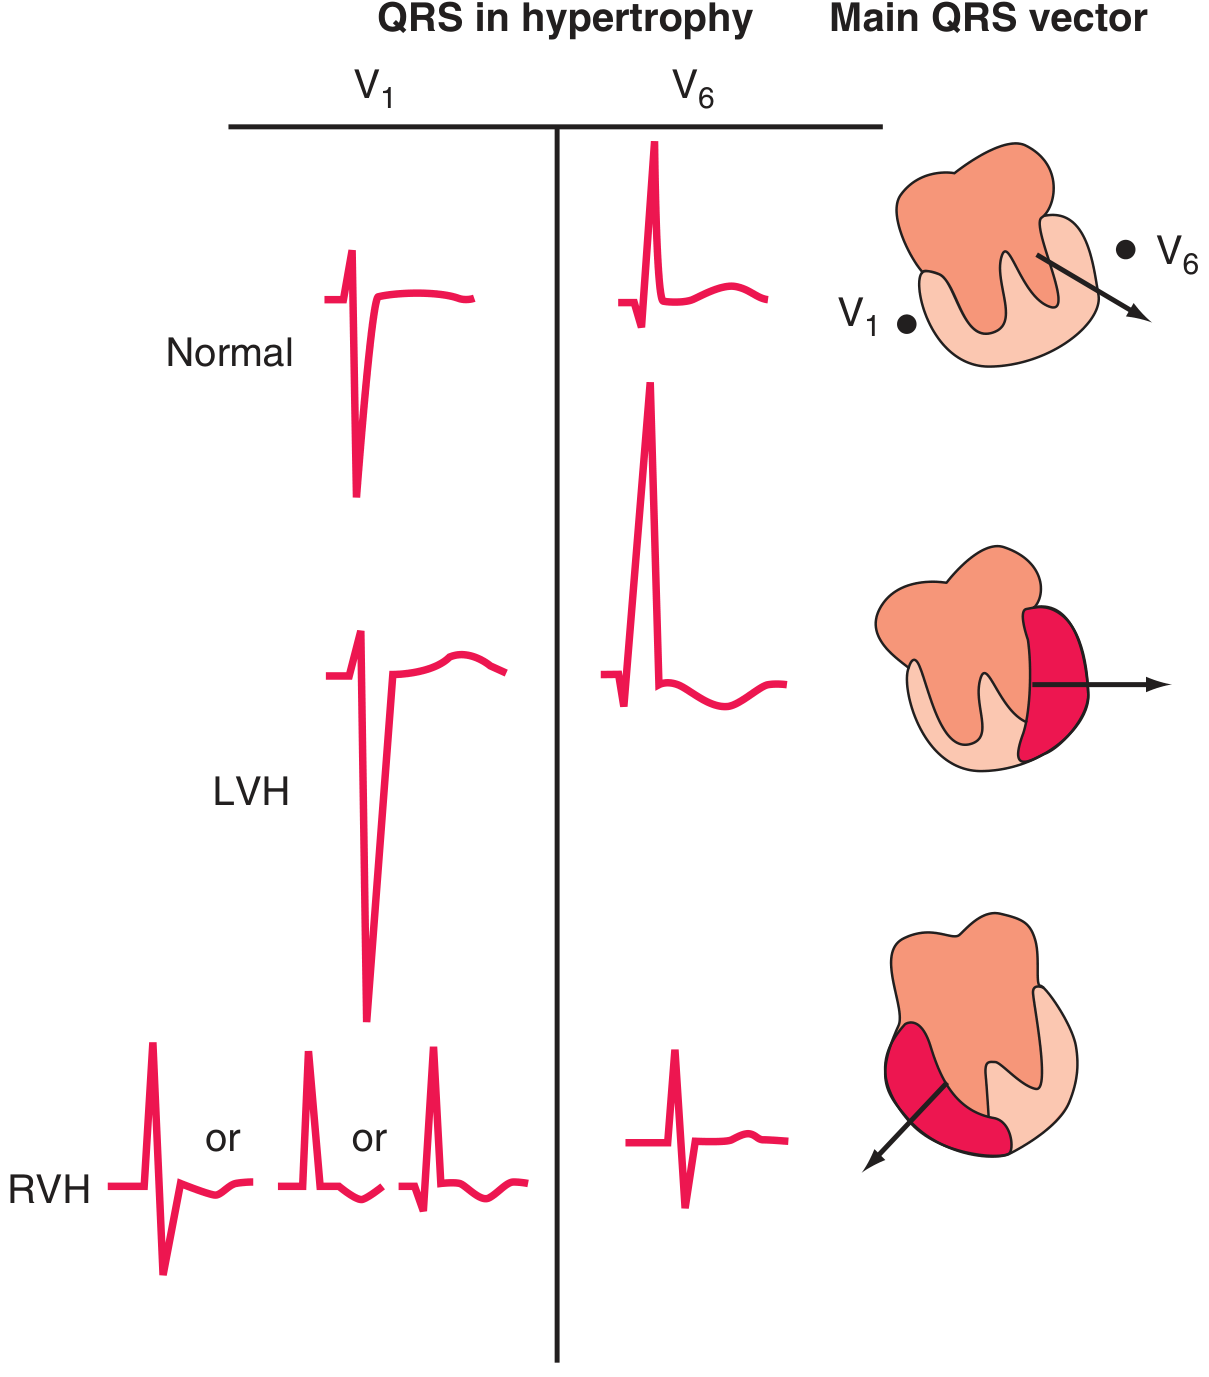
LVH vs. RVH ECG patterns (V1 and V6 shown). LVH (middle): Deep S in V1, tall R in V6. RVH (bottom): Dominant R in V1, small S in V6 with rightward QRS axis. - Harrison's Principles of Internal Medicine 22E, Fig. 247-9
6. Ventricular Tachycardia (VT)
What it is: A rapid, potentially life-threatening arrhythmia originating in the ventricular myocardium or His-Purkinje system, bypassing normal conduction. Common in ischemic heart disease, cardiomyopathy, and channelopathies.
ECG Changes:
- Wide QRS complex (≥120 ms) - the defining feature; results from abnormal ventricular depolarization sequence
- Rate: 100-250 bpm (sustained VT >30 seconds)
- AV dissociation: P waves and QRS complexes are independent - seen in ~50% of VT cases; pathognomonic when present
- Fusion beats (QRS morphology between sinus and ectopic = simultaneous activation from both)
- Capture beats (narrow QRS = conducted sinus beat "capturing" ventricle during VT)
- Concordance: All precordial leads positive (positive concordance) or all negative (negative concordance) - strongly suggests VT
- QRS morphology helps locate the origin
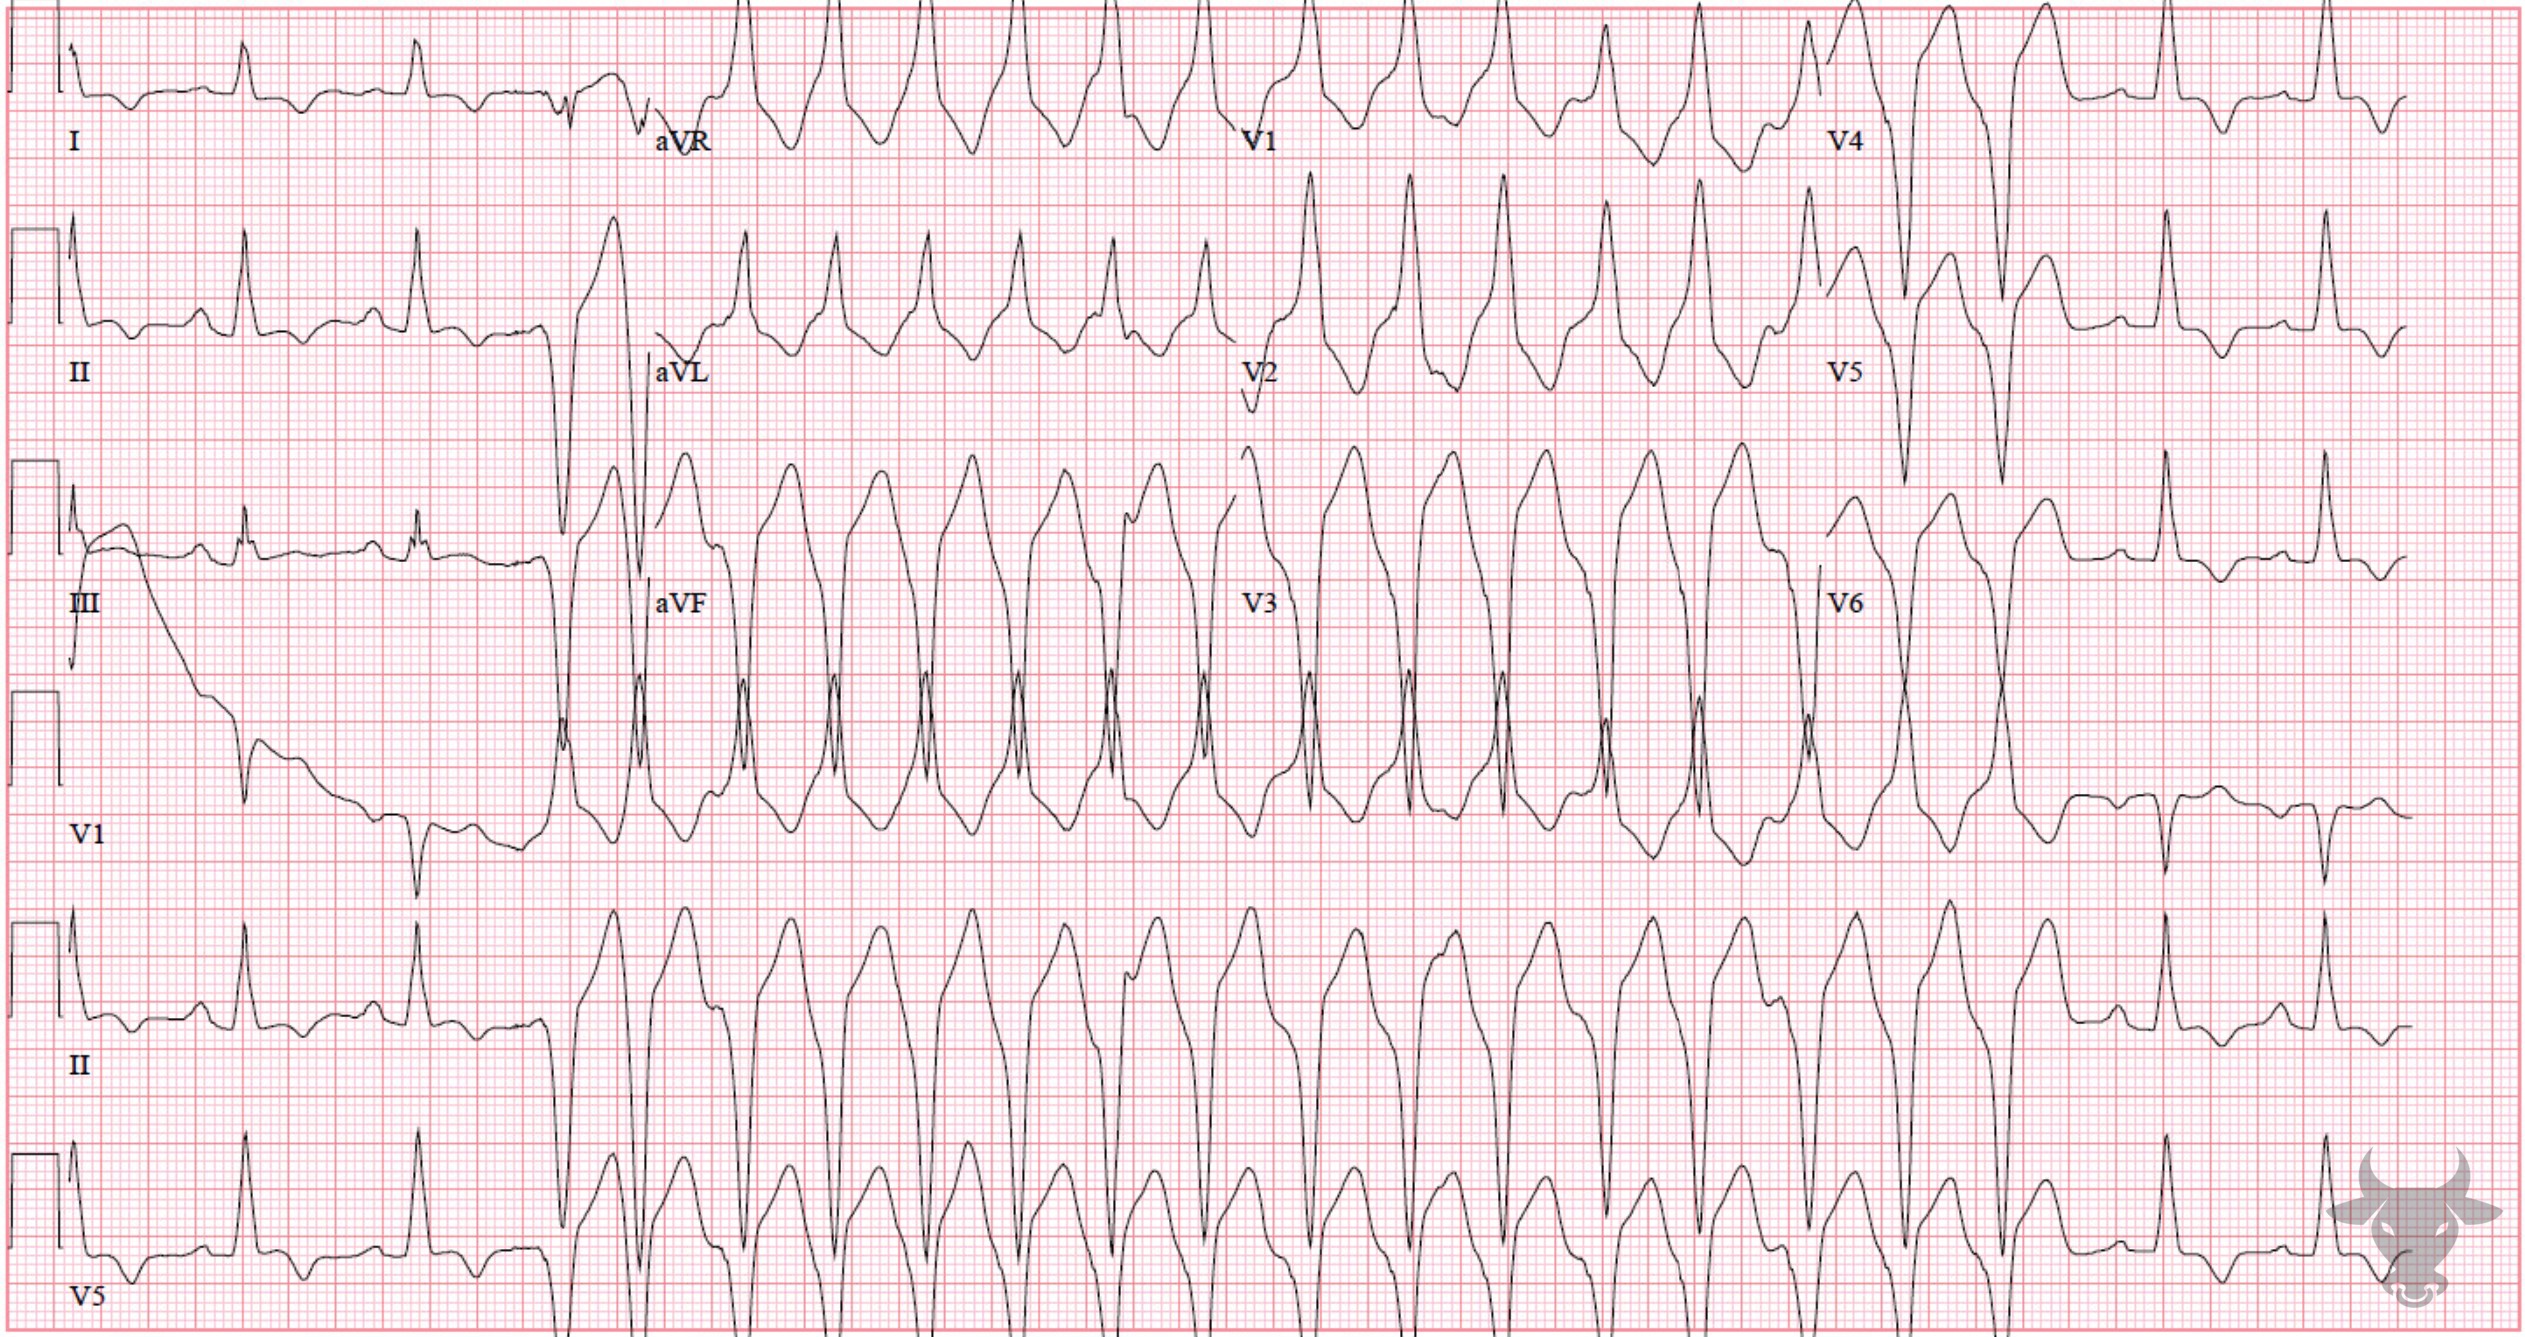
Ventricular tachycardia 12-lead ECG. Wide-complex tachycardia at ~200 bpm. Note the broad, bizarre QRS complexes with AV dissociation visible in some leads. - ECG Stampede
7. Wolff-Parkinson-White Syndrome (WPW)
What it is: A pre-excitation syndrome caused by an accessory atrioventricular pathway (Bundle of Kent) that bypasses the AV node, allowing early ventricular activation. The conducting accessory pathway creates a characteristic resting ECG pattern and can cause life-threatening tachycardias.
ECG Changes (classic triad in sinus rhythm):
- Short PR interval (<120 ms) - AV node delay is bypassed
- Delta wave - slurred upstroke of the QRS complex representing early (pre-excited) ventricular activation
- Wide QRS (>120 ms) - fusion of normal His-Purkinje conduction + pre-excitation via accessory pathway
- Secondary ST-T changes (discordant T waves) due to abnormal depolarization sequence
- "Pseudo-infarction" patterns (negative delta waves can simulate Q waves)
- During tachycardia: orthodromic AVRT (narrow QRS), antidromic AVRT (wide QRS), or AF with rapid pre-excited conduction (rates >250 bpm - very dangerous)
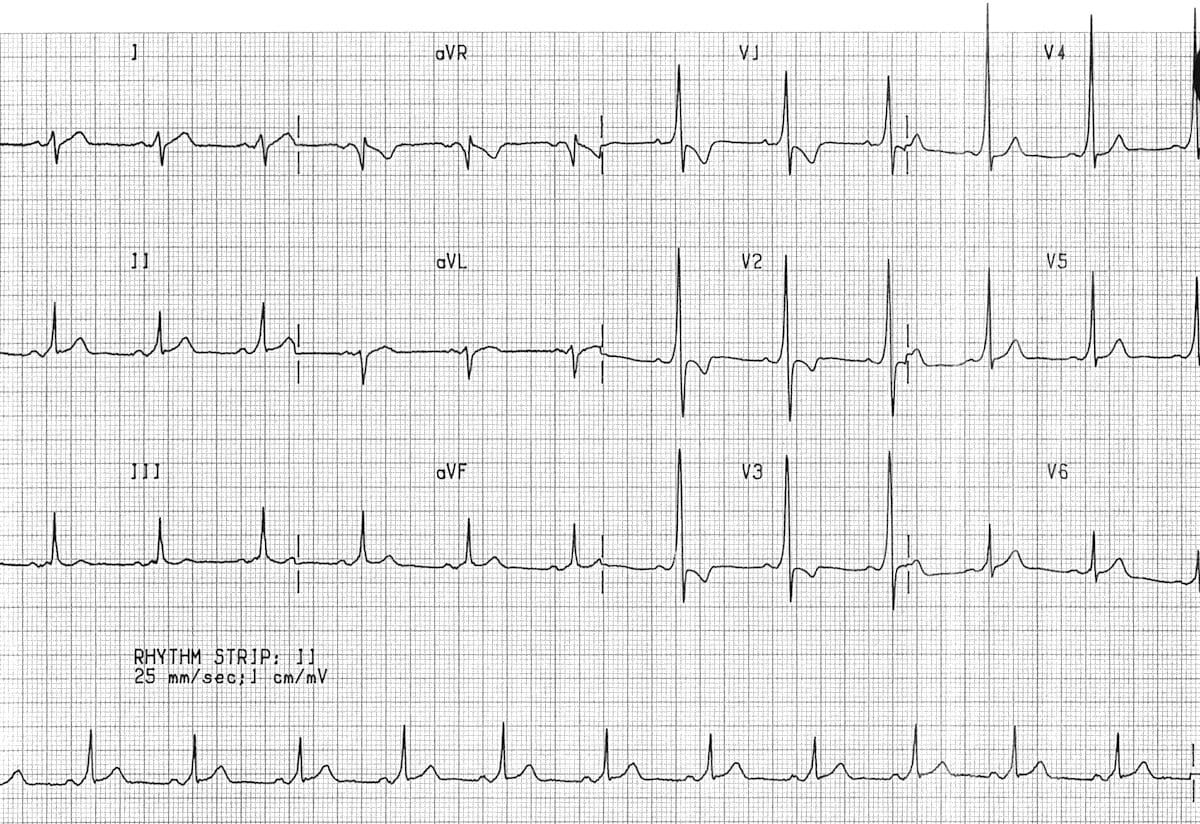
Type A WPW syndrome. Short PR interval, prominent delta waves (best seen in V1-V3 as broad initial upstroke), and widened QRS complexes throughout all leads. - LITFL ECG Library
8. Hypertrophic Cardiomyopathy (HCM)
What it is: A genetic condition (autosomal dominant mutations in sarcomere proteins, most commonly MYH7 and MYBPC3) causing asymmetric myocardial hypertrophy, often with outflow tract obstruction. The leading cause of sudden cardiac death in young athletes.
ECG Changes:
- LVH voltage criteria - very common (in ~75-95%)
- Abnormal, deep Q waves - especially in lateral leads (I, aVL, V5-V6) and inferior leads, representing septal depolarization abnormalities
- Widespread ST-T changes and T-wave inversions - particularly deep T-wave inversions in lateral precordial leads
- Left axis deviation
- Left atrial enlargement (broad, notched P waves)
- Ventricular pre-excitation (delta waves) occasionally
- Giant negative T waves (Yamaguchi variant) in apical HCM - deeply inverted T waves in V3-V6 that may exceed -10 mm
- Atrial fibrillation frequently occurs
- The ECG is abnormal in ~90% of HCM patients but is non-specific
9. Long QT Syndrome (LQTS)
What it is: A disorder of cardiac repolarization (congenital or acquired) causing prolonged ventricular repolarization and risk of polymorphic VT (Torsades de Pointes), syncope, and sudden death. Congenital forms: LQTS1 (KCNQ1), LQTS2 (KCNH2), LQTS3 (SCN5A). Acquired: drugs, hypokalemia, hypomagnesemia.
ECG Changes:
- Prolonged QTc interval:
- Normal: <440 ms (men), <460 ms (women) [Bazett's formula: QTc = QT/√RR]
- Borderline: 440-470 ms
- Abnormal (LQTS): >470 ms (men), >480 ms (women)
- High risk for TdP: >500 ms
- T-wave morphology varies by subtype:
- LQTS1: Broad-based, smooth T waves (best seen in V5-V6)
- LQTS2: Low-amplitude, notched or bifid T waves
- LQTS3: Long isoelectric ST segment followed by a narrow, peaked T wave
- Torsades de Pointes (TdP): Polymorphic VT with a characteristic "twisting" of QRS axis around the baseline - the dangerous arrhythmia precipitated by LQTS
10. Pulmonary Embolism (PE)
What it is: Obstruction of the pulmonary arterial system, causing acute right heart strain. ECG changes reflect acute right ventricular pressure overload.
ECG Changes:
- Sinus tachycardia - the most common and often the only ECG finding
- S1Q3T3 pattern (classic but present in <20% of cases): prominent S wave in lead I, pathological Q wave in lead III, inverted T wave in lead III
- Right axis deviation - new rightward shift of QRS axis
- New right bundle branch block (RBBB) - complete or incomplete
- T-wave inversions in V1-V4 - from right ventricular strain; a common and sensitive finding
- Right heart strain pattern (RAD + RBBB + T inversions V1-V4) suggests massive PE
- Atrial fibrillation or flutter may occur
- P pulmonale (peaked P waves >2.5 mm in lead II) from right atrial dilation
- A normal ECG does not exclude PE
From Harrison's: "Acute cor pulmonale due to pulmonary thromboembolism may be associated with a normal ECG or a variety of abnormalities. Sinus tachycardia is the most common arrhythmia...The QRS axis may shift to the right, sometimes in concert with the so-called S₁Q₃T₃ pattern."
Quick Reference Summary Table
| Disease | Key ECG Pattern | Pathognomonic Feature |
|---|---|---|
| STEMI | ST elevation in regional leads | Hyperacute T waves → ST rise → Q waves |
| NSTEMI | ST depression, T inversions | No ST elevation; troponin required |
| Atrial Fibrillation | Absent P waves, irregular R-R | Irregularly irregular rhythm |
| Atrial Flutter | Sawtooth F waves at 300 bpm | 2:1 AV block, ventricular rate ~150 |
| Complete Heart Block | AV dissociation | P rate > QRS rate, no relationship |
| LVH | High voltage + strain pattern | Sokolow-Lyon ≥35 mm |
| Ventricular Tachycardia | Wide complex tachycardia | AV dissociation + fusion beats |
| WPW | Short PR + delta wave + wide QRS | Delta wave (slurred QRS upstroke) |
| HCM | Deep Q waves + LVH + T inversions | Lateral deep Q waves in young patient |
| Long QT Syndrome | Prolonged QTc | QTc >500 ms; risk of Torsades |
| Pulmonary Embolism | Sinus tachycardia + S1Q3T3 | New RBBB + T inversions V1-V4 |
Sources:
- Harrison's Principles of Internal Medicine 22E (2025), Figs. 247-9, 247-11, 247-12, 247-13
- Guyton & Hall Textbook of Medical Physiology, Figs. 13.20-13.21
- Braunwald's Heart Disease, 2-Vol Set
- Goldman-Cecil Medicine, International Edition
- Washington Manual of Medical Therapeutics
Clinical note: ECG is a screening and diagnostic tool. Always correlate with clinical history, physical examination, and biomarkers (troponin, BNP). A single normal ECG never excludes cardiac pathology.
This is a shared conversation. Sign in to Orris to start your own chat.