
Teach me. Everything I need to know. From the chapter. Sepsis and septic shock. You can use Harrison's. Latest edition. And all the other sources in the world. So ca- I can understand in a better way. You can also include images. And short forms. And at the end, you can add summary.
sepsis pathophysiology diagram cytokine cascade
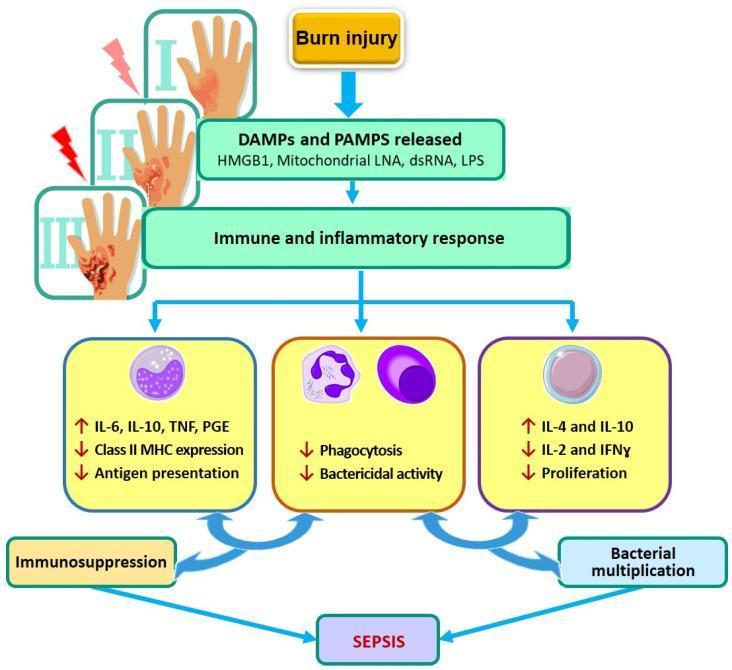
A pathophysiology flow diagram illustrating the immunological cascade from severe burn injury to the development of sepsis. The diagram begins with a burn injury, represented by illustrations of first-, second-, and third-degree burns on a hand, leading to the systemic release of Damage-Associated Molecular Patterns (DAMPs) and Pathogen-Associated Molecular Patterns (PAMPs), specifically citing HMGB1, mitochondrial LNA, dsRNA, and LPS. This initiates a complex immune and inflammatory response characterized by three convergent pathways: 1) Pro-inflammatory and anti-inflammatory cytokine imbalances (increased IL-6, IL-10, TNF, and PGE) alongside reduced Class II MHC expression and antigen presentation, leading to immunosuppression. 2) Impaired innate cellular function, specifically decreased phagocytosis and bactericidal activity. 3) Th2-skewed cytokine shifts (increased IL-4 and IL-10; decreased IL-2 and IFN̲γ) and reduced lymphocyte proliferation, promoting bacterial multiplication. These combined dysregulated host responses ultimately culminate in burn-induced sepsis.
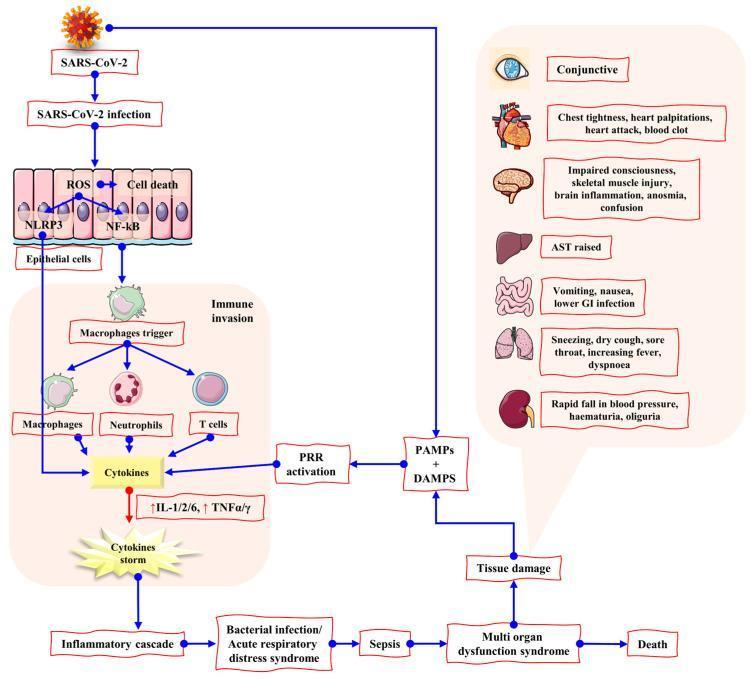
A medical illustration detailing the pathophysiology of SARS-CoV-2 infection leading to cytokine storm and multi-organ dysfunction syndrome (MODS). The left panel outlines a cellular pathway: infection of epithelial cells triggers ROS production, cell death, and activation of NLRP3 and NF-κB. This leads to an 'immune invasion' involving macrophages, neutrophils, and T cells, which release pro-inflammatory cytokines (IL-1, IL-2, IL-6, TNFα/γ). The resulting 'cytokine storm' drives an inflammatory cascade toward ARDS, sepsis, and MODS. A parallel pathway links PAMPs/DAMPs and PRR activation directly to tissue damage. The right panel displays organ-specific clinical manifestations: neurologic (anosmia, impaired consciousness), cardiovascular (chest tightness, heart attack), respiratory (dyspnoea, dry cough), gastrointestinal (vomiting, nausea), renal (haematuria, oliguria), and hepatic (raised AST). The progression culminates in a terminal stage labeled 'Death.' The diagram is designed for intermediate medical education, emphasizing the systemic inflammatory nature of COVID-19.
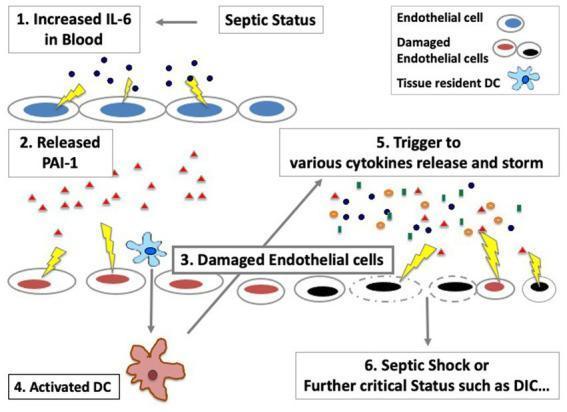
This pathophysiology diagram illustrates the sequential progression of endothelial cell damage and immune activation during sepsis. The process begins with 'Septic Status' leading to (1) increased IL-6 in the blood (blue dots). This triggers (2) the release of PAI-1 (red triangles), affecting the endothelium. (3) Endothelial cell damage is represented by a color transition from healthy blue-outlined cells to red-outlined (intermediate damage) and finally black-outlined/solid black cells (severe damage). This cellular injury leads to (4) the activation of tissue-resident dendritic cells (DC) and (5) a trigger for a massive cytokine storm, visualized as a dense cluster of multi-colored symbols. The cumulative effect of the endothelial dysfunction and cytokine release culminates in (6) septic shock or further critical status such as Disseminated Intravascular Coagulation (DIC). The diagram emphasizes the maintenance role of endothelial cells in cytokine signaling pathways and the development of coagulation system disorders.
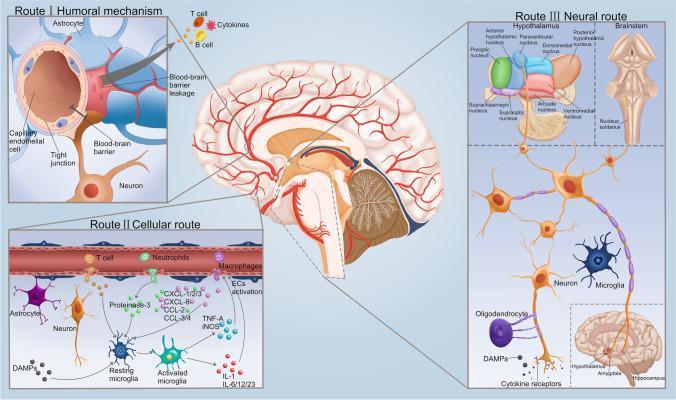
A medical pathophysiology diagram illustrating three primary routes by which cytokines and inflammatory signals enter the brain from the systemic circulation, specifically in the context of sepsis. Route I (Humoral mechanism) depicts the breakdown of the blood-brain barrier (BBB), showing capillary endothelial cells with disrupted tight junctions, allowing T cells, B cells, and cytokines to leak into the parenchyma near astrocytes and neurons. Route II (Cellular route) details the infiltration of peripheral immune cells, including neutrophils and macrophages, and the activation of cerebral endothelial cells (ECs). This section highlights the transition of resting microglia to activated microglia, mediated by DAMPs and proteinase-3, leading to the release of pro-inflammatory mediators such as TNF-alpha, iNOS, interleukins (IL-1, IL-6/12/23), and various chemokines (CXCL and CCL families). Route III (Neural route) illustrates the transmission of cytokine signals via autonomic nerve fibers and cytokine receptors, particularly affecting the hypothalamus, brainstem nuclei (nucleus solitarius), amygdala, and hippocampus. The central illustration provides anatomical context within a sagittal view of the human brain, mapping these pathways to specific neuroanatomical structures.
"sepsis" AND "septic shock" AND "management"
septic shock hemodynamic management vasopressors
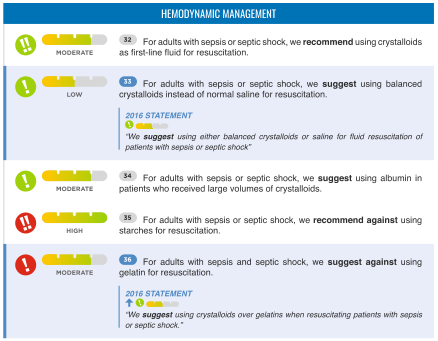
Summary : This figure presents recommendations for hemodynamic management in adults with sepsis or septic shock, focusing on the use of various fluids for resuscitation. It includes five guideline statements, each with a strength of recommendation, quality of evidence, and relevant 2016 statements for comparison. flowchart/table hybrid: # Recommendations Overview : • Five numbered recommendations (32–36) for fluid resuscitation in sepsis/septic shock. • Each recommendation includes: strength (recommend/suggest/suggest against/recommend against), evidence quality (moderate, low, high), and a traffic light icon (green/yellow/red). • 2016 statements are provided for two recommendations for historical comparison. # Individual Recommendations : • 32 (Moderate, green): "For adults with sepsis or septic shock, we recommend using crystalloids as first-line fluid for resuscitation." • 33 (Low, yellow): "For adults with sepsis or septic shock, we suggest using balanced crystalloids instead of normal saline for resuscitation." – 2016 Statement: "We suggest using either balanced crystalloids or saline for fluid resuscitation of patients with sepsis or septic shock." • 34 (Moderate, yellow): "For adults with sepsis or septic shock, we suggest using albumin in patients who received large volumes of crystalloids." • 35 (High, red): "For adults with sepsis or septic shock, we recommend against using starches for resuscitation." • 36 (Moderate, red): "For adults with sepsis and septic shock, we suggest against using gelatin for resuscitation." – 2016 Statement: "We suggest using crystalloids over gelatins when resuscitating patients with sepsis or septic shock." # Design Encodings : • Traffic light icons (green, yellow, red) indicate recommendation strength. • Horizontal bar visual for evidence quality (moderate, low, high). • Blue highlight for 2016 statements. • Bold text for "recommend" and "suggest" actions. # Analysis : • Crystalloids are strongly recommended as first-line fluids (moderate evidence). • Balanced crystalloids are suggested over saline, but evidence is low. • Albumin is suggested only for patients needing large volumes of crystalloids. • Starches and gelatins are discouraged, with strong (high) evidence against starches and moderate evidence against gelatins. • Recommendations have evolved slightly since 2016, with more explicit discouragement of gelatins and starches.
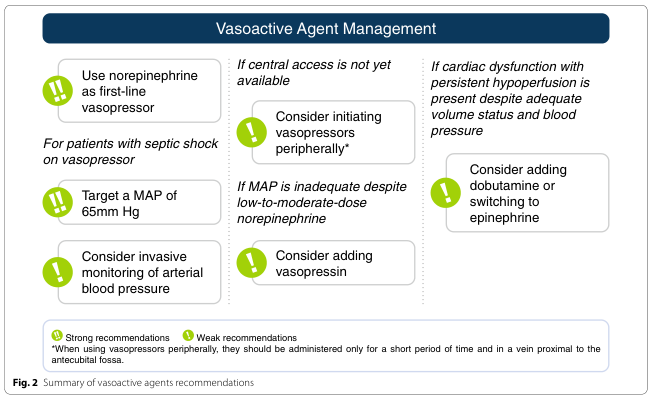
Summary : This figure presents a summary of recommendations for the management of vasoactive agents in patients with septic shock, focusing on the choice and administration of vasopressors, monitoring strategies, and adjustments for cardiac dysfunction. flowchart: # Nodes : • "Use norepinephrine as first-line vasopressor" (rounded rectangle, strong recommendation) • "Target a MAP of 65mm Hg" (rounded rectangle, strong recommendation) • "Consider invasive monitoring of arterial blood pressure" (rounded rectangle, strong recommendation) • "Consider initiating vasopressors peripherally*" (rounded rectangle, weak recommendation) • "Consider adding vasopressin" (rounded rectangle, weak recommendation) • "Consider adding dobutamine or switching to epinephrine" (rounded rectangle, weak recommendation) # Connectors : • "For patients with septic shock on vasopressor" leads to three nodes: norepinephrine use, MAP target, and invasive monitoring. • "If central access is not yet available" leads to "Consider initiating vasopressors peripherally*". • "If MAP is inadequate despite low-to-moderate-dose norepinephrine" leads to "Consider adding vasopressin". • "If cardiac dysfunction with persistent hypoperfusion is present despite adequate volume status and blood pressure" leads to "Consider adding dobutamine or switching to epinephrine". # Layout : • Three main columns: – Left: Initial management for septic shock (norepinephrine, MAP target, invasive monitoring). – Middle: Adjustments if central access is unavailable or MAP is inadequate (peripheral vasopressors, add vasopressin). – Right: Management for cardiac dysfunction (add dobutamine or switch to epinephrine). • Recommendations are visually distinguished by icons: green for strong, yellow for weak. • Footnote: Peripheral vasopressors should be administered only for a short period and in a vein proximal to the antecubital fossa. # Analysis : • The figure prioritizes norepinephrine as the first-line vasopressor and a MAP target of 65mm Hg, both as strong recommendations. • Invasive monitoring is also strongly recommended. • Weak recommendations address practical adjustments: peripheral administration if central access is delayed, adding vasopressin if MAP remains low, and using dobutamine or epinephrine for cardiac dysfunction. • The flowchart structure supports stepwise escalation and adaptation based on patient response and access limitations.
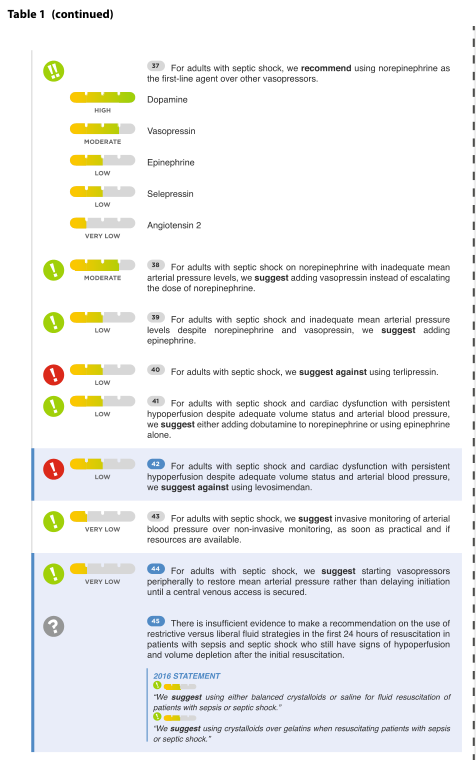
Summary : This figure presents recommendations and evidence levels for vasopressor and fluid management in adults with septic shock, using a combination of iconography, colour-coded evidence bars, and textual statements. table-figure hybrid: # Recommendation Structure : • Each numbered recommendation (37–45) is accompanied by a coloured evidence bar (green = high, yellow = moderate, orange = low, grey = very low). • Icons indicate recommendation strength: exclamation mark (suggest/recommend), red exclamation (suggest against), question mark (insufficient evidence). • Recommendations are grouped by drug or intervention type (vasopressors, monitoring, fluid strategy). # Vasopressor Agents : • Norepinephrine is recommended as first-line agent (high evidence). • Dopamine, vasopressin, epinephrine, selepressin, angiotensin 2 are listed with respective evidence levels (high to very low). • Vasopressin is suggested to be added if norepinephrine is inadequate (moderate evidence). • Epinephrine is suggested to be added if both norepinephrine and vasopressin are inadequate (low evidence). • Terlipressin and levosimendan are suggested against (low evidence). # Cardiac Dysfunction Management : • For persistent hypoperfusion, dobutamine or epinephrine may be added (low evidence). • Levosimendan is suggested against (low evidence). # Monitoring and Administration : • Invasive monitoring of arterial blood pressure is suggested over non-invasive methods when resources allow (very low evidence). • Starting vasopressors peripherally is suggested rather than delaying for central access (very low evidence). # Fluid Resuscitation : • No recommendation on restrictive vs. liberal fluid strategies due to insufficient evidence. • 2016 statement: balanced crystalloids or saline suggested for resuscitation; crystalloids preferred over gelatins. # Design Encodings : • Evidence bars: green (high), yellow (moderate), orange (low), grey (very low). • Icons: exclamation mark (suggest/recommend), red exclamation (suggest against), question mark (insufficient evidence). • Textual recommendations are bolded for "recommend" and "suggest". # Analysis : • Norepinephrine is strongly favoured as first-line vasopressor. • Vasopressin and epinephrine are considered as adjuncts if initial therapy fails. • Several agents (terlipressin, levosimendan) are specifically discouraged. • Invasive monitoring and peripheral vasopressor initiation are suggested despite low evidence. • Fluid strategy remains an area of uncertainty, with prior guidance favouring crystalloids.
sepsis organ dysfunction SOFA score criteria
![Table 7: Definition and criteria of sepsis and septic shock [304-306]
<table><thead><tr><th>Disorder</th><th>Definition</th></tr></thead><tbody><tr><td>Sepsis</td><td>Life-threatening organ dysfunction caused by a dysregulated host response to infection. For clinical application, organ dysfunction can be represented by an increase in the Sequential [Sepsis-related] Organ Failure Assessment (SOFA) score of 2 points or more. For rapid identification a quickSOFA (qSOFA) score was developed: respiratory rate of 22/min or greater, altered mentation, or systolic blood pressure of 100 mmHg or less.</td></tr><tr><td>Septic shock</td><td>Septic shock should be defined as a subset of sepsis in which particularly profound circulatory, cellular, and metabolic abnormalities are associated with a greater risk of mortality than with sepsis alone. Patients with septic shock can be clinically identified by a vasopressor requirement to maintain a mean arterial pressure of 65 mmHg or greater and serum lactate level greater than 2 mmol/L (>18 mg/dL) in the absence of hypovolemia.</td></tr></tbody></table>](https://cdn.orris.care/cdss_images/GLGCA_4543237_1766502857832_ae2bf8f4-ab30-4c48-8d62-c48dca104e78_10f240ff-6d7e-443a-9ad3-ae9263402c7f.png)
Table 7: Definition and criteria of sepsis and septic shock [304-306] <table><thead><tr><th>Disorder</th><th>Definition</th></tr></thead><tbody><tr><td>Sepsis</td><td>Life-threatening organ dysfunction caused by a dysregulated host response to infection. For clinical application, organ dysfunction can be represented by an increase in the Sequential [Sepsis-related] Organ Failure Assessment (SOFA) score of 2 points or more. For rapid identification a quickSOFA (qSOFA) score was developed: respiratory rate of 22/min or greater, altered mentation, or systolic blood pressure of 100 mmHg or less.</td></tr><tr><td>Septic shock</td><td>Septic shock should be defined as a subset of sepsis in which particularly profound circulatory, cellular, and metabolic abnormalities are associated with a greater risk of mortality than with sepsis alone. Patients with septic shock can be clinically identified by a vasopressor requirement to maintain a mean arterial pressure of 65 mmHg or greater and serum lactate level greater than 2 mmol/L (>18 mg/dL) in the absence of hypovolemia.</td></tr></tbody></table>
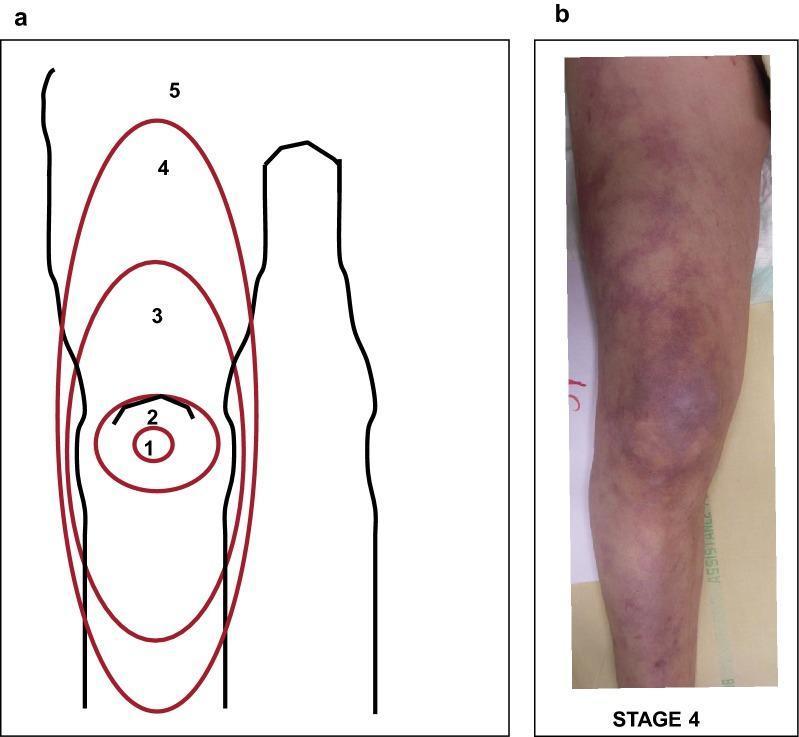
This composite educational graphic details the Mottling Score system used to assess peripheral tissue perfusion, particularly in the context of sepsis and septic shock. Panel A features an anatomical diagram of a lower limb with red concentric ellipses illustrating the semi-quantitative scoring criteria (1–5) based on the anatomical extension of skin mottling. Score 1 is localized to the patella center; score 2 reaches the superior edge of the patella; score 3 extends to the mid-thigh; score 4 reaches the groin fold; and score 5 extends beyond the groin. Panel B is a clinical photograph of a patient's leg demonstrating a high mottling score (Stage 4-5). The skin shows diffuse, reticulated, purple-to-bluish discoloration (livedo reticularis) extending from the knee upward toward the thigh and downward to the pretibial area. This visual sign represents microcirculatory dysfunction and is used as a prognostic indicator for organ failure and mortality in critically ill patients.
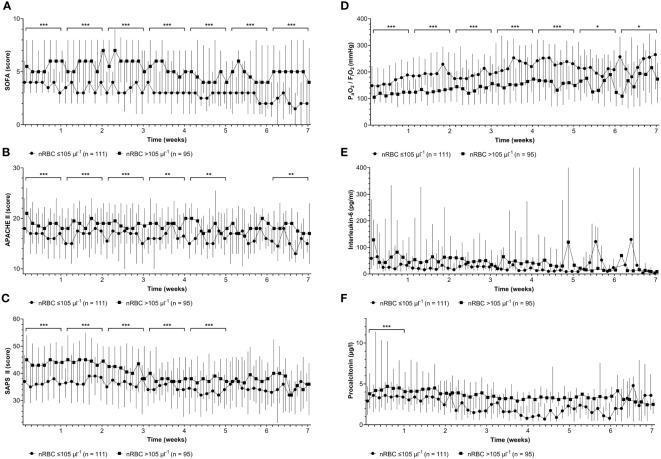
A multi-panel comparison chart comprising six line graphs (A-F) tracking clinical severity scores and inflammatory biomarkers in ICU patients over a seven-week period. The data is stratified into two groups based on maximum nucleated red blood cell (nRBC) counts: >105 µl-1 (indicated by circles) and ≤105 µl-1 (indicated by squares). Graphs A, B, and C demonstrate that patients with higher nRBC counts consistently exhibit significantly higher disease severity scores, including the Sepsis-related Organ Failure Assessment (SOFA), Acute Physiology and Chronic Health Evaluation (APACHE) II, and Simplified Acute Physiology Score (SAPS) II. Graph D shows a significantly lower PaO2/FiO2 ratio (indicating worse pulmonary function) in the high nRBC group. Graphs E and F track Interleukin-6 and Procalcitonin levels, respectively; significant differences are primarily noted in the early ICU stay for Procalcitonin. Statistical significance is indicated by asterisks (*p < 0.05, **p < 0.01, ***p < 0.001) above weekly brackets. Vertical error bars represent data variability.
🧠 Sepsis & Septic Shock — Complete Teaching Notes
Primary Source: Harrison's Principles of Internal Medicine, 22nd Edition (2025), Chapter 315 - Strich JR & Chertow DS | Supplemented by Goldman-Cecil Medicine, Surviving Sepsis Campaign Guidelines 2021/2026, Tintinalli's Emergency Medicine, and recent PubMed evidence.
1. INTRODUCTION & ETYMOLOGY
2. DEFINITIONS — THE EVOLUTION (Sepsis-1 → Sepsis-3)
Sepsis-1 (1992) — SIRS-Based
| SIRS Criteria | Threshold |
|---|---|
| Temperature | <36°C or >38°C |
| Heart Rate (HR) | >90 beats/min |
| Respiratory Rate (RR) | >20 breaths/min OR PaCO₂ <32 mmHg |
| WBC (leukocytes) | <4,000/µL or >12,000/µL or >10% bands |
- Severe sepsis = sepsis + evidence of hypoperfusion or end-organ dysfunction (oliguria, altered mental status, lactic acidosis)
- Septic shock = sepsis-induced hypotension (SBP <90 mmHg or drop ≥40 mmHg from baseline) despite adequate fluids
Sepsis-3 (2016) — Current Consensus Definition
Sepsis = Life-threatening organ dysfunction caused by a dysregulated host response to infection
- SOFA score increase of ≥2 points from baseline
Septic Shock = Subset of sepsis with profound circulatory, cellular, and metabolic abnormalities
- Vasopressor requirement to maintain MAP ≥65 mmHg
- AND Serum lactate >2 mmol/L (>18 mg/dL)
- IN THE ABSENCE of hypovolemia
3. SOFA SCORE & qSOFA
SOFA (Sequential Organ Failure Assessment)
| Organ System | Parameter |
|---|---|
| Neurologic | Glasgow Coma Scale (GCS) |
| Cardiovascular | MAP or vasopressor use |
| Respiratory | PaO₂/FiO₂ ratio ± mechanical ventilation |
| Hepatic | Serum bilirubin |
| Renal | Serum creatinine |
| Coagulation | Platelet count |
qSOFA (Quick SOFA) — Bedside Screening Tool
- RR ≥22/min
- Altered mentation (GCS <15)
- SBP ≤100 mmHg
4. EPIDEMIOLOGY
- ~88% of sepsis is community-onset (within 48 h of hospitalization)
- ~12% is hospital-onset (>48 h after admission)
- 53% of U.S. sepsis cases are culture-positive
- Equal split between gram-positive and gram-negative organisms
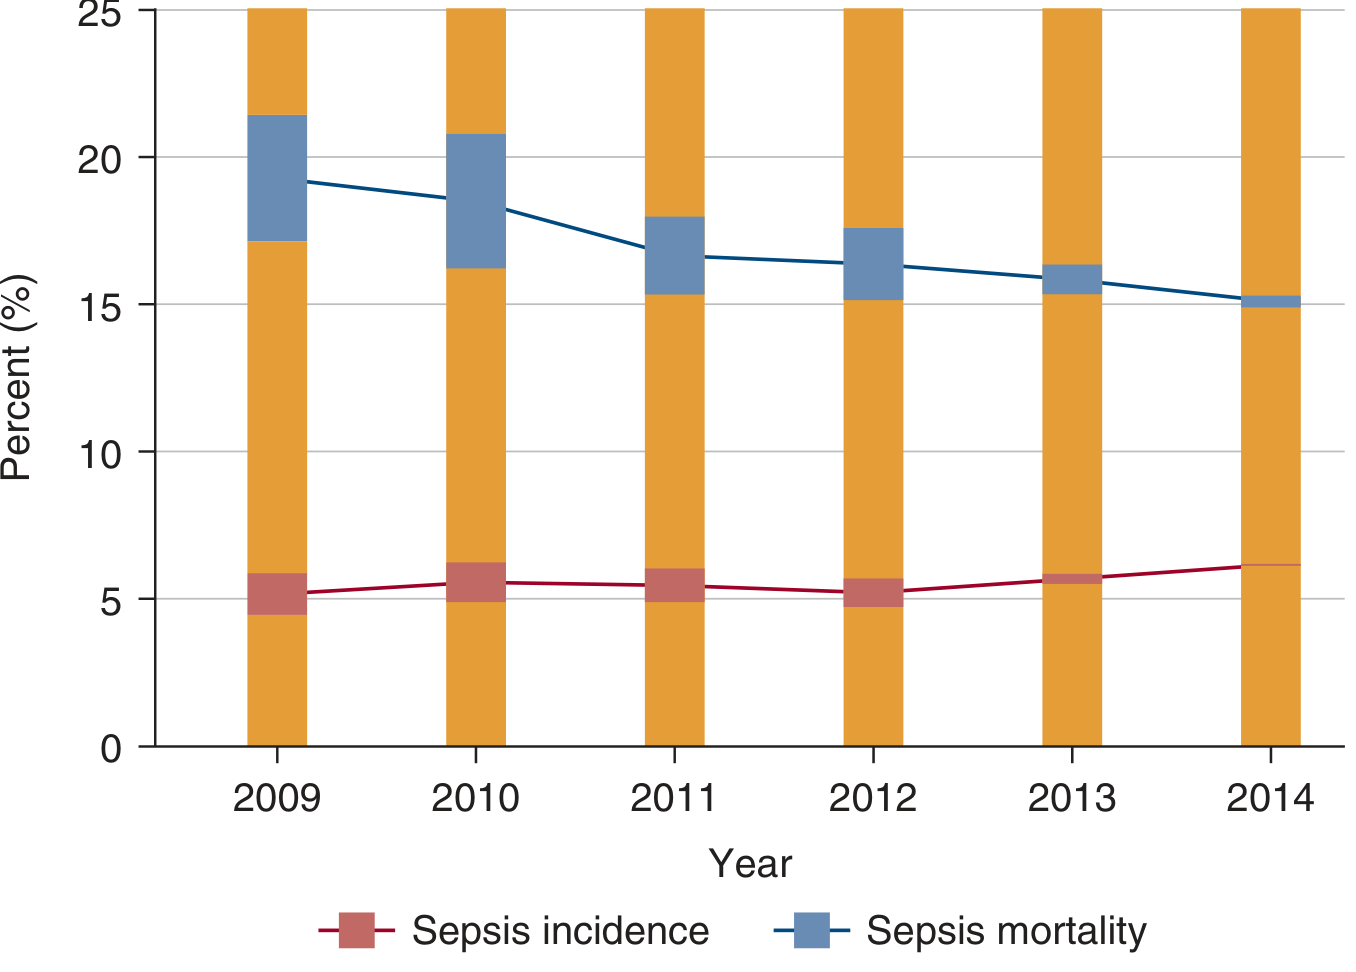
- Incidence has been increasing (partly due to better recognition) but mortality has been declining
Most Common Pathogens
- Staphylococcus aureus (including MRSA)
- Streptococcus spp.
- Enterococcus spp. (including VRE)
- Escherichia coli
- Klebsiella spp.
- Pseudomonas aeruginosa
- Resistant strains (ESBL, carbapenem-resistant)
Primary Sites of Infection
- Urinary tract (48.9%) - most common
- Respiratory tract (32.9%)
- Intraabdominal (13.6%)
- Skin/soft tissue (10.3%)
Risk Factors for Increased Mortality
- Age (mortality doubles with each decade above 65)
- Male sex (higher mortality across all age groups)
- Diabetes, obesity
- Neurologic, respiratory, cardiac disease
- Renal/hepatic insufficiency
- Cancer or immunosuppression
- Recent hospitalization (3x risk of sepsis within 90 days)
5. PATHOGENESIS — "How Does Sepsis Kill?"
5a. Pathogen Recognition
- PAMPs (Pathogen-Associated Molecular Patterns) — e.g., LPS (lipopolysaccharide) from gram-negative bacteria, peptidoglycan from gram-positive bacteria
- DAMPs (Damage-Associated Molecular Patterns) — released from dying host cells (e.g., HMGB1, mitochondrial DNA)
- Toll-like receptors (TLRs) — especially TLR4 (detects LPS)
- NOD-like receptors (NLRs)
- C-type lectin receptors
5b. The Inflammatory Cascade

- Myeloid cells (neutrophils, monocytes, macrophages, dendritic cells) release:
- Pro-inflammatory cytokines: TNF-α, IL-1β, IL-6, IL-8, IL-12
- These cause fever, vasodilation, increased vascular permeability
- Anti-inflammatory response (counter-regulatory) releases: IL-10, TGF-β
- Complement system is activated
- Coagulation cascade is triggered (via tissue factor on damaged endothelium)
- TNF-α + IL-1β → fever, hypotension, increased vascular permeability
- IL-6 → acute-phase protein synthesis (CRP, procalcitonin, fibrinogen)
- IL-8 → neutrophil chemotaxis
5c. Endothelial Dysfunction
- Inflammatory mediators cause endothelial activation
- Leads to: increased capillary permeability → fluid leaks into tissues → third spacing → reduced circulating volume
- Glycocalyx (the protective sugar coat on endothelial cells) is shed
- Microthrombosis forms throughout the microvasculature
- Nitric oxide (NO) is massively released → profound vasodilation → distributive shock
5d. The Coagulation-Inflammation Vicious Cycle
| Pro-coagulant | Anti-coagulant (consumed) |
|---|---|
| Tissue factor ↑ | Protein C ↓ |
| Thrombin generation ↑ | Antithrombin III ↓ |
| PAI-1 ↑ (inhibits fibrinolysis) | Tissue Factor Pathway Inhibitor ↓ |
5e. Immune Paralysis
- Lymphocyte apoptosis (massive death of T and B cells)
- T-cell exhaustion
- Macrophage reprogramming to anti-inflammatory phenotype
- Reduced MHC II expression → impaired antigen presentation
5f. Organ Dysfunction Mechanisms
| Organ | Mechanism |
|---|---|
| Lungs | Neutrophil-mediated endothelial damage → ARDS |
| Kidneys | Microvascular obstruction, tubular injury, inflammation → AKI |
| Brain | BBB disruption, neuroinflammation, cerebral microthrombosis → SAE (Sepsis-Associated Encephalopathy) |
| Heart | Myocardial depressant factors (TNF-α, IL-1β), mitochondrial dysfunction → sepsis-induced cardiomyopathy |
| Liver | Reduced synthetic function → coagulopathy, hypoalbuminemia |
| Gut | Ischemia, increased permeability → translocation of bacteria → worsens sepsis |
6. CLINICAL PRESENTATION
Early Signs
- Fever (>38°C) or hypothermia (<36°C) — hypothermia is an ominous sign
- Tachycardia (HR >90)
- Tachypnea (RR >20)
- Altered mental status — confusion, disorientation
- Skin changes: warm, flushed skin (early) → cold, clammy, mottled skin (late/shock)
Septic Shock Presentation
- Hypotension (MAP <65 mmHg despite fluids)
- Lactate >2 mmol/L — marker of tissue hypoperfusion
- Oliguria (urine output <0.5 mL/kg/hr)
- Mottled skin (livedo reticularis) — prognostic sign; extends from knee upward with severity
Hemodynamic Profile of Septic Shock
| Parameter | Septic Shock |
|---|---|
| Cardiac Output (CO) | ↑ (hyperdynamic — initially) |
| Systemic Vascular Resistance (SVR) | ↓ (vasodilation) |
| Mixed venous O₂ saturation (ScvO₂) | ↑ (tissues can't extract O₂) |
| Pulmonary Capillary Wedge Pressure (PCWP) | Normal/Low |
| Skin | Warm, flushed (early) |
7. DIAGNOSIS & WORKUP
Diagnostic Criteria (Sepsis-3)
- Suspected/confirmed infection
- SOFA ≥2 (or acute SOFA increase ≥2 if baseline available)
- For septic shock: vasopressor requirement + lactate >2 mmol/L
Essential Investigations
- Vital signs, GCS, urine output monitoring
- Blood cultures × 2 (before antibiotics if possible)
- CBC (WBC, neutrophilia or neutropenia, thrombocytopenia)
- Lactate (serum/plasma) — KEY marker
- CMP (creatinine, bilirubin, glucose)
- Coagulation (PT, aPTT, fibrinogen, D-dimer — screen for DIC)
- ABG (acidosis? respiratory failure? PaO₂/FiO₂ for SOFA)
- Urinalysis + urine culture
- Procalcitonin (PCT) — elevated in bacterial sepsis; useful for antibiotic de-escalation (not for diagnosis alone)
- CRP — elevated but non-specific
- Lactate — the most clinically important biomarker
| Lactate | Interpretation |
|---|---|
| <2 mmol/L | Normal |
| 2-4 mmol/L | Elevated; tissue hypoperfusion possible |
| >4 mmol/L | High risk; mortality >25-40% |
- CXR (pneumonia? ARDS?)
- CT chest/abdomen/pelvis (source identification)
- Bedside ultrasound (POCUS) — cardiac function, IVC assessment, effusions
8. MANAGEMENT — THE 1-HOUR BUNDLE
Within 1 hour of recognition:
- Measure lactate — remeasure if initial >2 mmol/L
- Blood cultures × 2 before antibiotics
- Administer broad-spectrum antibiotics
- IV fluid bolus — 30 mL/kg crystalloid for hypotension or lactate ≥4
- Vasopressors — if hypotensive during/after fluids to maintain MAP ≥65 mmHg
9. ANTIMICROBIAL THERAPY
Principles
- Broad-spectrum first (de-escalate later based on cultures)
- Cover likely pathogens based on suspected source and risk factors
- Consider local antibiogram and resistance patterns
- Consider MRSA coverage if risk factors present
- Consider antifungal (candida) in prolonged ICU stays, immunocompromised, TPN-dependent patients
Common Empiric Regimens
| Source | Empiric Coverage |
|---|---|
| Unknown/Undifferentiated | Pip-tazo OR meropenem (if high-risk MDR) |
| Community-onset pneumonia | β-lactam + macrolide (or respiratory fluoroquinolone) |
| HAP/VAP | Anti-pseudomonal β-lactam ± aminoglycoside |
| UTI-source | Ceftriaxone OR fluoroquinolone (if susceptible) |
| Intraabdominal | Pip-tazo OR ceftriaxone + metronidazole |
| Skin/soft tissue | MRSA coverage (vancomycin) + gram-negative cover |
| Immunocompromised | Broad + antifungal |
Duration
- As short as possible — 5-7 days for most infections
- Procalcitonin-guided de-escalation: reducing antibiotic duration without harm (recent JAMA meta-analysis, 2024)
- Reassess daily for de-escalation
Recent Evidence (2024, JAMA)
10. FLUID RESUSCITATION
Initial Resuscitation
- 30 mL/kg IV crystalloid within 3 hours for sepsis-induced tissue hypoperfusion or hypotension
- Reassess frequently — avoid fluid overload
Fluid Choice (SSC Recommendations)
- Crystalloids — first line (strong recommendation)
- Balanced crystalloids (Lactated Ringer's, Plasma-Lyte) preferred over Normal Saline (0.9% NaCl) — NS causes hyperchloremic metabolic acidosis
- Albumin — consider when large volumes of crystalloid are required (weak recommendation)
- Hydroxyethyl starch (HES) — strongly AGAINST (causes AKI and increased mortality)
- Gelatin — against (moderate evidence)
Fluid Responsiveness Assessment
- Passive Leg Raise (PLR) test — raise legs 45°; if CO increases >10%, patient is fluid-responsive
- Pulse pressure variation (PPV) >13% on mechanical ventilation = fluid responsive
- IVC collapsibility on POCUS
- ScvO₂ (central venous O₂) target: >70%
When to Stop Fluids
11. VASOPRESSORS
Vasopressor Ladder
| Step | Agent | Mechanism | Notes |
|---|---|---|---|
| 1st line | Norepinephrine (NE) | α1 >> β1 | Gold standard; strong evidence |
| 2nd line (add-on) | Vasopressin | V1 receptors on VSM | 0.03-0.04 units/min; adds to NE; may reduce NE dose |
| 3rd line | Epinephrine | α1 + β1 + β2 | When NE + vasopressin insufficient |
| Inotrope | Dobutamine | β1 (+ β2) | For cardiac dysfunction with persistent hypoperfusion despite adequate preload/MAP |
| Avoid | Dopamine | Mixed dose-dependent | Higher arrhythmia risk; not preferred over NE |
Key Points
- Target MAP: 65 mmHg (strong recommendation) — higher targets (e.g., 80 mmHg) did not improve outcomes in SEPSISPAM trial
- Can start vasopressors peripherally (short-term, proximal to antecubital fossa) if central access not yet available
- Use invasive arterial blood pressure monitoring (arterial line) when possible
Corticosteroids in Septic Shock
- Hydrocortisone 200 mg/day (IV infusion or 50 mg q6h) — recommended for refractory septic shock not controlled by fluids and vasopressors
- Mechanism: treats relative adrenal insufficiency; restores vasopressor sensitivity
- Do NOT use ACTH stimulation test to guide decision (CORTICUS trial)
- Add fludrocortisone 50 mcg/day orally in some protocols (APROCCHSS trial)
12. ADDITIONAL ICU MANAGEMENT
Respiratory Support
- Supplemental oxygen - titrate to SpO₂ 92-96%
- High-Flow Nasal Cannula (HFNC) or NIV for early respiratory failure
- Mechanical ventilation if respiratory failure or ARDS develops:
- Low tidal volume ventilation: 6 mL/kg IBW (ARDSNET protocol)
- Plateau pressure: <30 cmH₂O
- PEEP: individualized; higher PEEP for moderate-severe ARDS
Glucose Control
- Target blood glucose 140-180 mg/dL (7.8-10 mmol/L) — tight control (80-110 mg/dL) increased hypoglycemia and mortality (NICE-SUGAR trial)
- Use continuous insulin infusion with frequent monitoring
Renal Replacement Therapy (RRT)
- Continuous RRT (CRRT) preferred in hemodynamically unstable septic AKI
- Indications: refractory hyperkalemia, severe acidosis, fluid overload, uremia
DVT Prophylaxis
- LMWH preferred over UFH (if renal function adequate)
- Mechanical (compression devices) if anticoagulants contraindicated
Stress Ulcer Prophylaxis
- Proton pump inhibitors (PPI) or H₂-blockers in mechanically ventilated patients
Nutrition
- Enteral nutrition (NG/NJ) preferred over parenteral — start within 24-48 h if hemodynamically stable
- Early enteral nutrition reduces gut permeability, bacterial translocation, infection rate
Anemia / Blood Transfusion
- Transfuse RBCs if Hb <7 g/dL (restrictive strategy, TRICC/TRISS trials)
- Exception: active myocardial ischemia → target Hb >8-9 g/dL
Source Control
- Critical and time-sensitive — drain abscesses, debride necrotic tissue, remove infected hardware/catheters
- Should be accomplished as soon as medically feasible (ideally within 6-12 hours for some sources)
13. MONITORING RESPONSE TO TREATMENT
- MAP ≥65 mmHg
- Urine output ≥0.5 mL/kg/hr
- ScvO₂ ≥70% (or SvO₂ ≥65%)
- Lactate clearance ≥10% per 2 hours
- Improving mental status
14. SEPSIS-ASSOCIATED COMPLICATIONS
| Complication | Notes |
|---|---|
| ARDS | Neutrophil-mediated lung injury; PaO₂/FiO₂ <300 |
| AKI | Most common organ failure; requires RRT in severe cases |
| DIC | Simultaneous clotting + bleeding; treat underlying sepsis |
| SAE | Sepsis-associated encephalopathy — delirium, coma; BBB disruption |
| Sepsis-induced cardiomyopathy | Reversible myocardial depression; echocardiography shows reduced EF |
| Critical illness polyneuropathy | ICU-acquired weakness; prolonged recovery |
| Adrenal insufficiency | Relative; treat with hydrocortisone in refractory shock |
15. BRAIN PATHWAYS IN SEPSIS
- Humoral route — BBB breakdown; cytokines/immune cells enter directly
- Cellular route — peripheral immune cells (neutrophils, macrophages) infiltrate; microglia activate; release TNF-α, IL-1, IL-6
- Neural route — cytokine signals travel via autonomic nerves (vagus nerve) → affect hypothalamus, amygdala, hippocampus
16. POST-SEPSIS SYNDROME (Long-Term Outcomes)
- 50% of sepsis survivors are re-hospitalized within 1 year
- 1 in 6 die within the first year post-discharge
- Risk of death remains elevated for up to 2 years
- Prolonged fatigue, muscle loss (ICU-acquired weakness)
- Reduced functional capacity
- Cognitive decline, dementia
- Depression, PTSD
- Decreased quality of life
- Increased MI and stroke risk post-sepsis
17. SEPSIS PHENOTYPES — THE FUTURE
| Phenotype | Mortality |
|---|---|
| α (Alpha) | ~2% |
| β (Beta) | ~5% |
| γ (Gamma) | ~15% |
| δ (Delta) | ~32% |
18. KEY SHORT FORMS / ABBREVIATIONS
| Short Form | Full Term |
|---|---|
| SIRS | Systemic Inflammatory Response Syndrome |
| SOFA | Sequential Organ Failure Assessment |
| qSOFA | Quick SOFA |
| MAP | Mean Arterial Pressure |
| SSC | Surviving Sepsis Campaign |
| EGDT | Early Goal-Directed Therapy |
| PAMPs | Pathogen-Associated Molecular Patterns |
| DAMPs | Damage-Associated Molecular Patterns |
| PRR | Pattern Recognition Receptors |
| TLR | Toll-Like Receptors |
| TNF-α | Tumor Necrosis Factor-alpha |
| IL | Interleukin |
| DIC | Disseminated Intravascular Coagulation |
| ARDS | Acute Respiratory Distress Syndrome |
| AKI | Acute Kidney Injury |
| SAE | Sepsis-Associated Encephalopathy |
| MRSA | Methicillin-Resistant S. aureus |
| VRE | Vancomycin-Resistant Enterococci |
| ESBL | Extended-Spectrum Beta-Lactamase |
| PCT | Procalcitonin |
| CRP | C-Reactive Protein |
| ScvO₂ | Central Venous Oxygen Saturation |
| PPV | Pulse Pressure Variation |
| PLR | Passive Leg Raise |
| POCUS | Point-of-Care Ultrasound |
| HFNC | High-Flow Nasal Cannula |
| NE | Norepinephrine |
| HES | Hydroxyethyl Starch |
| LPS | Lipopolysaccharide |
| NO | Nitric Oxide |
| iNOS | Inducible Nitric Oxide Synthase |
| RRT | Renal Replacement Therapy |
| CRRT | Continuous Renal Replacement Therapy |
| IBW | Ideal Body Weight |
| PEEP | Positive End-Expiratory Pressure |
📋 SUMMARY
| Domain | Key Points |
|---|---|
| Definition | Sepsis = life-threatening organ dysfunction due to dysregulated host response to infection (Sepsis-3); Septic shock = vasopressor + lactate >2 despite no hypovolemia |
| Old vs New | Sepsis-1 used SIRS (too sensitive); Sepsis-3 uses SOFA ≥2 (more specific, organ-dysfunction focused) |
| Pathogens | Equal gram+/gram-; E. coli, S. aureus, Klebsiella, Pseudomonas; UTI most common source (49%) |
| Pathogenesis | PAMPs/DAMPs → PRR activation → cytokine storm (TNF-α, IL-1β, IL-6) → endothelial dysfunction → microthrombosis, vasodilation, capillary leak → organ failure |
| Key organ failure | Lungs (ARDS), Kidneys (AKI), Brain (SAE), Heart (cardiomyopathy), Liver, Gut |
| Diagnosis | SOFA ≥2 + infection; Blood cultures; Lactate; CBC, LFT, CMP, Coagulation; qSOFA for screening |
| 1-Hour Bundle | Lactate, Blood cultures, Antibiotics, 30 mL/kg crystalloid, Vasopressors if MAP <65 |
| Antibiotics | Broad-spectrum within 1 hour; de-escalate after cultures; prolonged β-lactam infusion improves outcomes |
| Fluids | Balanced crystalloids (LR/Plasma-Lyte) over NS; avoid HES; use dynamic assessment for fluid responsiveness |
| Vasopressors | Norepinephrine 1st → add Vasopressin → add Epinephrine; target MAP 65 mmHg; Dobutamine for cardiogenic component |
| Steroids | Hydrocortisone 200 mg/day for refractory septic shock |
| Other ICU care | Low tidal volume ventilation (6 mL/kg IBW); Glucose 140-180 mg/dL; RBC if Hb <7; LMWH DVT prophylaxis; early enteral nutrition |
| Post-sepsis | 50% re-admitted within 1 year; cognitive decline, PTSD, muscle weakness; structured follow-up needed |
| Mortality | Sepsis ~15-20%; Septic shock >40%; trending down over years with better care bundles |
Sources:
- Harrison's Principles of Internal Medicine, 22nd Edition (2025), Chapter 315 — Strich JR, Chertow DS
- Surviving Sepsis Campaign International Guidelines 2021 - Evans L et al., Crit Care Med
- Singer M et al. Sepsis-3 Definitions. JAMA 2016
- Goldman-Cecil Medicine — Screening Table for Sepsis
- Abdul-Aziz MH et al. Prolonged β-lactam infusions in sepsis. JAMA 2024 — Meta-analysis showing prolonged infusions reduce mortality
- Long J et al. Fluid resuscitation in sepsis: network meta-analysis. Am J Emerg Med 2025 — Confirms balanced crystalloids as optimal
- Ford JS et al. SEP-1 bundle compliance and mortality. Ann Intern Med 2025 — SSC bundle compliance reduces mortality
Teach me everything I need to know. About ABG. And treatment. How to correct it? How to analyze it? From all sources. About everything about EV show.
ABG arterial blood gas analysis acid base interpretation diagram
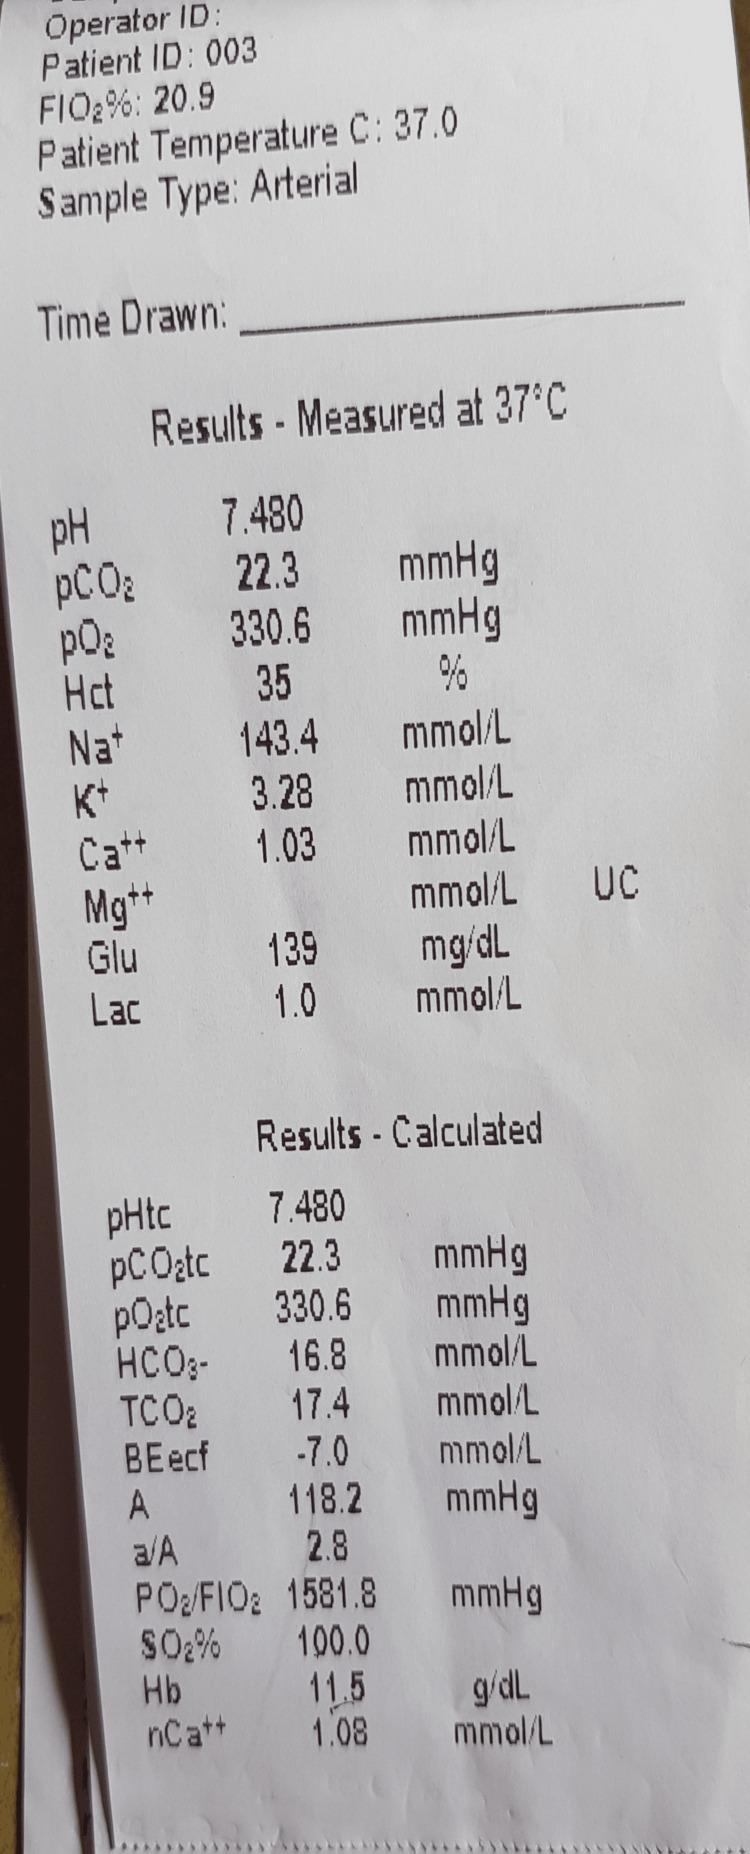
A clinical photograph of a printed arterial blood gas (ABG) analysis report. The document displays measured and calculated physiological values at a patient temperature of 37.0°C. Key measured values include a pH of 7.480, pCO2 of 22.3 mmHg, pO2 of 330.6 mmHg, and electrolyte levels (Na+ 143.4 mmol/L, K+ 3.28 mmol/L, Ca++ 1.03 mmol/L). Calculated values show a bicarbonate (HCO3-) level of 16.8 mmol/L and an oxygen saturation (SO2%) of 100.0%. This visual demonstrates a 'saturation gap' characteristic of certain toxicological conditions, such as methemoglobinemia, where the calculated oxygen saturation from the ABG appears normal (100%) despite the patient potentially experiencing clinical cyanosis and low peripheral pulse oximetry readings. The image is an educational tool for critical care, emergency medicine, and clinical toxicology, illustrating the interpretation of acid-base balance and oxygenation status.
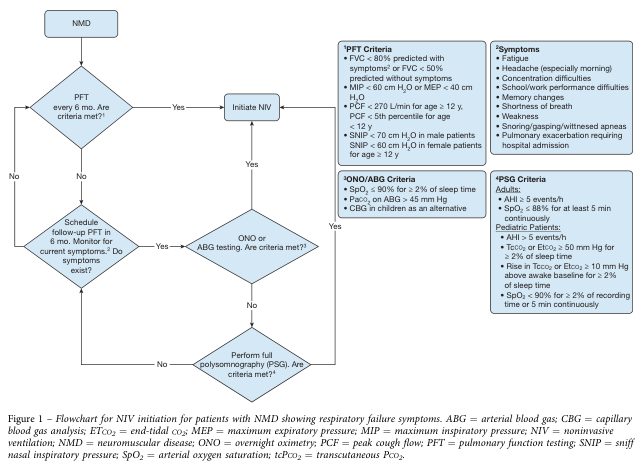
Summary : This flowchart outlines the recommended process for initiating noninvasive ventilation (NIV) in patients with neuromuscular disease (NMD) who show symptoms of respiratory failure, using pulmonary function testing (PFT), overnight oximetry (ONO), arterial blood gas (ABG) analysis, and polysomnography (PSG) criteria. flowchart: # Nodes : • NMD (rectangle) – starting point. • PFT every 6 mo. Are criteria met?¹ (diamond) • Initiate NIV (rectangle) • Schedule follow-up PFT in 6 mo. Monitor for current symptoms.² Do symptoms exist? (diamond) • ONO or ABG testing. Are criteria met?³ (diamond) • Perform full polysomnography (PSG). Are criteria met?⁴ (diamond) # Connectors : • NMD → PFT every 6 mo. Are criteria met?¹ • If Yes → Initiate NIV • If No → Schedule follow-up PFT in 6 mo. Monitor for current symptoms.² Do symptoms exist? • If Yes → ONO or ABG testing. Are criteria met?³ • If Yes → Initiate NIV • If No → Perform full polysomnography (PSG). Are criteria met?⁴ • If Yes → Initiate NIV • If No → (no further action indicated in chart) # Criteria Boxes (side panels) : ## PFT Criteria : • FVC < 80% predicted with symptoms² or FVC < 50% predicted without symptoms • MIP < 60 cm H₂O or MEP < 40 cm H₂O • PCF < 270 L/min for age ≥ 12 y, PCF < 5th percentile for age < 12 y • SNIP < 70 cm H₂O in male patients, SNIP < 60 cm H₂O in female patients for age ≥ 12 y ## Symptoms : • Fatigue • Headache (especially morning) • Concentration difficulties • School/work performance difficulties • Memory changes • Shortness of breath • Weakness • Snoring/gasping/witnessed apneas • Pulmonary exacerbation requiring hospital admission ## ONO/ABG Criteria : • SpO₂ ≤ 90% for ≥ 2% of sleep time • PaCO₂ on ABG > 45 mm Hg • CBG in children as an alternative ## PSG Criteria : • Adults: – AHI ≥ 5 events/h – SpO₂ ≤ 88% for at least 5 min continuously • Pediatric Patients: – AHI ≥ 5 events/h – TcCO₂ or EtCO₂ ≥ 50 mm Hg for ≥ 2% of sleep time – Rise in TcCO₂ or EtCO₂ ≥ 10 mm Hg above awake baseline for ≥ 2% of sleep time – SpO₂ ≤ 90% for ≥ 2% of recording time or 5 min continuously # Layout : • Vertical flow from top (NMD) to bottom. • Decision diamonds branch to either next test or NIV initiation. • Side panels provide detailed criteria for each test or symptom. # Analysis : • The flowchart provides a stepwise, criteria-driven approach for NIV initiation in NMD patients. • It prioritizes PFT results, then symptoms, followed by ONO/ABG, and finally PSG if earlier criteria are not met. • The process ensures that patients with respiratory failure symptoms or abnormal test results are identified and treated with NIV, while those without clear criteria are monitored and retested. • The inclusion of detailed criteria for each test and symptom ensures standardized decision-making.
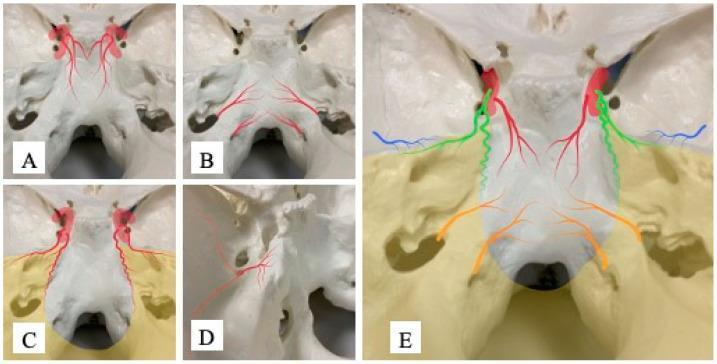
This medical anatomical diagram illustrates the arterial blood supply and vascular distribution patterns across the internal skull base, specifically focusing on feeders involved in skull base meningiomas. The composite image consists of five sub-figures (A-E) superimposed on a superior view of a human skull model. Sub-figure A depicts the Dorsal Meningeal Artery (DMA) in red, originating from the meningohypophyseal trunk and descending along the upper clivus. Sub-figure B shows the Ascending Pharyngeal Artery (APA) in orange, distributing around the foramen magnum and lower clivus. Sub-figure C highlights the Tentorial Artery (TA) in green, following the course of the tentorium cerebelli. Sub-figure D illustrates the Petrosal Branch (PB) in blue, arising from the middle meningeal artery near the foramen spinosum and reaching the petrous apex. Sub-figure E provides a summarized color-coded overlay demonstrating the spatial relationships of these four vascular territories relative to the clivus, petrous bone, and foramen magnum. This visual guide assists in identifying potential feeding arteries based on the tumor's dural attachment site during preoperative planning for meningioma resection.
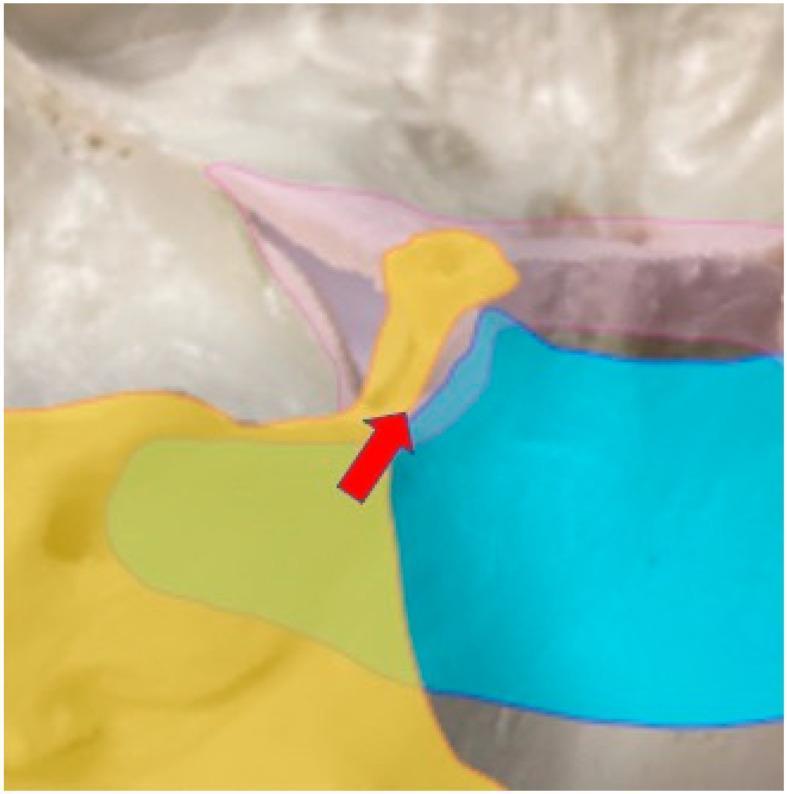
Anatomical Diagram and intraoperative overlay illustrating the arterial blood supply to the cavernous sinus, specifically regarding the feeding vessels of skull base meningiomas. The cavernous sinus is highlighted by a pink outline. The arterial distribution is color-coded: the Tentorial Artery (TA) is represented in yellow, demonstrating its supply to the superolateral aspect of the posterior cavernous sinus. The Dural Meningeal Artery (DMA) is shown in blue, highlighting its coverage of the inferomedial portion of the posterior cavernous sinus. A red arrow identifies the interface where cranial nerves are typically situated between these two arterial territories. The image serves as a clinical reference for neurosurgical planning, helping to differentiate between petrotentorial and petroclival meningioma attachments based on their primary feeding arteries and their spatial relationship to critical neurovascular structures within the skull base.
acid base map pH bicarbonate PaCO2 compensation nomogram
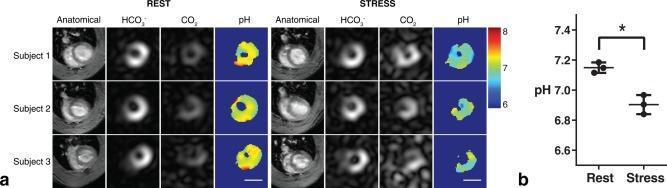
This diagnostic imaging graphic illustrates metabolic cardiac imaging using hyperpolarized 13C MRI to measure intracellular myocardial pH. Panel (a) presents mid-ventricular cross-sectional slices from three subjects under 'Rest' and 'Stress' (dobutamine-induced) conditions. Four image types are displayed for each: 'Anatomical' (standard GRE reference), 'HCO3-' (bicarbonate distribution), 'CO2' (carbon dioxide distribution), and a derived 'pH' map. The pH maps utilize a color scale ranging from blue (pH 6) to red (pH 8). Visually, the 'Rest' maps show warmer colors (yellow/orange), indicating a physiological pH of approximately 7.2. Under 'Stress', there is a noticeable shift toward cooler colors (green/blue), representing myocardial acidification. Panel (b) is a statistical comparison graph showing a significant decrease in mean myocardial pH from approximately 7.15 at rest to 6.90 during stress (p < 0.05). This content demonstrates the use of metabolic imaging to monitor myocardial acid-base balance and response to increased cardiac workload, relevant to cardiovascular physiology and diagnostic radiology.
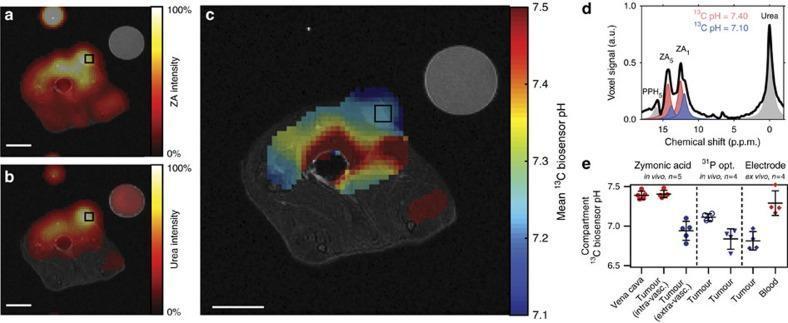
This composite educational graphic illustrates in vivo pH measurement within a MAT B III adenocarcinoma using hyperpolarized 13C Zymonic Acid (ZA). (a, b) Axial intensity maps show the accumulation of hyperpolarized ZA and 13C urea reference within the tumor mass, overlaid on grayscale anatomical proton MR images. A calibration phantom is visible in the upper right. (c) A spatial mean pH map demonstrates tumor acidity, with a color-coded biosensor pH scale ranging from 7.1 (blue, acidic) to 7.5 (red, basic). The map reveals a lower pH in the extravascular tumor compartment compared to surrounding tissue. (d) 13C NMR spectrum from a tumor voxel showing chemical shifts for ZA peaks (ZA1, ZA5) and urea, indicating two distinct pH environments (7.10 and 7.40). (e) Comparison plots validate the ZA biosensor by correlating results with 31P MRS, optical sensors, and electrode measurements across different compartments (Vena cava, intravascular, and extravascular tumor). This diagnostic imaging research demonstrates ZA's utility as a localized biosensor for assessing the acidic metabolic microenvironment of malignant tumors.
A clinical photograph of a printed arterial blood gas (ABG) analysis report. The document displays measured and calculated physiological values at a patient temperature of 37.0°C. Key measured values include a pH of 7.480, pCO2 of 22.3 mmHg, pO2 of 330.6 mmHg, and electrolyte levels (Na+ 143.4 mmol/L, K+ 3.28 mmol/L, Ca++ 1.03 mmol/L). Calculated values show a bicarbonate (HCO3-) level of 16.8 mmol/L and an oxygen saturation (SO2%) of 100.0%. This visual demonstrates a 'saturation gap' characteristic of certain toxicological conditions, such as methemoglobinemia, where the calculated oxygen saturation from the ABG appears normal (100%) despite the patient potentially experiencing clinical cyanosis and low peripheral pulse oximetry readings. The image is an educational tool for critical care, emergency medicine, and clinical toxicology, illustrating the interpretation of acid-base balance and oxygenation status.
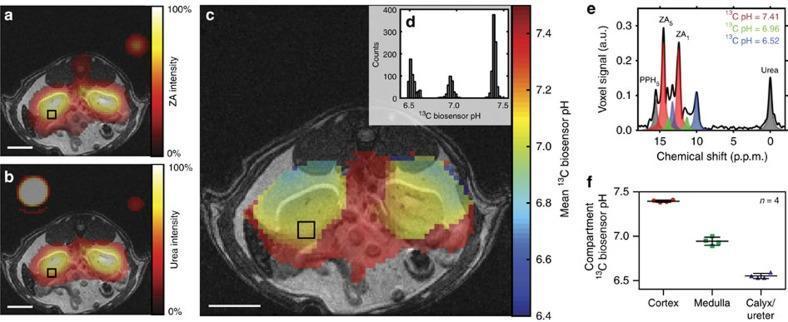
This composite educational graphic demonstrates in vivo metabolic imaging and pH mapping using hyperpolarized 13C magnetic resonance spectroscopy (MRS). The visual elements include axial MRI slices of a rat abdomen with color-coded signal overlays and corresponding quantitative data plots. Panels (a) and (b) show the high signal intensity of zymonic acid (ZA) and 13C-labeled urea concentrated in the kidneys. Panel (c) provides a mean pH map ranging from approximately 6.4 to 7.4, illustrating three distinct physiological compartments: the renal cortex (pH ~7.4, yellow/red), medulla (pH ~6.9, green), and calyx/ureter (pH ~6.5, blue). Panel (e) displays a voxel signal analysis revealing multiple spectral peaks (ZA5, ZA1, PPH5, and Urea). The multi-peak structure for ZA allows for the simultaneous detection of three pH clusters within a single voxel, categorized by chemical shift differences. Panel (f) summarizes the consistency of these pH measurements across different anatomical renal compartments. This material is designed for advanced medical imaging and physiology curricula, focusing on non-invasive metabolic monitoring and biosensor technology.
anion gap metabolic acidosis causes MUDPILES
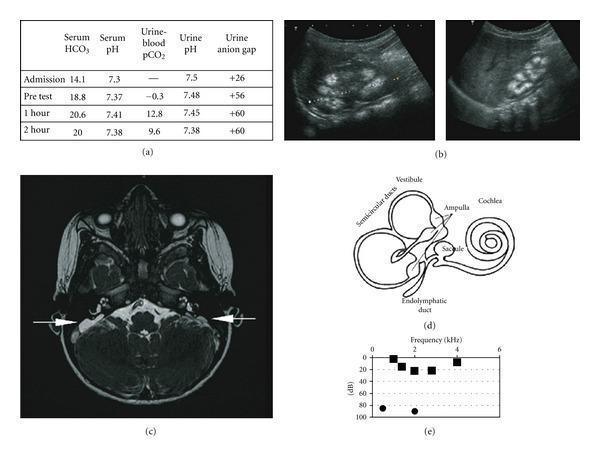
This composite educational image illustrates the clinical and diagnostic features of distal renal tubular acidosis (dRTA) associated with sensorineural hearing loss. (a) Data table showing results of a bicarbonate loading test, characterized by low urine-to-blood pCO2 gradient and positive urinary anion gap. (b) Renal ultrasound images of the left and right kidneys demonstrating medullary nephrocalcinosis, visualized as multiple hyperechoic foci within the renal pyramids. (c) Axial FIESTA (Fast Imaging Employing Steady-state Acquisition) cerebral MRI scan showing bilateral enlargement of the endolymphatic sacs (indicated by white arrows), a common finding in Pendred syndrome or dRTA with hearing loss. (d) Anatomical schematic of the inner ear, labeling the cochlea, vestibule, semicircular ducts, and endolymphatic duct. (e) Audiogram plot showing frequency (kHz) versus decibels (dB), depicting significant hearing impairment. The collection integrates metabolic laboratory data, diagnostic radiology (ultrasound and MRI), and functional audiological testing to present a comprehensive case of a hereditary renal-otological syndrome.
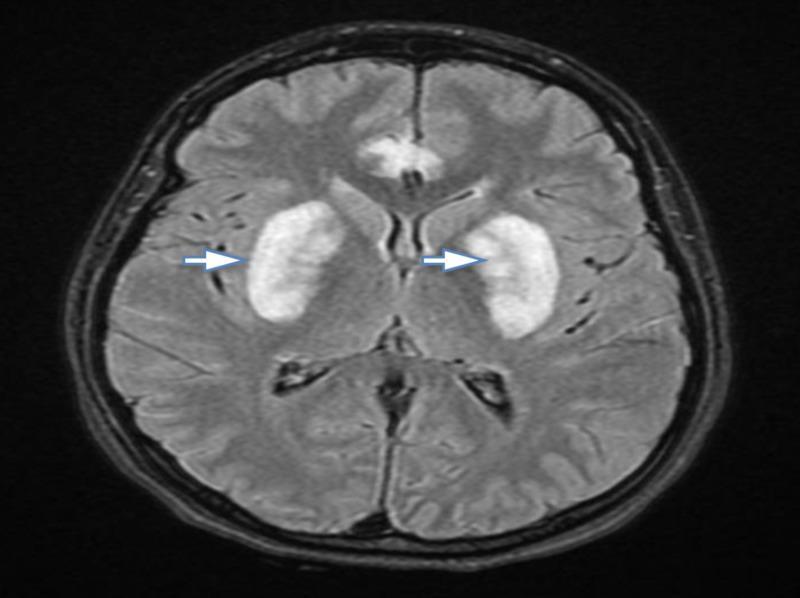
This diagnostic image is an axial Fluid-Attenuated Inversion Recovery (FLAIR) magnetic resonance imaging (MRI) scan of the brain. The image demonstrates prominent, symmetrical hyperintensities localized within the bilateral basal ganglia, specifically involving the putamina (indicated by white arrows). Additionally, a smaller, heterogeneous area of increased signal intensity is visible in the anterior midline of the cerebral parenchyma. These visual findings are characteristic of bilateral putaminal necrosis, often associated with acute toxic metabolic encephalopathy, such as methanol poisoning. The image highlights key radiological features used in neuroradiology for identifying toxic insults to the deep gray matter structures. It serves as an educational example for medical students and clinicians in identifying specific imaging patterns related to systemic toxicity and high-anion gap metabolic acidosis.
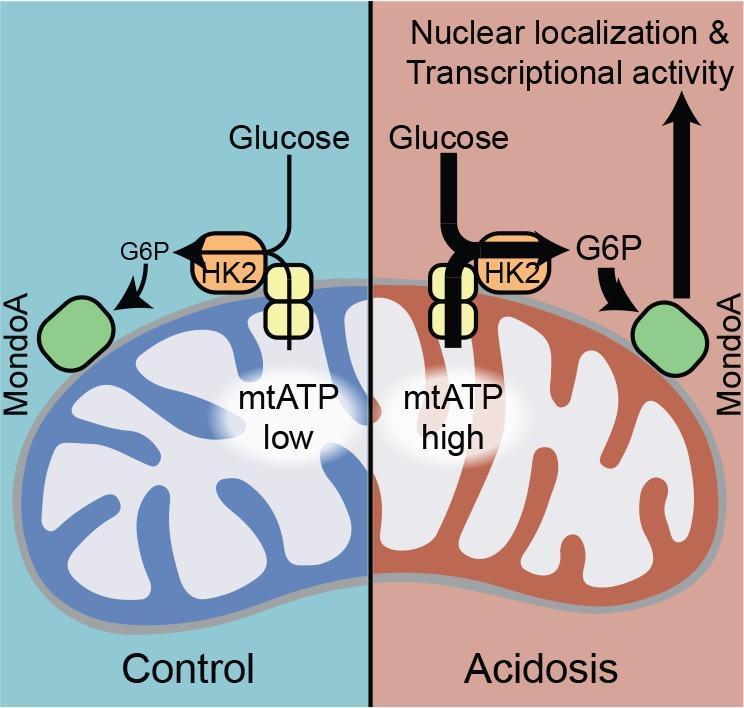
This pathophysiology diagram illustrates the cellular mechanism by which acidosis regulates MondoA transcriptional activity. The schematic is divided into two comparative states: 'Control' (blue background) and 'Acidosis' (red background). Key components include a mitochondrion, Hexokinase 2 (HK2), the MondoA protein, and metabolic intermediates glucose and glucose-6-phosphate (G6P). Under control conditions, mitochondrial ATP (mtATP) levels are low, and HK2 is bound to the outer mitochondrial membrane. Glucose is converted to G6P by HK2, resulting in basal MondoA interaction. In the 'Acidosis' state, a shift in pH drives a significant increase in mtATP production. This high mtATP concentration facilitates enhanced HK2 enzymatic activity at the mitochondrial surface, leading to increased production of G6P. The elevated G6P levels trigger MondoA to undergo nuclear localization and increased transcriptional activity, as indicated by a large upward arrow toward the nucleus. This diagram demonstrates how metabolic sensing of mitochondrial energy charge and cytoplasmic glucose levels are integrated via HK2 to control gene expression under conditions of metabolic stress or altered pH.
respiratory acidosis alkalosis compensation formula expected
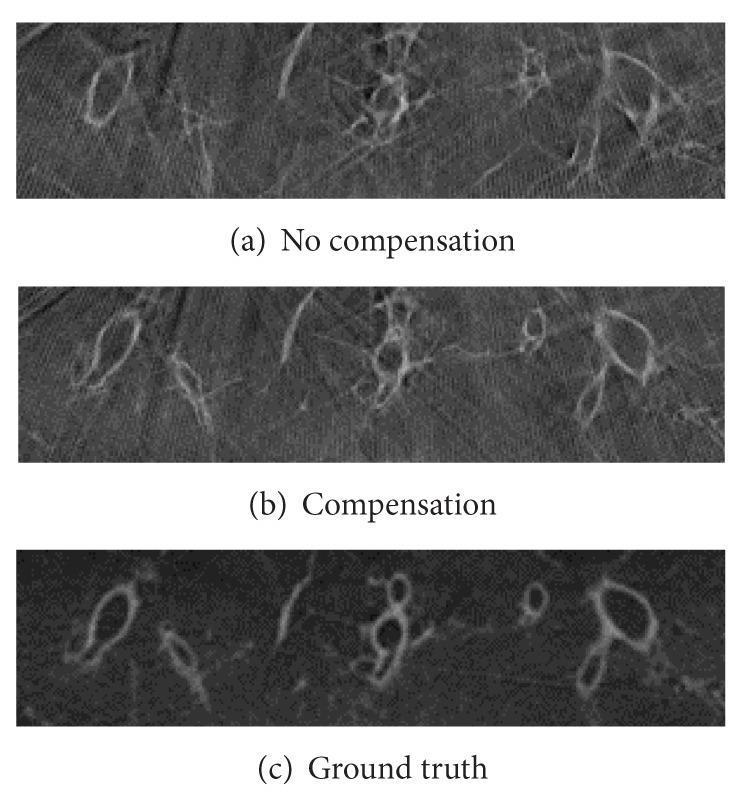
This diagnostic comparison image demonstrates the efficacy of respiratory motion compensation in pulmonary C-arm CT imaging. The visual includes three comparative slices (a, b, and c) of a porcine lung phantom scan captured over a 20-second period. Panel (a), labeled 'No compensation,' shows significant motion artifacts where the cross-sections of airways are severely distorted, blurred, and lack clear anatomical definition. Panel (b), labeled 'Compensation,' displays the results of a motion-compensated reconstruction algorithm; the contours of the airways are significantly improved and more accurately positioned, though some residual background noise remains. Panel (c), labeled 'Ground truth,' provides the static reference reconstruction, showing sharp, well-defined airway walls and clear anatomical structures with minimal noise. The comparison illustrates how algorithmic compensation for respiratory motion can restore diagnostic quality in thoracic imaging by reducing artifacts and improving the visibility of fine pulmonary details.
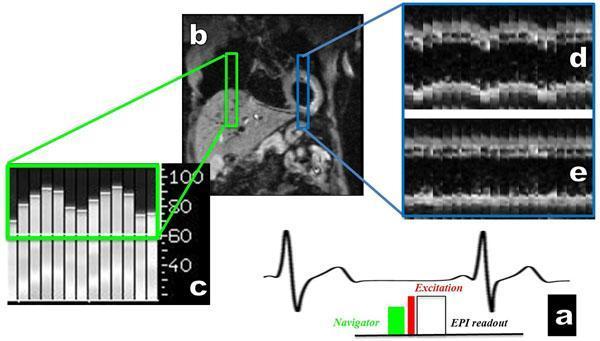
This composite educational image illustrates the methodology and results of respiratory motion compensation in abdominal Magnetic Resonance Imaging (MRI). Panel (a) shows a schematic diagram of a pulse sequence, including a pencil-beam navigator, excitation pulse, and Echo Planar Imaging (EPI) readout synchronized with a respiratory cycle. Panel (b) is a coronal MRI scout image of the liver showing the placement of the navigator on the superior dome. Panel (c) displays a bar graph of navigator signals representing real-time diaphragmatic displacement. Panels (d) and (e) provide a side-by-side comparison of coronal diffusion-weighted images (b=30 s/mm2) acquired over one minute. Image (d) shows significant respiratory motion artifacts, appearing as jagged, discontinuous horizontal bands. In contrast, image (e) demonstrates the efficacy of 'slice following' motion correction, exhibiting smoother, more linear continuity and improved image stability. This content is designed for medical physics and radiology education, focusing on respiratory gating techniques and motion artifact reduction in abdominal imaging.
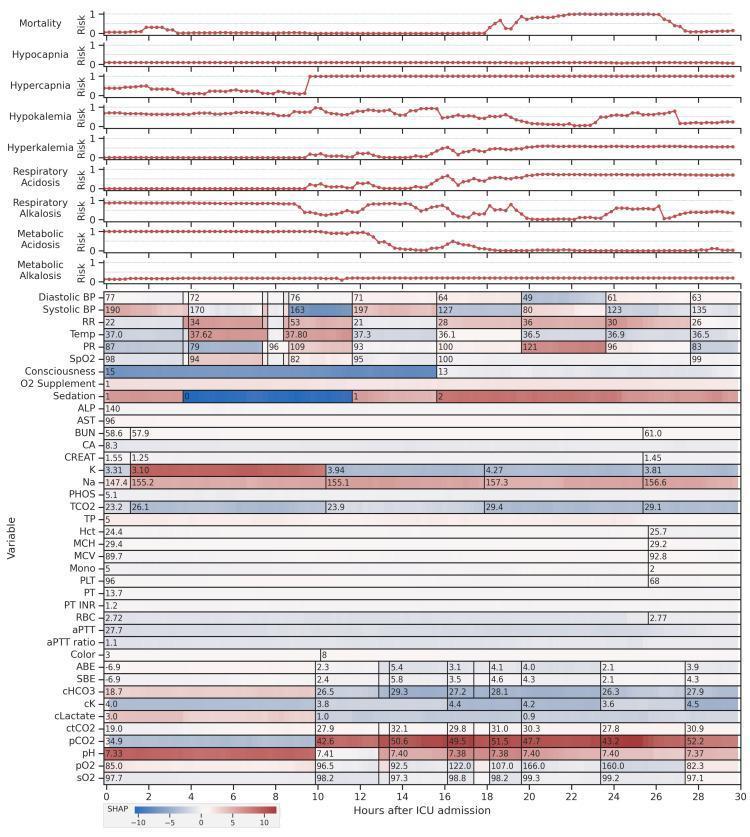
This infographic presents a feature visualization and model output dashboard for a single patient over a 30-hour Intensive Care Unit (ICU) stay. The top section contains time-series line graphs depicting predicted risk scores (0 to 1) for various clinical conditions, including Mortality, Hypocapnia, Hypercapnia, Hypokalemia, Hyperkalemia, and several types of Acid-Base imbalances (Respiratory/Metabolic Acidosis/Alkalosis). Below the risk scores, a heatmap-style grid displays longitudinal clinical variables, including vital signs (Systolic/Diastolic BP, Heart Rate, SpO2, Respiratory Rate, Temperature), consciousness levels, and laboratory results (Electrolytes, Renal Function, Blood Gas Analysis). Individual cells are color-coded based on SHAP (SHapley Additive exPlanations) values, ranging from blue (negative contribution to risk) to red (positive contribution to risk). This visualization assists in identifying specific physiological trends, such as fluctuating blood pressure and electrolyte imbalances, and provides explainable machine learning insights into which clinical parameters most significantly drive the model’s risk predictions at different time intervals.
🩸 ABG (Arterial Blood Gas) — Complete Teaching Notes
Primary Sources: Harrison's Principles of Internal Medicine 22E (2025), Comprehensive Clinical Nephrology 7E, Rosen's Emergency Medicine, Barash Clinical Anesthesia 9E, Symptom to Diagnosis 4E
SECTION 1: THE BASICS — What IS an ABG?
| Parameter | Normal Value | What it tells you |
|---|---|---|
| pH | 7.35 – 7.45 | Acid-base status of blood |
| PaCO₂ | 35 – 45 mmHg | Respiratory component (CO₂ is an acid) |
| PaO₂ | 80 – 100 mmHg | Oxygenation |
| HCO₃⁻ | 22 – 26 mEq/L | Metabolic/renal component |
| SaO₂ | 95 – 100% | Oxygen saturation of hemoglobin |
| BE (Base Excess) | -2 to +2 mEq/L | Metabolic component (positive = alkalosis, negative = acidosis) |
Key equation — Henderson-Hasselbalch: pH = 6.1 + log ([HCO₃⁻] / 0.03 × PaCO₂) Simplified: pH depends on the HCO₃⁻ / PaCO₂ ratio
SECTION 2: THE PHYSIOLOGY — CO₂ + H₂O ⇌ H₂CO₃ ⇌ HCO₃⁻ + H⁺
CO₂ + H₂O  ⇌  H₂CO₃  ⇌  HCO₃⁻  + H⁺
          carbonic      bicarbonate   hydrogen
           acid                        ion
Two Systems Regulate pH:
- Lungs (respiratory) — control PaCO₂ (fast, minutes)
- Kidneys (metabolic/renal) — control HCO₃⁻ (slow, days)
SECTION 3: THE FOUR PRIMARY DISORDERS
| Disorder | pH | Primary change | Compensatory response |
|---|---|---|---|
| Metabolic Acidosis | ↓ | HCO₃⁻ ↓ | Lungs blow off CO₂ → PaCO₂ ↓ |
| Metabolic Alkalosis | ↑ | HCO₃⁻ ↑ | Lungs retain CO₂ → PaCO₂ ↑ |
| Respiratory Acidosis | ↓ | PaCO₂ ↑ | Kidneys retain HCO₃⁻ → HCO₃⁻ ↑ |
| Respiratory Alkalosis | ↑ | PaCO₂ ↓ | Kidneys excrete HCO₃⁻ → HCO₃⁻ ↓ |
Golden Rule: Compensation never overshoots normal. It brings pH toward 7.4 but rarely reaches it. Only exception: Chronic respiratory alkalosis — can normalize pH completely.
SECTION 4: THE 6-STEP ABG ANALYSIS METHOD
✅ STEP 1 — Is the patient ACIDEMIC or ALKALEMIC?
- pH < 7.35 → Acidemia
- pH > 7.45 → Alkalemia
- pH 7.35–7.45 → Normal (but may still have a disorder — mixed!)
✅ STEP 2 — What is the PRIMARY disorder?
| pH ↓ (Acidemia) | Primary Disorder |
|---|---|
| PaCO₂ ↑ | Respiratory Acidosis |
| HCO₃⁻ ↓ | Metabolic Acidosis |
| pH ↑ (Alkalemia) | Primary Disorder |
|---|---|
| PaCO₂ ↓ | Respiratory Alkalosis |
| HCO₃⁻ ↑ | Metabolic Alkalosis |
Tip: The parameter that matches the direction of the pH change is the primary driver.
- pH ↓ + PaCO₂ ↑ → both going "wrong direction together" = respiratory acidosis
- pH ↓ + HCO₃⁻ ↓ → both down = metabolic acidosis
✅ STEP 3 — Is the COMPENSATION appropriate?
COMPENSATION FORMULAS (Harrison's 22E, Table S8-1):
| Disorder | Expected Compensation Formula |
|---|---|
| Metabolic Acidosis | PaCO₂ = (1.5 × HCO₃⁻) + 8 ± 2 (Winter's Equation) |
| OR: PaCO₂ ↓ 1.25 mmHg per 1 mEq/L ↓ in HCO₃⁻ | |
| Metabolic Alkalosis | PaCO₂ ↑ 0.7 mmHg per 1 mEq/L ↑ in HCO₃⁻ |
| Expected PaCO₂ = 40 + 0.7 × (HCO₃⁻ − 24) | |
| Respiratory Acidosis (Acute) | HCO₃⁻ ↑ 1 mEq/L per 10 mmHg ↑ in PaCO₂ |
| Respiratory Acidosis (Chronic) | HCO₃⁻ ↑ 3.5 mEq/L per 10 mmHg ↑ in PaCO₂ |
| Respiratory Alkalosis (Acute) | HCO₃⁻ ↓ 2 mEq/L per 10 mmHg ↓ in PaCO₂ |
| Respiratory Alkalosis (Chronic) | HCO₃⁻ ↓ 4 mEq/L per 10 mmHg ↓ in PaCO₂ |
How to use:
- Calculate the expected compensation
- Compare to the measured PaCO₂ or HCO₃⁻
- If measured ≠ expected → MIXED disorder
Example: Patient with metabolic acidosis, HCO₃⁻ = 12 mEq/L Expected PaCO₂ = (1.5 × 12) + 8 = 26 ± 2 = 24–28 mmHg
- If actual PaCO₂ = 26 → appropriate compensation → pure metabolic acidosis ✔
- If actual PaCO₂ = 20 → lower than expected → ALSO has respiratory alkalosis ⚠
- If actual PaCO₂ = 40 → higher than expected → ALSO has respiratory acidosis ⚠
✅ STEP 4 — Calculate the ANION GAP (if metabolic acidosis)
AG = Na⁺ − (HCO₃⁻ + Cl⁻) Normal = 8–12 mEq/L (some labs use 12 ± 4)
Albumin Correction:
Corrected AG = Measured AG + 2.5 × (4 − measured albumin g/dL) This is critical in hypoalbuminemic patients (ICU, cirrhosis, nephrotic syndrome)
✅ STEP 5 — Identify the CAUSE using MUDPILES vs HARDUP
HIGH Anion Gap Metabolic Acidosis — MUDPILES:
| Letter | Cause |
|---|---|
| M | Methanol |
| U | Uremia (CKD, AKI) |
| D | Diabetic Ketoacidosis (DKA) |
| P | Propylene glycol / Paracetamol (acetaminophen) |
| I | Isoniazid / Iron / Inborn errors |
| L | Lactic acidosis ← most common (50% of all AG acidosis) |
| E | Ethylene glycol |
| S | Salicylates |
Lactic acidosis is #1. Always consider in shock, sepsis, tissue ischemia.
NORMAL Anion Gap (Hyperchloremic) Metabolic Acidosis — HARDUP:
| Letter | Cause |
|---|---|
| H | Hyperalimentation (TPN) |
| A | Acetazolamide / Addison's disease |
| R | Renal Tubular Acidosis (RTA) |
| D | Diarrhea ← most common |
| U | Ureteral diversions (ileal conduit) |
| P | Pancreatic fistula / saline infusion |
✅ STEP 6 — Calculate DELTA-DELTA (Δ/Δ) for High AG Acidosis
Δ/Δ = (Measured AG − Normal AG) / (Normal HCO₃⁻ − Measured HCO₃⁻) = (AG − 12) / (24 − HCO₃⁻)
| Δ/Δ Ratio | Meaning |
|---|---|
| < 1 | Concurrent normal AG metabolic acidosis (e.g., diarrhea + DKA) |
| 1 – 2 | Pure high AG metabolic acidosis |
| > 2 | Concurrent metabolic alkalosis (e.g., vomiting + lactic acidosis) |
Think of it this way: For every 1 mEq/L the AG rises, HCO₃⁻ should fall by 1. If HCO₃⁻ doesn't fall as much as expected → something is raising HCO₃⁻ (= hidden metabolic alkalosis). If HCO₃⁻ falls MORE than expected → additional source of acid is consuming HCO₃⁻ (= hidden non-AG acidosis).
SECTION 5: DETAILED DISORDERS — CAUSES, FEATURES, AND TREATMENT
🔴 1. METABOLIC ACIDOSIS
- Production of H⁺ (consumes HCO₃⁻) → high AG
- Loss of HCO₃⁻ (replaced by Cl⁻) → normal AG
Causes by AG:
- Lactic acidosis — type A (hypoxic: shock, cardiac arrest, mesenteric ischemia) vs type B (non-hypoxic: metformin, liver failure, seizures)
- DKA — insulin deficiency → ketone bodies (beta-hydroxybutyrate, acetoacetate) accumulate
- Uremia — sulfate, phosphate, urate accumulate
- Toxic alcohols — methanol → formic acid (retinal toxicity); ethylene glycol → oxalic acid (renal stones, AKI)
- Salicylates — uncouples oxidative phosphorylation → lactic acid + ketones; ALSO causes direct respiratory alkalosis (mixed picture)
- Diarrhea — HCO₃⁻-rich stool losses; urine AG negative
- RTA (Renal Tubular Acidosis):
- Type 1 (Distal): failure to excrete H⁺ → hyperchloremic acidosis; associated with nephrolithiasis, nephrocalcinosis
- Type 2 (Proximal): failure to reabsorb HCO₃⁻ → bicarbonaturia; associated with Fanconi syndrome
- Type 4: hypoaldosteronism → hyperkalemia + acidosis (opposite of other RTAs)
- Saline infusion (hyperchloremic acidosis)
Treatment of Metabolic Acidosis:
| Cause | Specific Treatment |
|---|---|
| DKA | Insulin infusion + fluids + K⁺ replacement |
| Lactic acidosis | Treat underlying cause (resuscitate shock, stop offending drugs) |
| Salicylate toxicity | Urinary alkalinization (IV NaHCO₃ to pH 7.5), HD if severe |
| Methanol/Ethylene glycol | Fomepizole (blocks alcohol dehydrogenase) + HD |
| Diarrhea | Fluid/electrolyte replacement |
| Type 1 RTA | Oral NaHCO₃ or potassium citrate |
| Type 2 RTA | NaHCO₃ + thiazide diuretics (paradoxically reduces bicarbonaturia) |
| Type 4 RTA | Treat hyperkalemia; fludrocortisone if hypoaldosteronism |
- NOT routinely recommended for lactic acidosis or DKA (can paradoxically worsen intracellular acidosis, causes hypernatremia, hypokalemia)
- Consider if pH < 7.1 to 7.15, especially in hyperchloremic (normal AG) acidosis
- Indicated in: salicylate toxicity (alkalinize urine), hyperkalemia-associated acidosis, RTA, severe acidemia with hemodynamic compromise
🔵 2. METABOLIC ALKALOSIS
- Gain of HCO₃⁻ (or equivalent base) — e.g., antacids, blood transfusions
- Loss of H⁺ — e.g., vomiting (loss of HCl), diuretics
- Generation phase: H⁺ lost or HCO₃⁻ gained
- Maintenance phase: kidneys fail to excrete the excess HCO₃⁻ (usually due to volume depletion → increased aldosterone → H⁺ excretion)
Classification by Urine Chloride (Cl⁻):
| Category | Urine Cl⁻ | Causes |
|---|---|---|
| Chloride-Responsive | < 25 mEq/L | Vomiting, NG suction, diuretics (stopped), post-hypercapnia, cystic fibrosis |
| Chloride-Unresponsive | > 40 mEq/L | Hyperaldosteronism, Cushing's, Bartter/Gitelman syndromes, exogenous steroids |
Urine Cl⁻ < 25 = "saline-responsive" (give fluids/NaCl) Urine Cl⁻ > 40 = "saline-resistant" (giving fluids won't help)
Treatment:
| Cause | Treatment |
|---|---|
| Vomiting/NG suction losses | IV Normal Saline + KCl (correct volume + K⁺) |
| Diuretic-induced | Stop or reduce diuretic; replace K⁺ and Cl⁻ |
| Hyperaldosteronism | Treat underlying cause; spironolactone; surgery (if adenoma) |
| Bartter/Gitelman syndrome | NSAIDs, K⁺/Mg²⁺ supplements |
| Severe alkalemia (pH > 7.6) | Consider IV HCl (via central line) or acetazolamide |
| Post-hypercapnia | Gradually reduce ventilation support; allow renal compensation |
🟠 3. RESPIRATORY ACIDOSIS
Acute vs Chronic:
| Feature | Acute | Chronic |
|---|---|---|
| Duration | Minutes to hours | Days to weeks |
| HCO₃⁻ change | ↑ 1 per 10 mmHg ↑ PaCO₂ | ↑ 3.5 per 10 mmHg ↑ PaCO₂ |
| pH change | More severe | Less severe (better compensated) |
| Example | Acute asthma attack, opioid OD | COPD with hypercapnia |
Causes:
- Opioids, benzodiazepines, sedatives
- Brain stem lesions, stroke
- Central sleep apnea
- Myasthenia gravis, Guillain-Barré
- ALS, muscular dystrophy
- Severe hypokalemia/hypophosphatemia
- Severe asthma, COPD exacerbation
- Pneumothorax, massive pleural effusion
- Pulmonary edema (late)
- Kyphoscoliosis, morbid obesity
- Flail chest, rib fractures
Treatment:
| Approach | Details |
|---|---|
| Primary goal | Restore ventilation — treat the cause |
| Opioid overdose | Naloxone IV |
| COPD exacerbation | Bronchodilators, steroids, NIV (BiPAP) |
| Severe respiratory failure | Intubation + mechanical ventilation |
| Mechanical ventilation settings | Increase RR and/or Tidal Volume to blow off CO₂ |
| Caution: Never use NaHCO₃ | Worsens respiratory acidosis by generating more CO₂ |
| Correct slowly in chronic | Rapid CO₂ correction in chronic hypercapnia → posthypercapnic metabolic alkalosis + cerebral vasoconstriction |
🟢 4. RESPIRATORY ALKALOSIS
Causes (THINK — "things that make you breathe fast"):
| Category | Examples |
|---|---|
| Hypoxia | PE, pneumonia, high altitude, anemia |
| Lung disease | Pulmonary fibrosis (interstitial), pulmonary edema (early) |
| CNS stimulation | Anxiety/panic, pain, fever, meningitis, stroke |
| Hormonal | Pregnancy (progesterone stimulates breathing), liver failure (cirrhosis) |
| Drugs | Salicylates (direct CNS stimulation), nicotine |
| Mechanical ventilation | Over-ventilation (iatrogenic) |
| Sepsis | Early sepsis — respiratory alkalosis is often the FIRST ABG abnormality |
Treatment:
- Treat underlying cause
- Anxiety/panic: Reassurance, controlled breathing, paper bag technique, anxiolytics (BZD)
- Pain: Analgesia
- Fever: Antipyretics
- Mechanical ventilation: Decrease RR or tidal volume
- Hypoxia-driven: Correct hypoxia first
- Salicylate toxicity: IV NaHCO₃ to alkalinize urine + hemodialysis if severe
SECTION 6: MIXED ACID-BASE DISORDERS
Common Mixed Patterns:
| Pattern | Clue | Classic Cause |
|---|---|---|
| Metabolic acidosis + Respiratory alkalosis | pH near normal; PaCO₂ lower than expected for MA | Salicylate toxicity, sepsis, hepatic failure, critically ill with hyperventilation |
| Metabolic alkalosis + Respiratory acidosis | pH near normal; PaCO₂ higher than expected for MA | COPD + diuretics, decompensated HF + diuresis, vomiting + CO₂ retention |
| Metabolic alkalosis + Respiratory alkalosis | Markedly elevated pH | Cirrhosis + vomiting, mechanical over-ventilation + NG suction |
| High AG + Normal AG acidosis | Δ/Δ < 1 | DKA + diarrhea, lactic acidosis + RTA |
| High AG acidosis + Metabolic alkalosis | Δ/Δ > 2; pH less acidic than expected | Lactic acidosis + vomiting, DKA + hyperemesis |
| Triple disorder | Δ/Δ off, compensation off | Salicylate + vomiting, or complex ICU patients |
Key insight from Comprehensive Nephrology: In a mixed metabolic acidosis + respiratory alkalosis, pH may be near normal, masking the severity. Always calculate expected compensation and Δ/Δ in every ABG.
SECTION 7: OXYGENATION ASSESSMENT
PaO₂:
- Normal: 80–100 mmHg on room air
- Hypoxemia: PaO₂ < 80 mmHg (mild), <60 mmHg (moderate/severe)
SaO₂:
- Normal: >95%
- Note: SpO₂ (pulse oximetry) may be falsely normal in CO poisoning and methemoglobinemia — ABG-measured SaO₂ is more accurate in these cases.
P/F Ratio (PaO₂/FiO₂):
| P/F Ratio | Classification |
|---|---|
| > 300 | Normal |
| 200–300 | Mild ARDS |
| 100–200 | Moderate ARDS |
| < 100 | Severe ARDS |
A-a Gradient (Alveolar-arterial O₂ gradient):
PAO₂ = (FiO₂ × [Patm − PH₂O]) − (PaCO₂ / RQ) On room air (FiO₂ = 0.21): PAO₂ ≈ 150 − (PaCO₂ / 0.8) A-a gradient = PAO₂ − PaO₂ Normal: < 10–15 mmHg (increases with age: upper limit ≈ Age/4 + 4)
| A-a Gradient | Indicates |
|---|---|
| Normal | Hypoventilation (CNS cause, neuromuscular) |
| Elevated | V/Q mismatch, diffusion defect, shunt |
SECTION 8: PRACTICAL WORKED EXAMPLES
Example 1: COPD Exacerbation
- pH 7.28 → Acidemia
- PaCO₂ ↑, HCO₃⁻ ↑ → Primary respiratory acidosis + metabolic compensation
- Is compensation appropriate? Expected HCO₃⁻ for chronic: ↑ 3.5 per 10 mmHg → ΔPaCO₂ = 68−40 = 28 mmHg → Expected HCO₃⁻ = 24 + (28/10 × 3.5) = 24 + 9.8 = ~34. Measured = 31 → slightly less than expected → mild concomitant metabolic acidosis (possibly from lactic acidosis or bicarb loss from diuretics)
- No metabolic acidosis algorithm needed Dx: Chronic respiratory acidosis (COPD) with inadequate compensation (possible mixed) Tx: NIV (BiPAP), bronchodilators, steroids; supplemental O₂ titrated to SpO₂ 88–92%
Example 2: DKA
- pH 7.18 → Acidemia
- HCO₃⁻ ↓ → Primary metabolic acidosis
- Winter's: Expected PaCO₂ = 1.5(7) + 8 = 18.5 ± 2 = 16.5–20.5 → Measured 20 → appropriate compensation
- AG = 138 − (7 + 100) = 31 → High AG → MUDPILES
- Δ/Δ = (31−12)/(24−7) = 19/17 = 1.12 → Pure high AG acidosis Dx: High anion gap metabolic acidosis (DKA) Tx: Insulin infusion, IV fluids (NS initially, then ½NS), K⁺ replacement (do NOT give insulin until K⁺ >3.5), monitor glucose hourly
Example 3: Salicylate Toxicity (Classic Mixed)
- pH 7.47 → Alkalemia
- PaCO₂ ↓ → Primary respiratory alkalosis
- Is compensation appropriate? Acute respiratory alkalosis: expected HCO₃⁻ drop = (40−25)/10 × 2 = 3 mEq/L → expected HCO₃⁻ = 24−3 = 21. Measured HCO₃⁻ = 17 → lower than expected → additional metabolic acidosis
- AG = 140 − (17+100) = 23 → elevated → High AG metabolic acidosis Dx: Mixed respiratory alkalosis + high AG metabolic acidosis = Salicylate toxicity until proven otherwise Tx: IV NaHCO₃ to alkalinize urine (target urine pH >7.5) + urinary monitoring + hemodialysis if severe toxicity, AKI, or CNS symptoms
Example 4: Vomiting (Metabolic Alkalosis)
- pH 7.55 → Alkalemia
- HCO₃⁻ ↑ → Primary metabolic alkalosis
- Compensation: Expected PaCO₂ = 40 + 0.7×(40−24) = 40 + 11.2 = 51.2 → Measured 48 → appropriate Dx: Pure metabolic alkalosis (vomiting — loss of HCl) Tx: IV Normal Saline + KCl (replace Cl⁻ and K⁺), stop NG suction if applicable; urine Cl⁻ will be low (<25 mEq/L) confirming chloride-responsive
SECTION 9: URINE ANION GAP — For Normal AG Metabolic Acidosis
- GI loss of HCO₃⁻ (diarrhea)
- Renal loss of HCO₃⁻ (RTA)
| UAG | Interpretation |
|---|---|
| Negative (< 0) | NH₄⁺ excretion ↑ → Kidneys working fine → GI cause (diarrhea) |
| Positive (> 0) | NH₄⁺ excretion ↓ → Kidneys failing to acidify → RTA |
SECTION 10: COMPLETE ABG SHORT FORMS TABLE
| Abbreviation | Full Term |
|---|---|
| ABG | Arterial Blood Gas |
| pH | Power of Hydrogen (measure of acidity) |
| PaCO₂ | Partial pressure of CO₂ in arterial blood |
| PaO₂ | Partial pressure of O₂ in arterial blood |
| HCO₃⁻ | Bicarbonate ion |
| SaO₂ | Arterial O₂ saturation (measured by ABG) |
| SpO₂ | Peripheral O₂ saturation (pulse ox) |
| BE | Base Excess |
| AG | Anion Gap |
| UAG | Urine Anion Gap |
| MA | Metabolic Acidosis |
| MAlk | Metabolic Alkalosis |
| RA | Respiratory Acidosis |
| RAlk | Respiratory Alkalosis |
| P/F | PaO₂/FiO₂ ratio |
| A-a | Alveolar-arterial gradient |
| PAO₂ | Alveolar partial pressure of O₂ |
| FiO₂ | Fraction of inspired oxygen |
| RQ | Respiratory quotient (≈0.8) |
| DKA | Diabetic Ketoacidosis |
| RTA | Renal Tubular Acidosis |
| HAGMA | High Anion Gap Metabolic Acidosis |
| NAGMA | Normal Anion Gap Metabolic Acidosis |
| Δ/Δ | Delta-Delta ratio |
| NIV | Non-Invasive Ventilation |
| BiPAP | Bilevel Positive Airway Pressure |
| ARDS | Acute Respiratory Distress Syndrome |
| HD | Hemodialysis |
| NH₄⁺ | Ammonium ion |
| CKD/AKI | Chronic/Acute Kidney Disease/Injury |
📋 SUMMARY TABLE — The Master Reference
| Disorder | pH | PaCO₂ | HCO₃⁻ | Compensation Formula | Common Causes | Treatment |
|---|---|---|---|---|---|---|
| Met. Acidosis | ↓ | ↓ (comp) | ↓ (primary) | PaCO₂ = 1.5×HCO₃⁻ + 8 ± 2 | DKA, lactic acidosis, uremia, diarrhea, RTA | Treat cause; NaHCO₃ if pH <7.1 |
| Met. Alkalosis | ↑ | ↑ (comp) | ↑ (primary) | PaCO₂ = 40 + 0.7×(HCO₃⁻−24) | Vomiting, diuretics, hyperaldosteronism | NS + KCl (if Cl-responsive); treat cause |
| Resp. Acidosis (acute) | ↓ | ↑ (primary) | ↑ 1/10 (comp) | HCO₃⁻ ↑ 1 per 10 mmHg ↑ PaCO₂ | Opioids, asthma, pneumothorax | Naloxone, NIV, intubation |
| Resp. Acidosis (chronic) | ↓ (mild) | ↑ (primary) | ↑ 3.5/10 (comp) | HCO₃⁻ ↑ 3.5 per 10 mmHg ↑ PaCO₂ | COPD, obesity hypoventilation | NIV/BiPAP, bronchodilators |
| Resp. Alkalosis (acute) | ↑ | ↓ (primary) | ↓ 2/10 (comp) | HCO₃⁻ ↓ 2 per 10 mmHg ↓ PaCO₂ | Anxiety, pain, PE, early sepsis | Treat cause; controlled breathing |
| Resp. Alkalosis (chronic) | ↑→normal | ↓ (primary) | ↓ 4/10 (comp) | HCO₃⁻ ↓ 4 per 10 mmHg ↓ PaCO₂ | Pregnancy, cirrhosis, altitude | Treat cause |
📋 THE 6-STEP QUICK REFERENCE CARD
STEP 1: pH < 7.35 = Acidemia | pH > 7.45 = Alkalemia
STEP 2: Identify primary: PaCO₂ matches pH change = respiratory
                         HCO₃⁻ matches pH change = metabolic
STEP 3: Check compensation (Winter's, 0.7 rule, 1/10, 3.5/10, 2/10, 4/10)
        → If actual ≠ expected = MIXED disorder
STEP 4: Calculate AG = Na - (HCO₃ + Cl). Correct for albumin.
        → AG > 12 = High AG = MUDPILES
        → AG normal = Normal AG = HARDUP
STEP 5: Calculate Δ/Δ = (AG-12)/(24-HCO₃)
        → <1 = hidden NAGMA | 1-2 = pure HAGMA | >2 = hidden Met Alkalosis
STEP 6: Assess oxygenation: PaO₂, P/F ratio, A-a gradient
Sources:
- Harrison's Principles of Internal Medicine, 22E (2025) — Table S8-1 Compensation formulas, Chapter 58
- Comprehensive Clinical Nephrology, 7E — Mixed acid-base disorders, Winters formula
- Rosen's Emergency Medicine — MUDPILES, HARDUP, 3-step ABG algorithm, clinical worked examples
- Barash, Cullen & Stoelting's Clinical Anesthesia, 9E — Step-by-step ABG interpretation (Table 16-8)
- Symptom to Diagnosis, 4E — Clinical case-based ABG analysis framework