
Mujhe asaan bhasa mein descending tracts , pyramidal tract extrapyramidal tract samjhao images ki madad se
pyramidal tract corticospinal tract descending motor pathways diagram
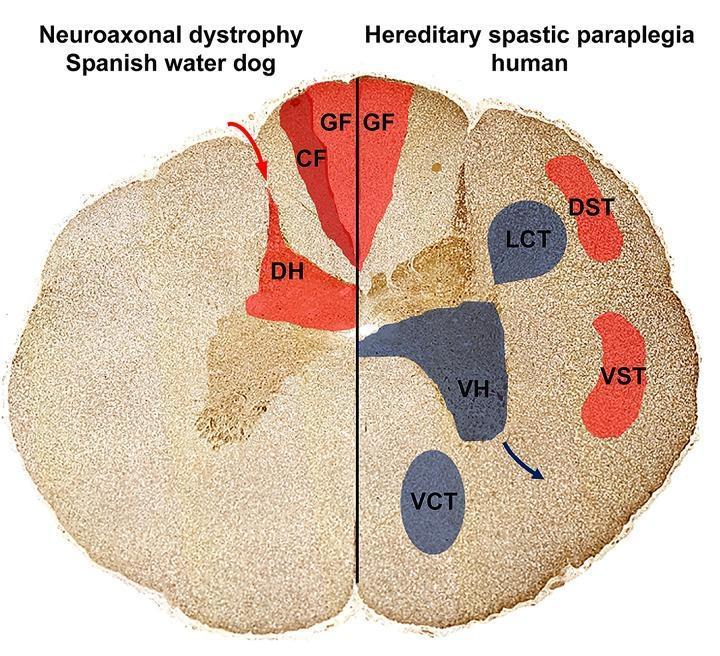
This Comparison Diagram presents a cross-sectional illustration of the spinal cord, contrasting the localization of axonal spheroids and neuronal loss in Neuroaxonal Dystrophy (NAD) and Hereditary Spastic Paraplegia (HSP). The diagram is split into two halves: the left represents a Spanish Water Dog with NAD, and the right represents human HSP. Ascending sensory pathways are highlighted in red, including the Gracile Fasciculus (GF), Cuneate Fasciculus (CF), and Dorsal Horn (DH) on the NAD side, and GF, Dorsal Spinocerebellar Tract (DST), and Ventral Spinocerebellar Tract (VST) on the HSP side. Descending motor pathways, affected only in the HSP model, are highlighted in blue, depicting the Lateral Corticospinal Tract (LCT), Ventral Corticospinal Tract (VCT), and Ventral Horn (VH). The visual demonstrates that in NAD, pathology is restricted to sensory, ascending tracts in the dorsal funiculus and dorsal horn. In contrast, human HSP shows involvement of both sensory pathways and descending motor pathways (pyramidal tracts and ventral horns). This diagram illustrates the pathophysiology of upper motor neuron and sensory system degeneration relevant to neurology and neurohistology.
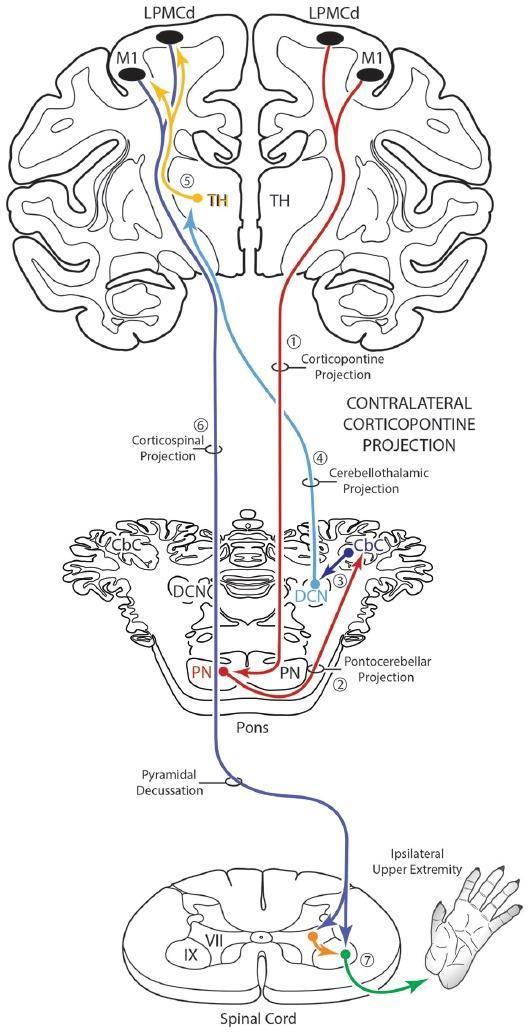
This medical schematic diagram illustrates the motor cerebrocerebellar system, highlighting both classical pathways and a modification involving the contralateral corticopontine projection (cCPP). The diagram is organized into four vertical levels: the cerebral cortex (top), thalamus (TH), pons and cerebellum (middle), and spinal cord with ipsilateral upper extremity (bottom). Key anatomical structures labeled include the Primary Motor Cortex (M1), Dorsal Lateral Premotor Cortex (LPMCd), Thalamus (TH), Pontine Nuclei (PN), Deep Cerebellar Nuclei (DCN), Cerebellar Cortex (CbC), and Pyramidal Decussation. Functional pathways depicted include: 1. Corticopontine Projection: Highlighting the cCPP (labeled 1, in red) originating from the motor cortex and crossing to the contralateral PN. 2. Pontocerebellar Projection (2): From the PN to the cerebellar cortex. 3. Cerebellothalamic Projection (4): From the DCN to the contralateral TH (blue line). 4. Corticospinal Projection (6): Descending from the cortex, crossing at the pyramidal decussation, and terminating in the spinal cord (purple line). This diagram demonstrates how a bilateral corticopontine projection allows one hemisphere to theoretically influence both the contralateral and ipsilateral limbs through multisynaptic cerebellar circuits, aiding in complex motor coordination.
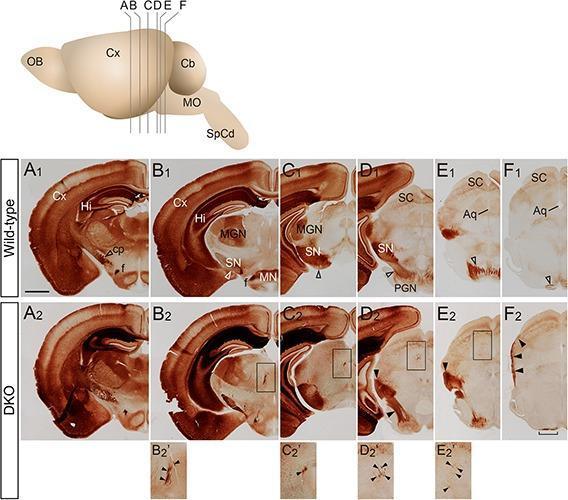
This diagnostic image series presents a comparative neuroanatomical study of the corticospinal tract (CST) using PKCγ-stained coronal sections of adult brains. The top panel provides an anatomical diagram showing the sectioning planes (A–F) from the cerebral cortex (Cx) through the midbrain to the medulla oblongata (MO). The main panel compares wild-type (A1–F1) with Sulf1/2 double knockout (DKO) (A2–F2) specimens. Normal CST fibers are visible in the wild-type sections as discrete staining in the cerebral peduncle (cp) and descending medially toward the pons (PGN). In the DKO specimens, significant axonal pathfinding errors are evident. Key pathologies demonstrated include misdirected fibers projecting dorsally onto the midbrain surface (E2–F2, filled arrowheads) and ectopic fibers traversing the thalamus toward the superior colliculus (SC), highlighted in high-magnification inserts (B2'–E2'). Additionally, the DKO pyramidal tract appears thinned and widened (F2, bracket) compared to the wild-type control. These findings illustrate the role of sulfatase enzymes in regulating the precise guidance of descending motor pathways during neurodevelopment.
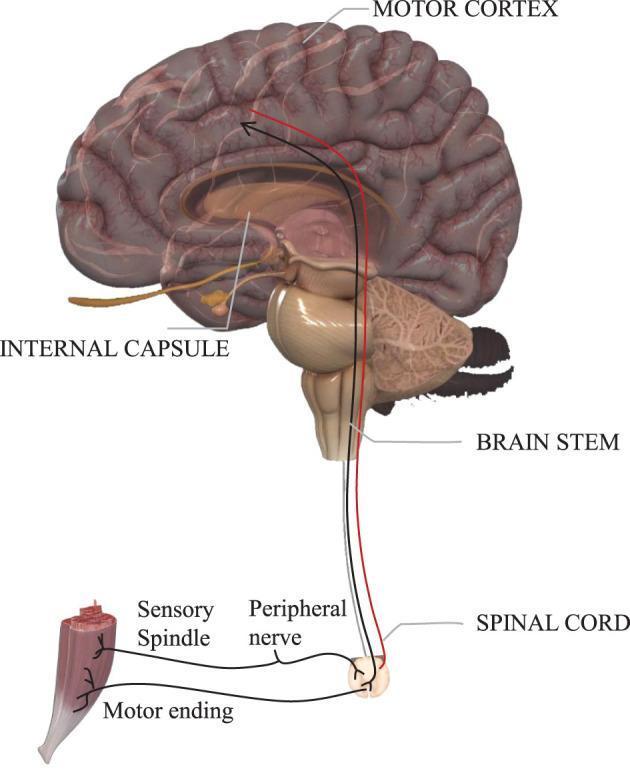
An anatomical diagram illustrating the descending motor pathways from the brain to the skeletal muscle. The visual highlights the relationship between the central and peripheral nervous systems. Key structures labeled include the motor cortex (the origin of voluntary movement), the internal capsule, the brainstem, and the spinal cord. Two distinct neural tracts are color-coded: a red pathway representing the pyramidal tract for voluntary muscle control, and a black pathway representing involuntary or extrapyramidal motor systems. These pathways descend through the brainstem into the spinal cord, where they synapse with a peripheral nerve. The diagram further details the innervation of a muscle fiber, showing the motor ending (neuromuscular junction) and a sensory spindle, illustrating the feedback loop between muscle tension and the spinal cord. This infographic is designed to teach the neuroanatomical distinction between voluntary and involuntary motor control and the physical sequence of nerve conduction.
extrapyramidal tract basal ganglia motor system diagram
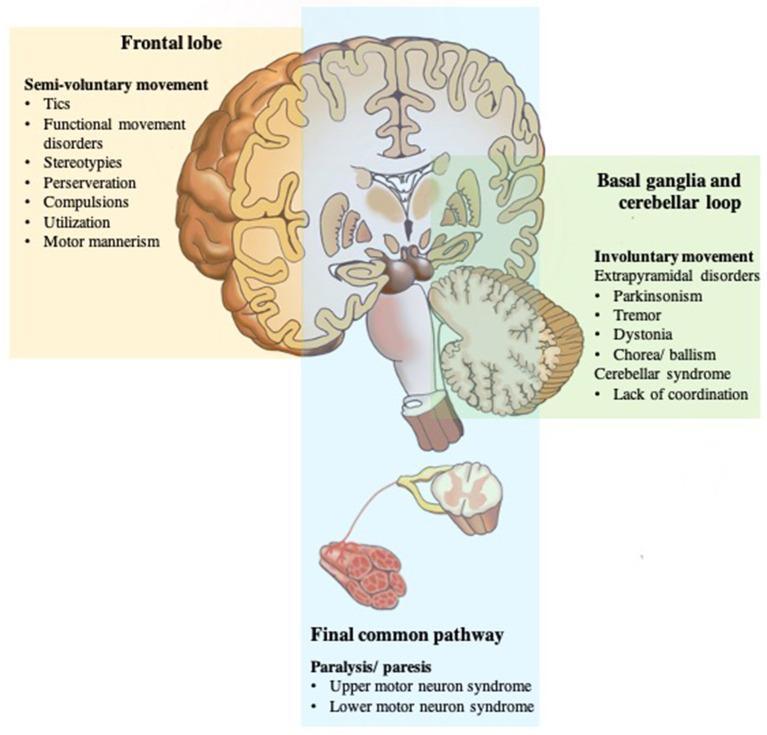
An anatomical diagram and pathophysiology illustration of the human motor system, categorizing neuroanatomical structures by their functional roles and associated clinical disorders. The diagram utilizes color-coded regions overlaid on a coronal brain section, brainstem, spinal cord, and muscle. The yellow region highlights the frontal lobe, associated with 'semi-voluntary movement' disorders such as tics, functional movement disorders, stereotypies, and compulsions. The green region encompasses the basal ganglia and cerebellar loop, linked to 'involuntary movement' and extrapyramidal disorders, including parkinsonism, tremor, dystonia, chorea/ballism, and cerebellar syndromes. The blue region represents the 'final common pathway,' including the primary motor cortex, corticospinal tract, spinal cord, and peripheral nerves, associated with paralysis and paresis (upper and lower motor neuron syndromes). The visual serves as an educational framework for differentiating movement disorders based on their neuroanatomical site of dysfunction, illustrating the integrated nature of motor control from cortical initiation to peripheral execution.
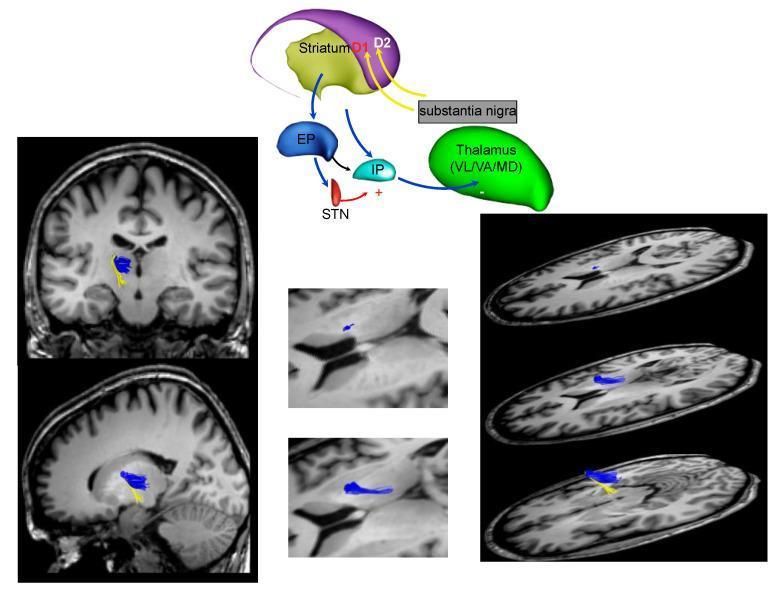
This composite educational graphic details the neuroanatomy and connectivity of the basal ganglia network, specifically focusing on the fronto-striatal circuit. It consists of a functional schematic diagram paired with MRI diffusion tractography images. The schematic illustrates key nodes including the Striatum (containing D1 and D2 pathways), Substantia Nigra, Thalamus (VL/VA/MD nuclei), Globus Pallidus (EP/IP), and the Subthalamic Nucleus (STN). Arrows indicate excitatory and inhibitory pathways, highlighting the indirect and direct pathways of motor control relevant to Parkinson's disease. The accompanying MRI panels (coronal, sagittal, and axial views) show white matter fiber reconstruction using tractography. These panels visualize axonal connections between the striatum and thalamic nuclei, color-coded in blue and yellow to represent distinct fiber bundles. The resource is designed to teach the neurobiological basis of extrapyramidal signs and the localization of basal ganglia dysfunction in clinical neurology.
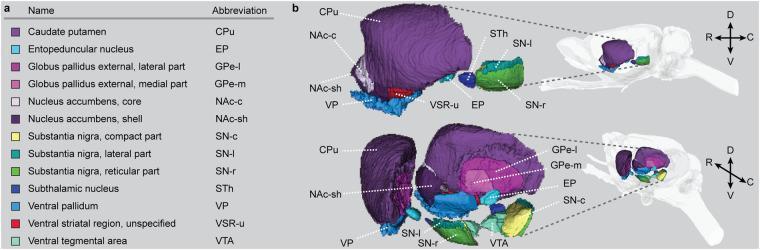
This anatomical diagram presents a three-dimensional mapping of the basal ganglia regions within a rat brain model (WHS rat brain atlas v4). Panel (a) provides a color-coded legend of structures, including the caudate putamen (CPu), nucleus accumbens core (NAc-c) and shell (NAc-sh), globus pallidus external segments (GPe-l/m), entopeduncular nucleus (EP), subthalamic nucleus (STh), substantia nigra parts (SN-c/l/r), ventral pallidum (VP), and ventral tegmental area (VTA). Panel (b) illustrates these structures in situ from lateral and lateral-caudal perspectives. The CPu is shown as the largest dorsal-lateral structure, while the nucleus accumbens is situated rostromedially and ventrally. The globus pallidus and entopeduncular nucleus are located deeper, with the substantia nigra complex and VTA occupying the more caudal and ventral midbrain positions. Spatial axes indicate dorsal (D), ventral (V), rostral (R), and caudal (C) orientations. The graphic serves as a neuroanatomical reference for identifying functional subregions within the rodent extrapyramidal motor system.
corticospinal tract upper motor neuron lower motor neuron spinal cord cross section
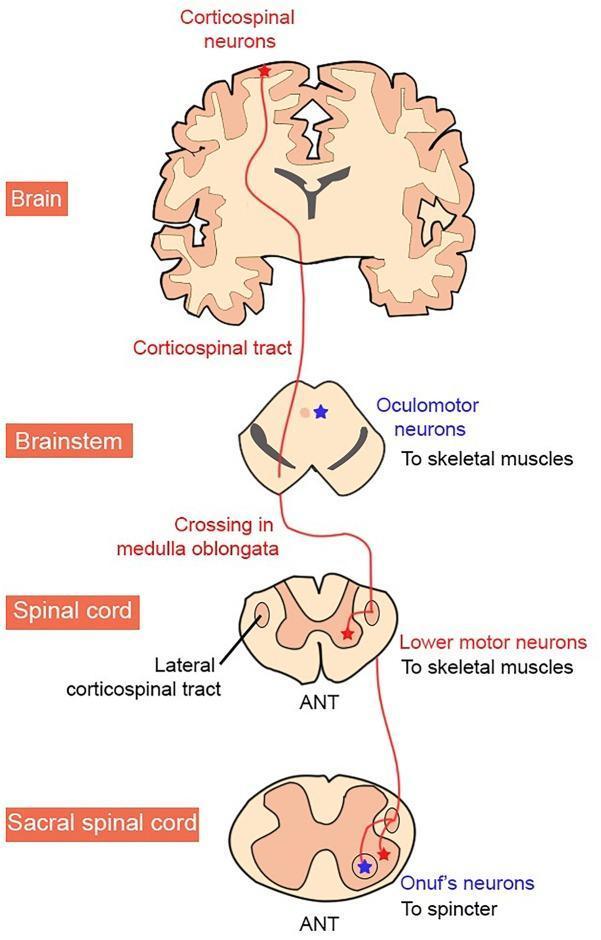
This medical anatomical diagram illustrates the organization of the human corticospinal tract and the selective vulnerability of motor neuron (MN) groups in Amyotrophic Lateral Sclerosis (ALS). The diagram follows the tract's descent through four anatomical levels: the Brain (cortex), Brainstem, Spinal Cord, and Sacral Spinal Cord. The pathway begins at upper motor neurons (corticospinal neurons) and descends through the brainstem, where it exhibits decussation at the medulla oblongata before continuing as the lateral corticospinal tract. The diagram highlights three specific targets: oculomotor neurons in the brainstem (innervating skeletal muscles), lower motor neurons in the spinal cord ventral horn, and Onuf's neurons in the sacral spinal cord (innervating sphincters). A color-coding scheme distinguishes neurodegeneration patterns: neurons labeled in red (corticospinal and typical lower motor neurons) represent groups vulnerable to degeneration in ALS, while those in blue (oculomotor and Onuf's neurons) represent groups characteristically resistant to the disease. The cross-sections of the spinal cord are labeled with 'ANT' to indicate anterior orientation.
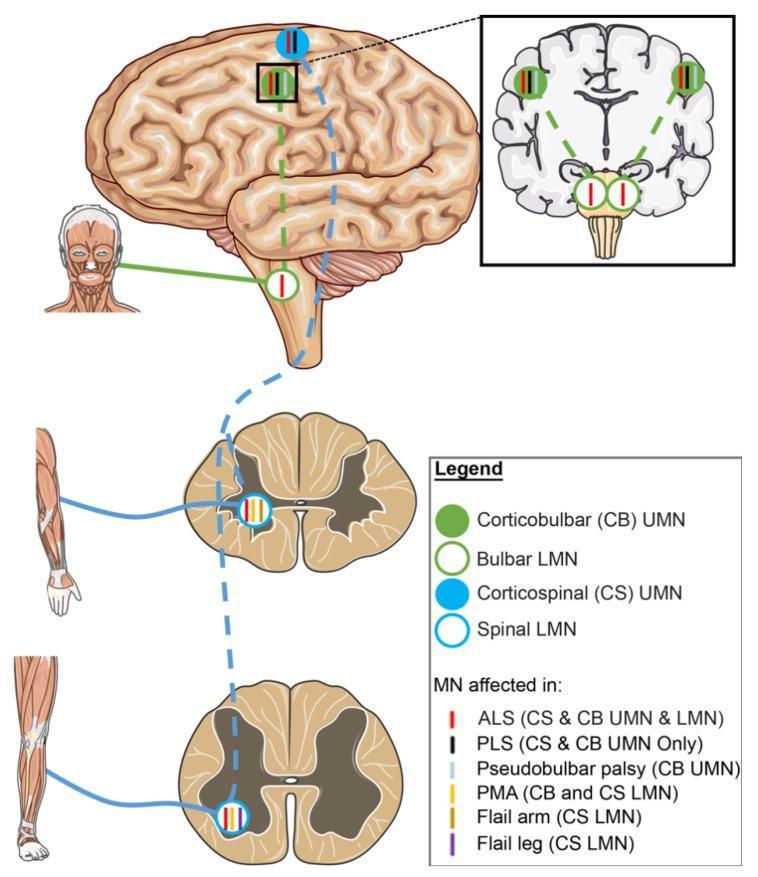
A medical schematic diagram illustrating the neuroanatomical pathways of upper motor neurons (UMN) and lower motor neurons (LMN) and their selective involvement in Amyotrophic Lateral Sclerosis (ALS) variants. The diagram features a lateral view of the human brain, a coronal section of the brain, and transverse sections of the spinal cord (cervical and lumbar levels). Two primary tracts are highlighted: the corticobulbar (CB) tract, represented by green solid circles (UMN) and open circles (LMN), and the corticospinal (CS) tract, represented by blue solid circles (UMN) and open circles (LMN). Solid circles represent UMN cell bodies in the motor cortex, while open circles denote LMNs in the brainstem (bulbar) and spinal cord. Colored vertical tick marks inside these circles indicate specific disease phenotypes: red for classic ALS (CS & CB UMN and LMN), black for Primary Lateral Sclerosis (PLS, UMN only), and yellow for Progressive Muscular Atrophy (PMA, LMN only). Other variants shown include Pseudobulbar palsy (CB UMN), Flail arm, and Flail leg (specific CS LMN segments). This illustration serves as an educational tool for differentiating motor neuron disease phenotypes based on the anatomical site of degeneration.
This Comparison Diagram presents a cross-sectional illustration of the spinal cord, contrasting the localization of axonal spheroids and neuronal loss in Neuroaxonal Dystrophy (NAD) and Hereditary Spastic Paraplegia (HSP). The diagram is split into two halves: the left represents a Spanish Water Dog with NAD, and the right represents human HSP. Ascending sensory pathways are highlighted in red, including the Gracile Fasciculus (GF), Cuneate Fasciculus (CF), and Dorsal Horn (DH) on the NAD side, and GF, Dorsal Spinocerebellar Tract (DST), and Ventral Spinocerebellar Tract (VST) on the HSP side. Descending motor pathways, affected only in the HSP model, are highlighted in blue, depicting the Lateral Corticospinal Tract (LCT), Ventral Corticospinal Tract (VCT), and Ventral Horn (VH). The visual demonstrates that in NAD, pathology is restricted to sensory, ascending tracts in the dorsal funiculus and dorsal horn. In contrast, human HSP shows involvement of both sensory pathways and descending motor pathways (pyramidal tracts and ventral horns). This diagram illustrates the pathophysiology of upper motor neuron and sensory system degeneration relevant to neurology and neurohistology.
🧠 Descending Tracts - Asaan Bhasha Mein Samjhao
Pehle Badi Picture Samjho
Do Major System Hain:
| Pyramidal Tract | Extrapyramidal Tract | |
|---|---|---|
| Kaam | Voluntary (iradaten wali) movement | Involuntary (automatic) movement |
| Example | Apni marzi se haath uthana | Balance, posture, chalne ki rhythm |
| Origin | Motor cortex | Basal ganglia, cerebellum, brainstem |
🔴 PART 1: PYRAMIDAL TRACT (Corticospinal Tract)
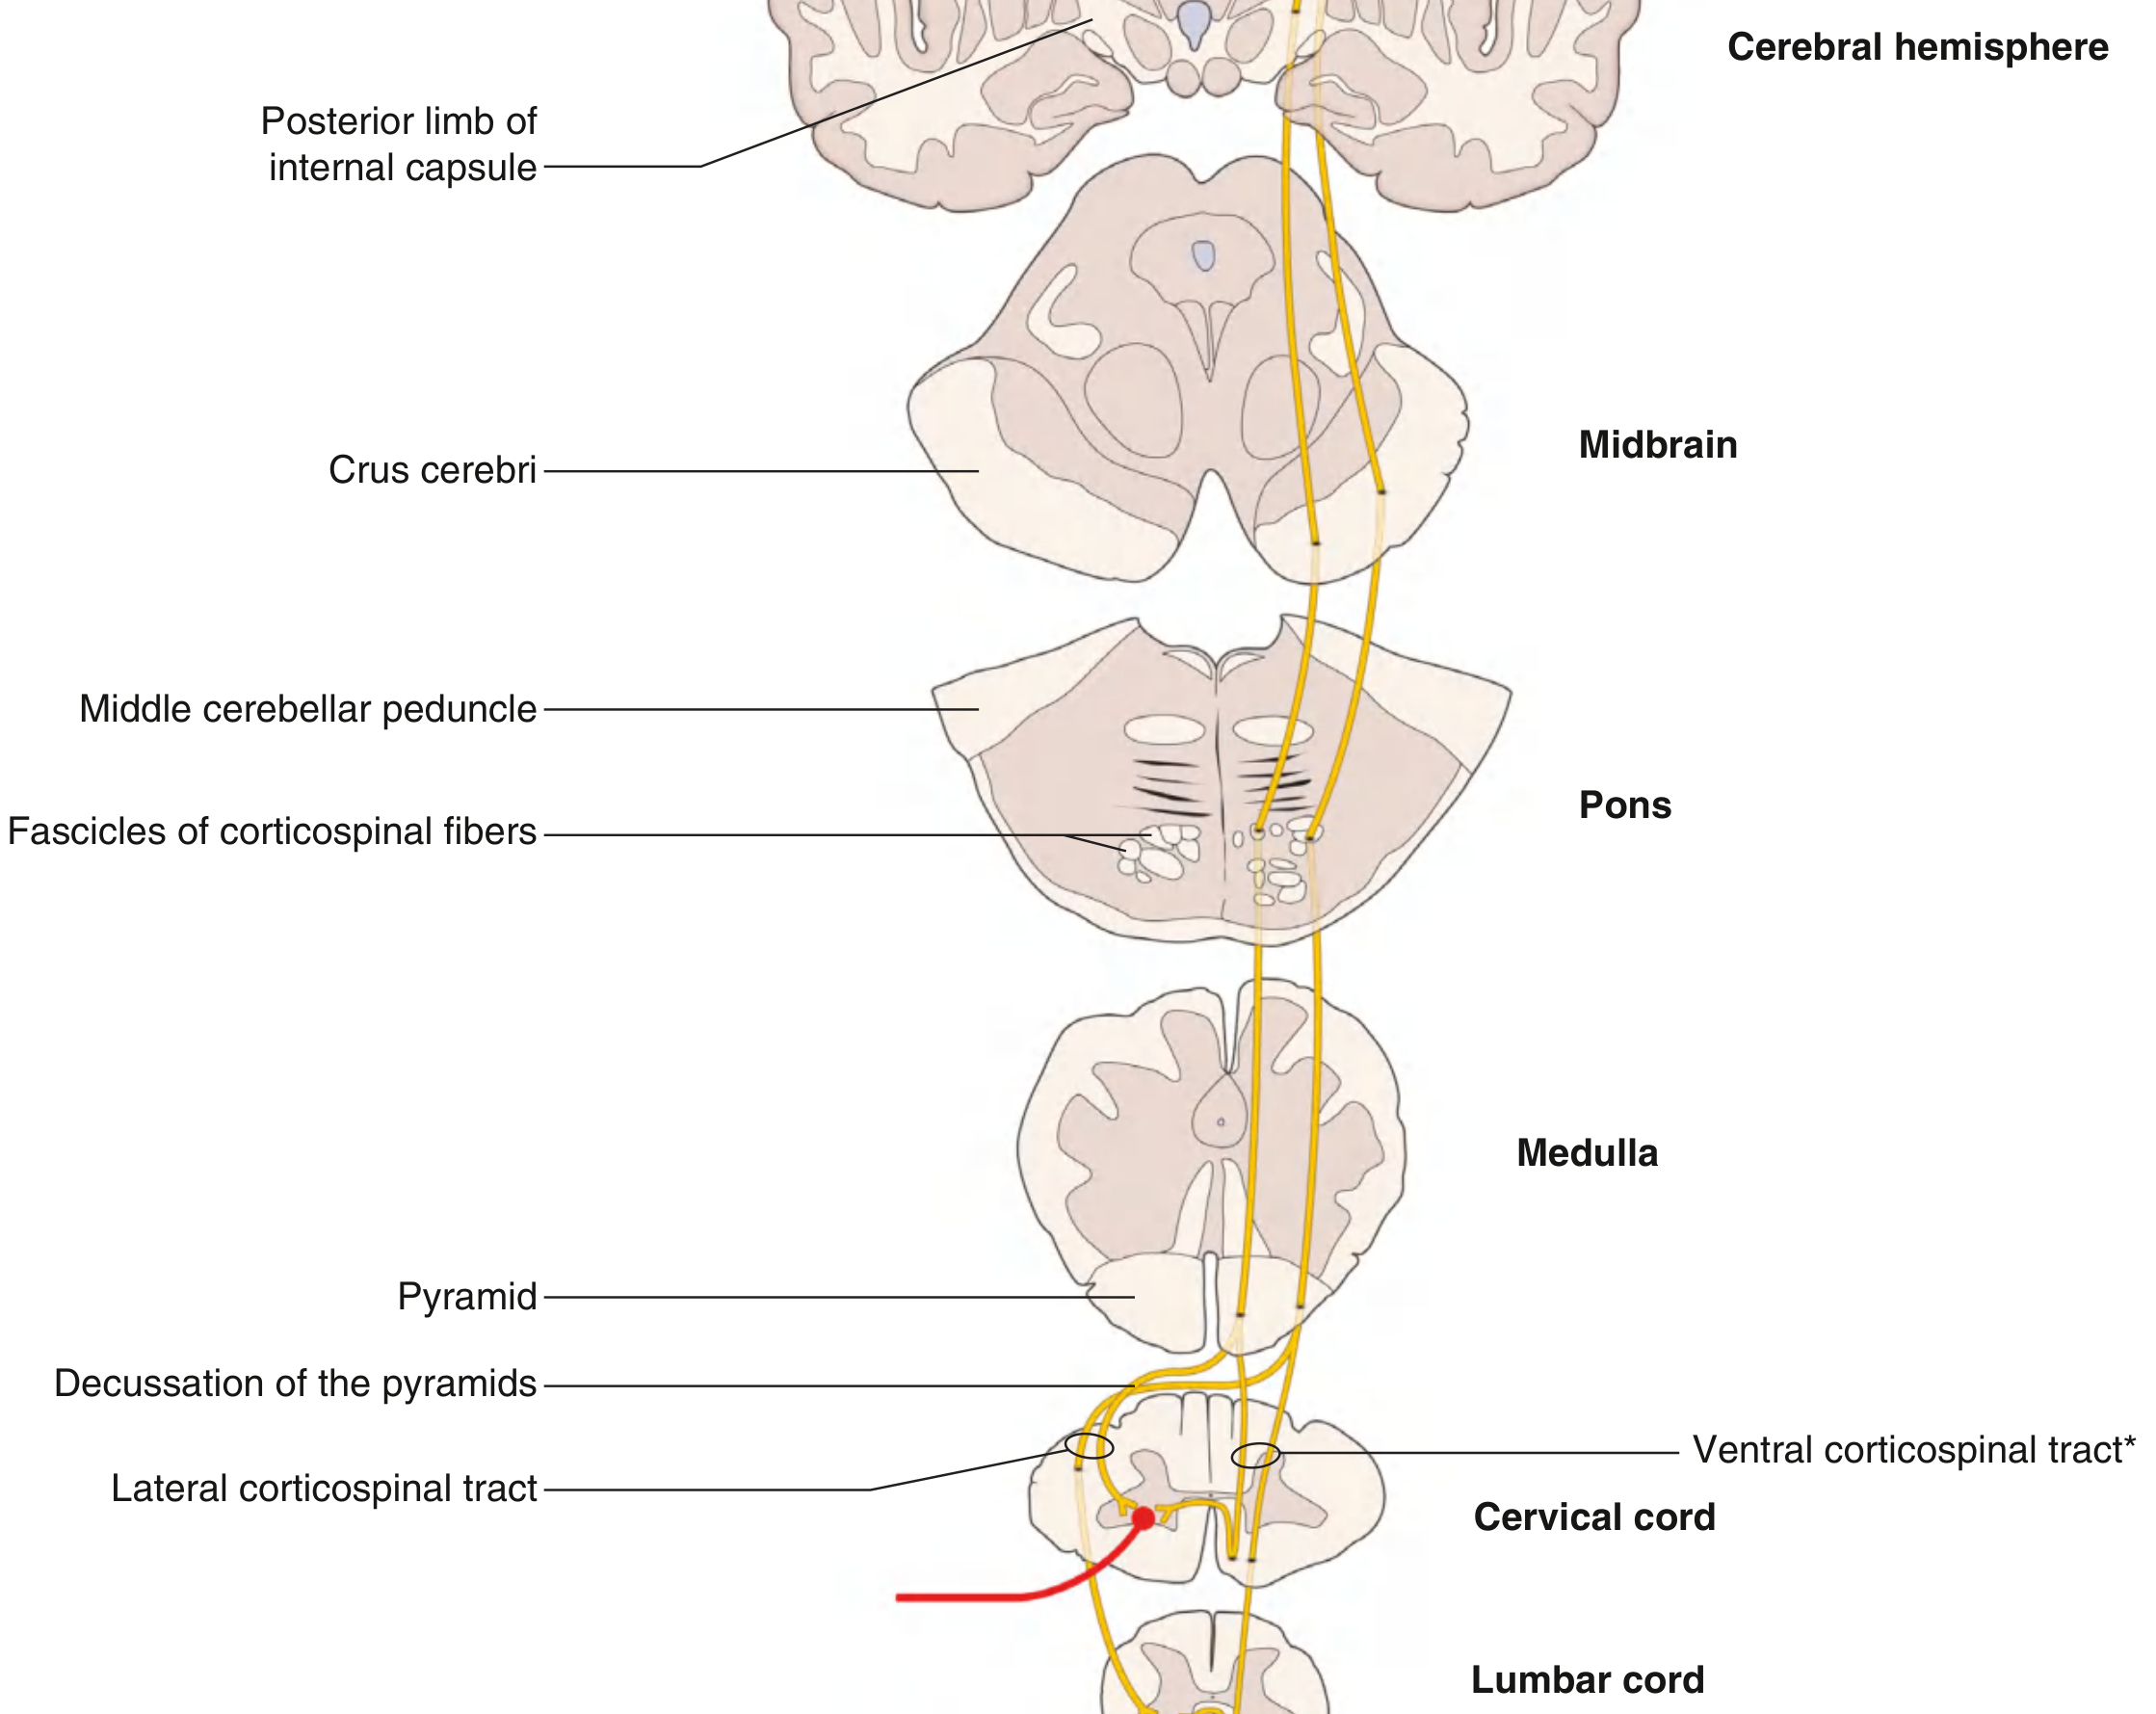
Seedha Raasta - Brain se Muscle tak:
Motor Cortex (brain ka motor area)
        ↓
Internal Capsule (posterior limb)
        ↓
Crus Cerebri (midbrain mein)
        ↓
Pons (choti choti fascicles mein toot jaata hai)
        ↓
Medulla (yahan "Pyramid" banta hai - isliye naam Pyramidal)
        ↓
🔀 DECUSSATION (yahan 85-90% fibres cross kar jaati hain - contralateral side)
        ↓
Lateral Corticospinal Tract (spinal cord ke lateral column mein)
        ↓
Lower Motor Neuron (anterior horn cells)
        ↓
MUSCLE
Yaad Rakhne wali Baat:
"Pyramid mein decussation hoti hai" - isliye left brain ki injury = right side ka paralysis. Yeh bahut exam mein poochhte hain!
Pyramidal Tract ke 2 Hisse:
| Tract | Kitne % fibres | Kahan cross karta hai | Kya control karta hai |
|---|---|---|---|
| Lateral Corticospinal | ~85-90% | Medulla mein (decussation of pyramids) | Haath aur paon ki fine movements |
| Anterior/Ventral Corticospinal | ~10-15% | Spinal cord level par | Trunk/axial muscles |
Spinal Cord Cross-Section Mein Tracts Kahan Hain?
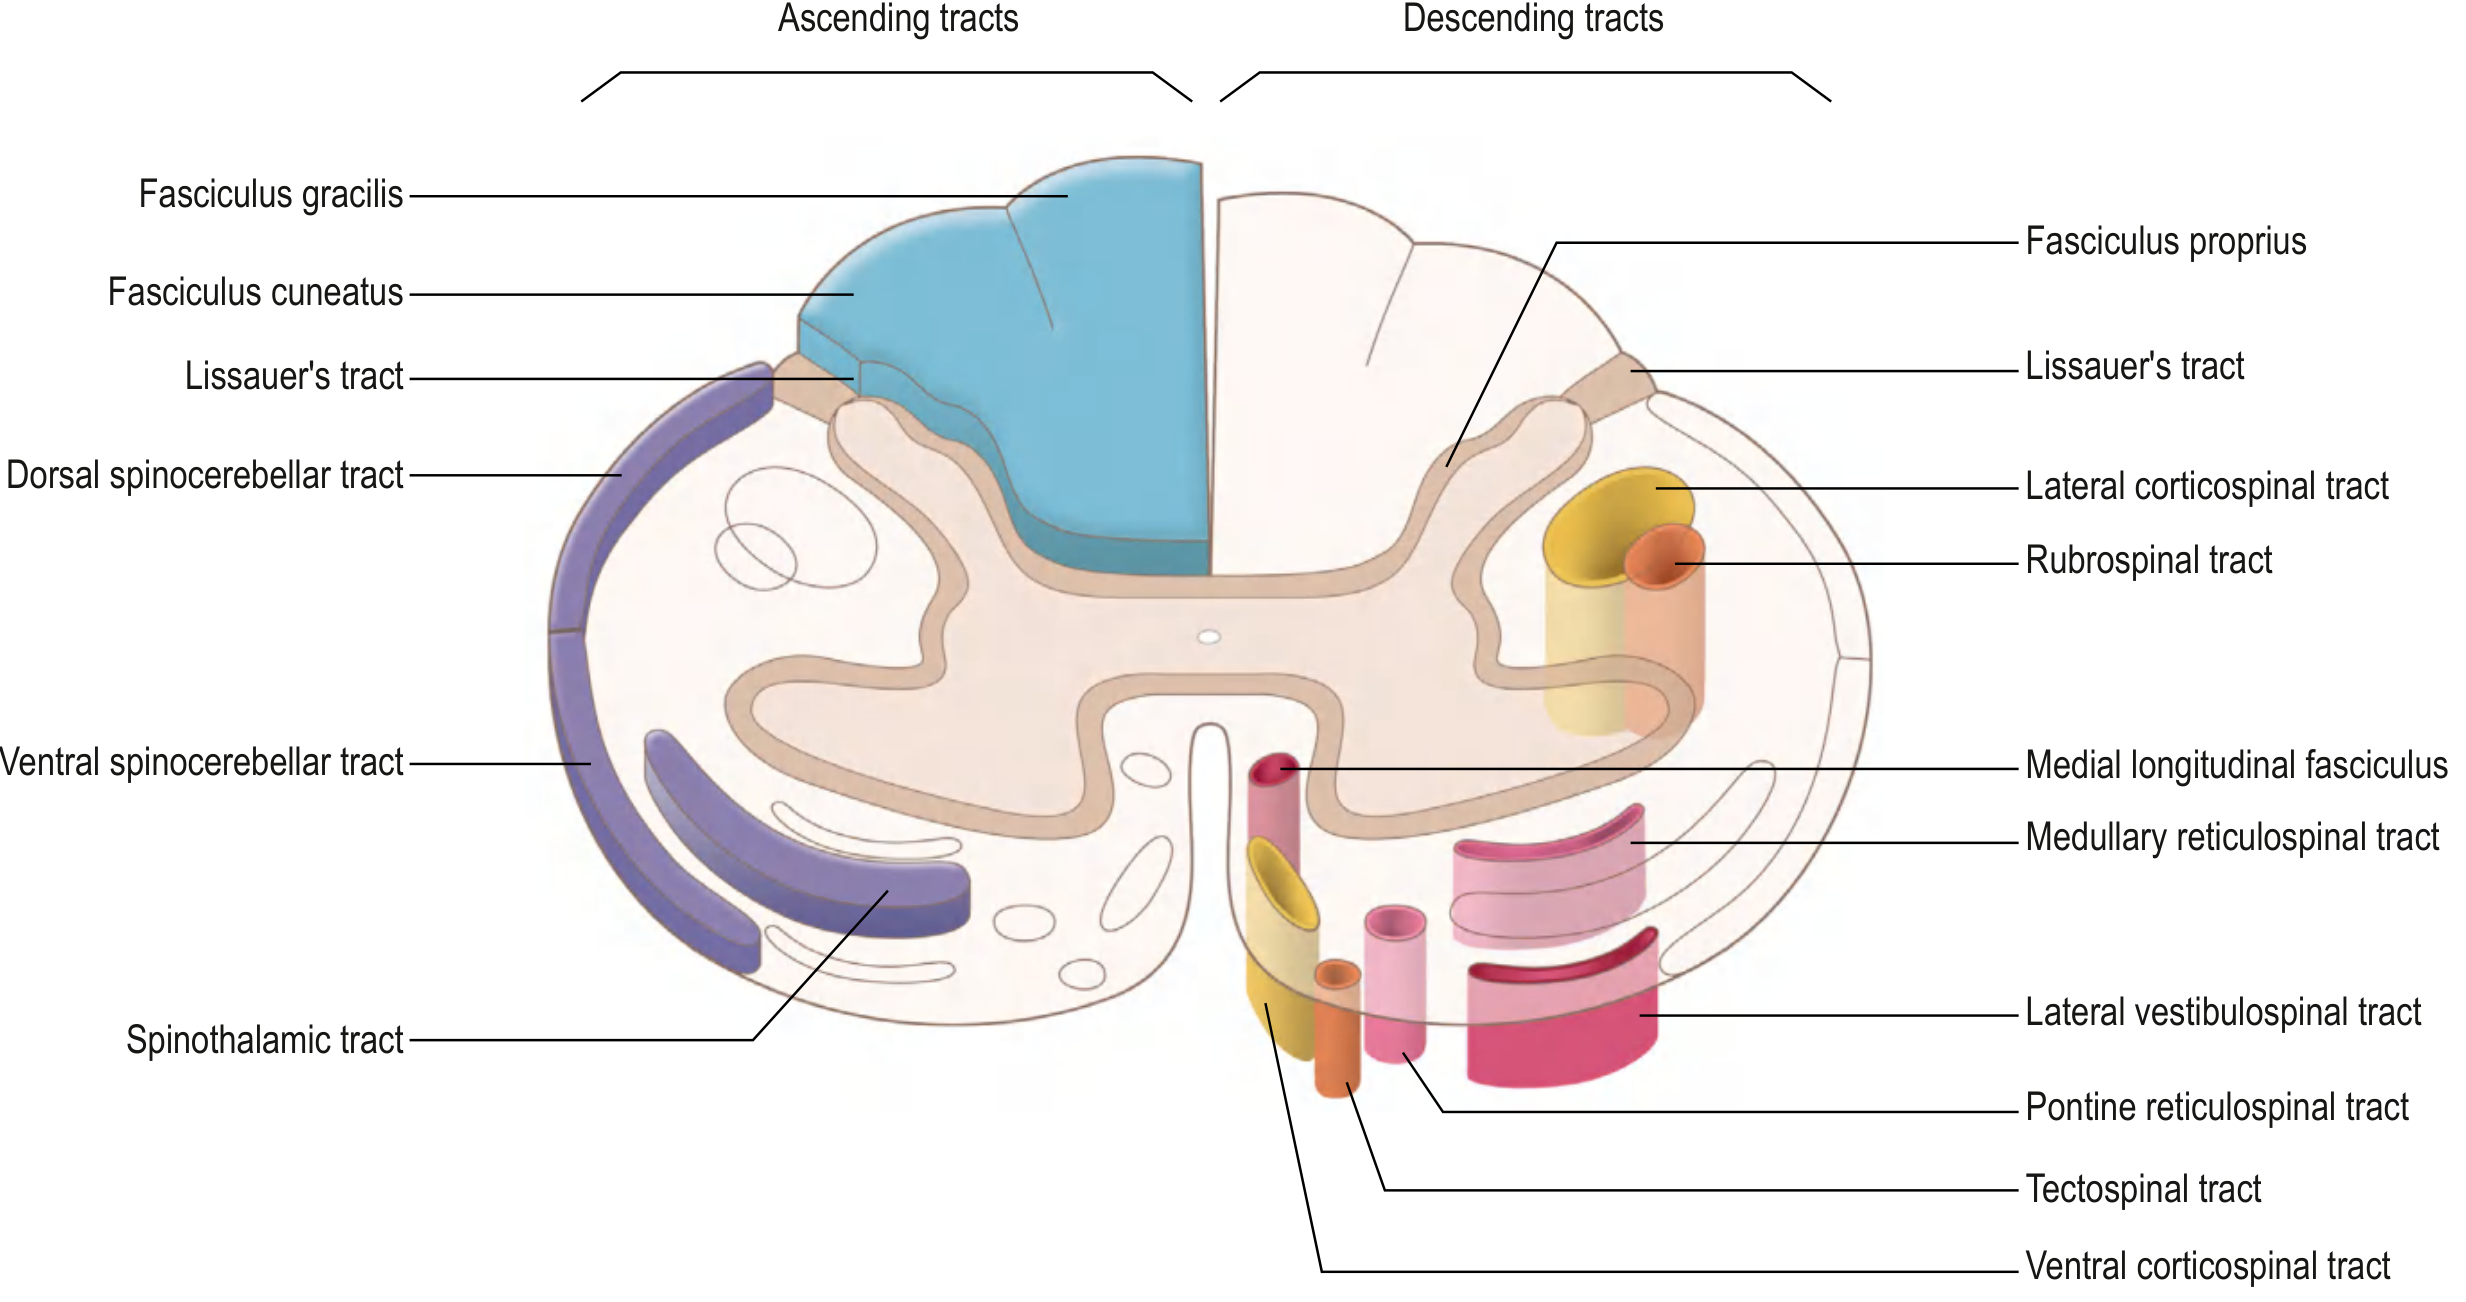
- 🟡 Lateral Corticospinal Tract - lateral column mein (yellow/orange)
- 🟡 Rubrospinal Tract - lateral column mein (uske saath)
- 🟤 Ventral/Anterior Corticospinal - anterior column mein
- 🩷 Reticulospinal tracts - anterior column mein
- 🩷 Vestibulospinal tract - anterior column mein
🟢 PART 2: EXTRAPYRAMIDAL TRACT
Kya Hota Hai Extrapyramidal System?
- Posture maintain karna
- Balance rakhna
- Automatic movements (jaise chalna, haath hilana speech ke saath)
- Muscle tone regulate karna
Extrapyramidal Tracts Kaun Kaun Se Hain?
| Tract | Origin | Kaam |
|---|---|---|
| Rubrospinal | Red nucleus (midbrain) | Flexor muscles control (upper limb) |
| Reticulospinal (Pontine + Medullary) | Reticular formation (brainstem) | Muscle tone, posture |
| Vestibulospinal | Vestibular nucleus | Balance, head/neck position |
| Tectospinal | Superior colliculus (midbrain) | Head aur eye ka ek saath movement (visual reflexes) |
🔄 PYRAMIDAL vs EXTRAPYRAMIDAL - Fark Yaad Karo
| Cheez | Pyramidal | Extrapyramidal |
|---|---|---|
| Movement type | Voluntary (iradatan) | Involuntary, automatic |
| Speed | Fast, precise | Slow, regulatory |
| Injury se kya hoga | Spasticity + Babinski sign + Weakness | Rigidity, tremor, dystonia, ataxia |
| Example disease | Stroke, MND (Upper Motor Neuron lesion) | Parkinson's, Huntington's |
| Kahan jaata hai | Direct cortex → spinal cord | Cortex → Basal ganglia → Brainstem → Spinal cord |
🩺 Clinical Points (Exam ke liye!)
Pyramidal Tract Injury (Upper Motor Neuron Lesion):
- Weakness/Paralysis
- Spasticity (muscle stiff ho jaati hai)
- Babinski sign POSITIVE (toe upar ki taraf jaata hai)
- Hyperreflexia (reflexes zyada ho jaate hain)
- No muscle wasting (muscles nahi ghisti)
Extrapyramidal Injury:
- Parkinson's disease - basal ganglia mein dopamine kam → rigidity + tremor + bradykinesia
- Huntington's - chorea (uncontrolled jerky movements)
- Dystonia, athetosis - abnormal postures
Summary Diagram (Simple):
BRAIN (Motor Cortex)
    |
    |--- PYRAMIDAL TRACT --→ Direct raasta --→ Voluntary muscle control
    |         |
    |    (Decussates in Medulla)
    |
    |--- EXTRAPYRAMIDAL SYSTEM
              |
         Basal Ganglia + Cerebellum + Brainstem
              |
         Automatic / Postural / Tone control
              |
         Muscles (via Rubrospinal, Reticulospinal, Vestibulospinal, Tectospinal tracts)