
Amylotrophic lateral sclerosis
"amyotrophic lateral sclerosis"[MeSH Terms] AND treatment
amyotrophic lateral sclerosis motor neuron pathology diagram
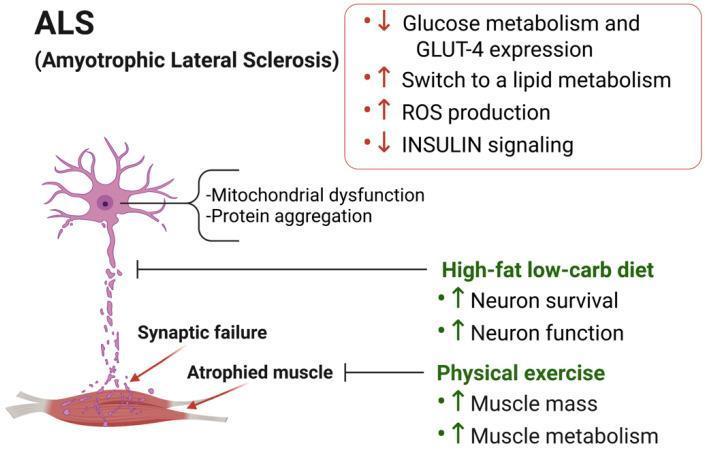
A medical illustration depicting the pathophysiology and proposed therapeutic interventions for Amyotrophic Lateral Sclerosis (ALS). The left side of the diagram shows a degenerating motor neuron and a skeletal muscle unit. Cellular pathology in the neuron is characterized by mitochondrial dysfunction and protein aggregation. The neuromuscular junction is marked by 'Synaptic failure,' leading to 'Atrophied muscle.' A red box highlights metabolic reprogramming in the muscle, showing decreased glucose metabolism, GLUT-4 expression, and insulin signaling, alongside increased lipid metabolism and reactive oxygen species (ROS) production. The right side presents two counteracting therapeutic strategies: a 'High-fat low-carb diet,' which aims to increase neuron survival and function, and 'Physical exercise,' which aims to increase muscle mass and metabolism. The diagram uses specialized arrows to indicate the direction of metabolic changes (red) and the intended positive effects of interventions (green). This educational infographic is designed to illustrate the neuro-muscular metabolic axis in neurodegenerative disease.
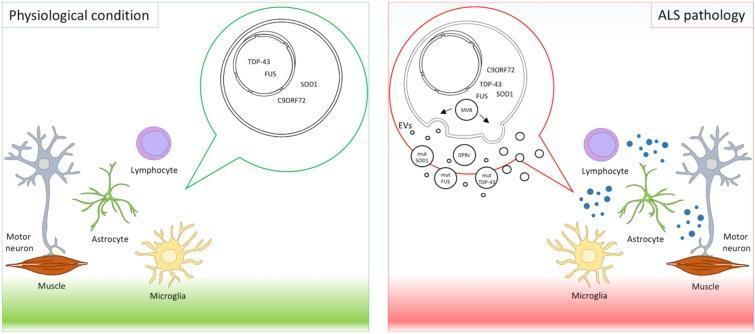
This pathophysiology diagram provides a comparative analysis of intercellular signaling in physiological conditions versus Amyotrophic Lateral Sclerosis (ALS) pathology. The illustration depicts a motor unit consisting of a motor neuron innervating muscle tissue, alongside supporting glial cells (astrocytes, microglia) and lymphocytes. The 'Physiological condition' panel shows a quiescent state where multivesicular bodies (MVBs) contain wild-type proteins including TDP-43, FUS, SOD1, and C9ORF72. In contrast, the 'ALS pathology' panel illustrates the active secretion of extracellular vesicles (EVs) containing pathogenic components. These include mutated proteins (mut SOD1, mut TDP-43, mut FUS) and dipeptide repeat proteins (DPRs) derived from C9ORF72 expansions. The diagram highlights the neuroinflammatory environment in ALS, characterized by the interaction of these EVs with neighboring astrocytes, microglia, and lymphocytes, represented by blue signaling dots. This visual summary explains the 'prion-like' spread of ALS through EV-mediated transport of misfolded or mutated proteins between components of the neuromuscular system and the immune microenvironment, contributing to disease progression and neurodegeneration.
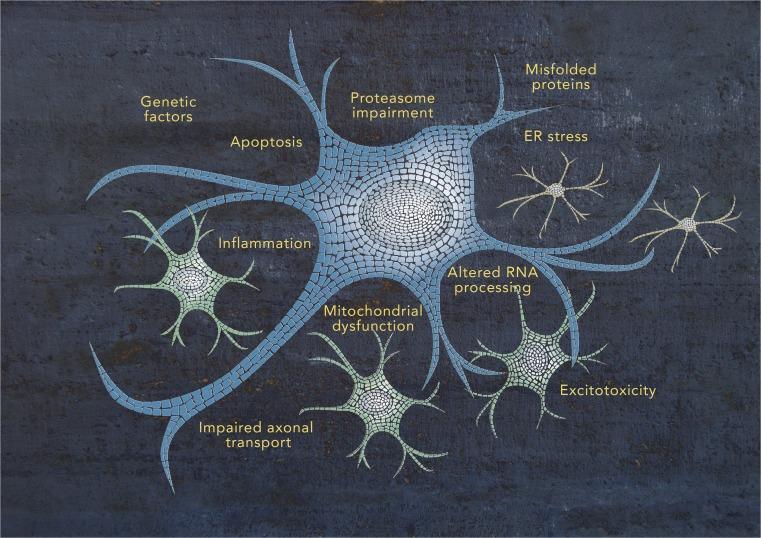
This pathophysiology diagram provides a schematic representation of the multifactorial pathogenesis of Amyotrophic Lateral Sclerosis (ALS). The central element is a large, stylized motor neuron composed of a blue and grey mosaic pattern, representing the 'intricate mosaic' of the disease state. Surrounding the central neuron are several smaller cellular structures and textual labels that identify key biological processes implicated in neurodegeneration. Labeled pathogenic mechanisms include 'Genetic factors', 'Apoptosis', 'Inflammation', 'Mitochondrial dysfunction', 'Excitotoxicity', 'Impaired axonal transport', 'Altered RNA processing', 'ER stress', 'Misfolded proteins', and 'Proteasome impairment'. The visual organization uses radiating extensions from the central neuron to link these various systemic and cellular dysfunctions, illustrating how multiple independent and overlapping pathways contribute to the selective degeneration of motor neurons. Smaller green and tan cell-like icons are positioned near specific labels like 'Inflammation' and 'Mitochondrial dysfunction' to suggest the involvement of non-neuronal glial cells or specific organelle-level failure in the disease process.
Amyotrophic Lateral Sclerosis (ALS)
Overview
Epidemiology
| Parameter | Data |
|---|---|
| Incidence | ~2 per 100,000 |
| Prevalence | 6-8 per 100,000 |
| Mean age of onset | 55-60 years |
| Male:Female ratio | ~1.6:1 (spinal onset); slight female predominance in bulbar onset |
| Sporadic cases | ~90% |
| Familial cases | ~5-10% (usually autosomal dominant) |
Genetics and Pathobiology
- C9ORF72 (chromosome 9) - GGGGCC hexanucleotide repeat expansion: the most common genetic cause, accounting for 40-50% of familial ALS and 7-10% of sporadic ALS. It causes defective RNA processing, RNA foci sequestering RNA-binding proteins, and altered nucleocytoplasmic transport producing toxic dipeptide repeat proteins.
- SOD1 (chromosome 21q): mutations account for ~20% of familial ALS (2% of all ALS). Mutant SOD1 generates misfolded protein aggregates that propagate in a prion-like fashion and trigger oxidative stress, mitochondrial dysfunction, excitotoxicity, and impaired axonal transport.
- TDP-43 (TARDBP) and FUS: RNA-binding proteins whose mutations cause ALS; TDP-43 inclusions are found in most sporadic ALS cases. The overlap between ALS and frontotemporal lobar degeneration (FTLD) is partly explained by shared TDP-43 and C9ORF72 pathology.
- Ataxin-2: intermediate-length polyQ expansions (27-33Q) are a risk factor in ~5% of patients.
Pathology
- Atrophy of the precentral gyrus (motor cortex)
- Sclerosis and pallor of the corticospinal tracts
- Thinning of hypoglossal nerves and ventral spinal roots
- Obvious muscle atrophy
- Loss of at least 50% of spinal motor neurons at autopsy
- Diffuse astrocytic gliosis in spinal gray matter
- Loss of anterior horn cell neurons with reactive gliosis and loss of anterior root myelinated fibers
- TDP-43 cytoplasmic inclusions in a subset of cases
- Neurogenic atrophy in skeletal muscle
Clinical Features
Onset and Progression
UMN Signs (corticospinal tract degeneration)
- Spasticity and hyperreflexia
- Babinski sign
- Clonus
- Absent abdominal reflexes
- Loss of dexterity
LMN Signs (anterior horn cell / cranial motor nuclei degeneration)
- Muscle atrophy
- Weakness
- Fasciculations
- Hyporeflexia (when LMN predominates)
Clinical Presentations (Practical Classification)
| Type | Features |
|---|---|
| Classic (spinal onset) | Asymmetric limb weakness, combined UMN+LMN |
| Bulbar onset (~25%) | Dysarthria, dysphagia - 5x greater risk of swallowing problems |
| Progressive muscular atrophy (PMA) | Pure LMN variant |
| Primary lateral sclerosis (PLS) | Pure UMN variant |
| Progressive bulbar palsy (PBP) | Bulbar LMN predominance |
| Flail arm / flail leg variants | Regional onset patterns |
Bulbar Involvement
Respiratory Failure
Cognitive Involvement
Diagnosis
Awaji Criteria (diagnostic classification)
| Category | Criteria |
|---|---|
| Definite ALS | UMN + LMN signs in 3 regions |
| Probable ALS | UMN + LMN signs in 2 regions, with UMN signs rostral to LMN signs |
| Possible ALS | UMN + LMN signs in 1 region; or UMN signs alone in ≥2 regions; or LMN signs rostral to UMN signs |
Investigations
- Active denervation: positive sharp waves, fibrillation potentials, fasciculation potentials
- Chronic denervation: large motor unit potentials
- Findings cannot be explained by a single nerve/root/plexus lesion
- Cortical hyperexcitability is an early feature (reduced motor threshold, increased MEP amplitude)
- Reduced short-interval cortical inhibition (SICI) - may precede clinical onset in familial ALS
- SICI reduction is restored by riluzole, supporting glutamatergic excitotoxicity
Important Mimics (~8% initially diagnosed with ALS have an alternative diagnosis)
- Multifocal motor neuropathy with conduction block
- Kennedy disease (SBMA)
- Cervical spondylotic myelopathy + radiculopathy (10-15% of ALS patients undergo inappropriate spinal surgery first)
- Inclusion body myositis
- Thyrotoxicosis
- Paraneoplastic syndromes (especially lymphoma)
- Hereditary spastic paraplegia (mimics PLS)
Treatment
Disease-Modifying Drugs
| Drug | Mechanism | Effect |
|---|---|---|
| Riluzole | Glutamate antagonist (anti-excitotoxic) | Extends survival by ~2-3 months; standard of care |
| Edaravone | Free radical scavenger | Slows functional decline in a subset of patients |
| Tofersen | Antisense oligonucleotide (targets SOD1 mRNA) | Approved for SOD1-ALS; 2025 systematic review confirms reduction in neurofilament light chain and functional benefit |
Symptomatic Management
- Dysphagia: Dietary modification (thickened liquids), gastrostomy (PEG) tube when oral intake is compromised
- Sialorrhea: Glycopyrrolate, beta-blockers; radiation to salivary glands in refractory cases
- Respiratory failure: Non-invasive positive pressure ventilation (NIPPV/BiPAP); tracheostomy with invasive ventilation in selected patients
- Spasticity: Baclofen, tizanidine
- Cramps/fasciculations: Mexiletine, quinine (controversial)
- Depression/emotional lability: SSRIs, tricyclics; pseudobulbar affect responds to dextromethorphan/quinidine
- Communication: Augmentative and alternative communication (AAC) devices
Physical Therapy
Prognosis
- Median survival: 2-5 years from symptom onset
- ~10% survive >10 years
- Poor prognostic indicators: bulbar onset, older age, rapid progression, early respiratory involvement
- ALS-FTD (frontotemporal dementia overlap) carries a worse prognosis
Key Summary Points
- ALS = combined UMN + LMN degeneration; purely motor (sensation typically spared)
- Most common genetic cause: C9ORF72 repeat expansion; classic familial mutation: SOD1
- Core pathogenic mechanism: excitotoxicity + RNA processing dysfunction + protein aggregation
- EMG is the essential electrophysiologic investigation
- Riluzole remains the cornerstone of pharmacologic treatment
- Tofersen is a precision medicine advance for SOD1-ALS
- Multidisciplinary care is critical; respiratory failure is the usual cause of death