
ABG complete learning
arterial blood gas ABG interpretation diagram acid base
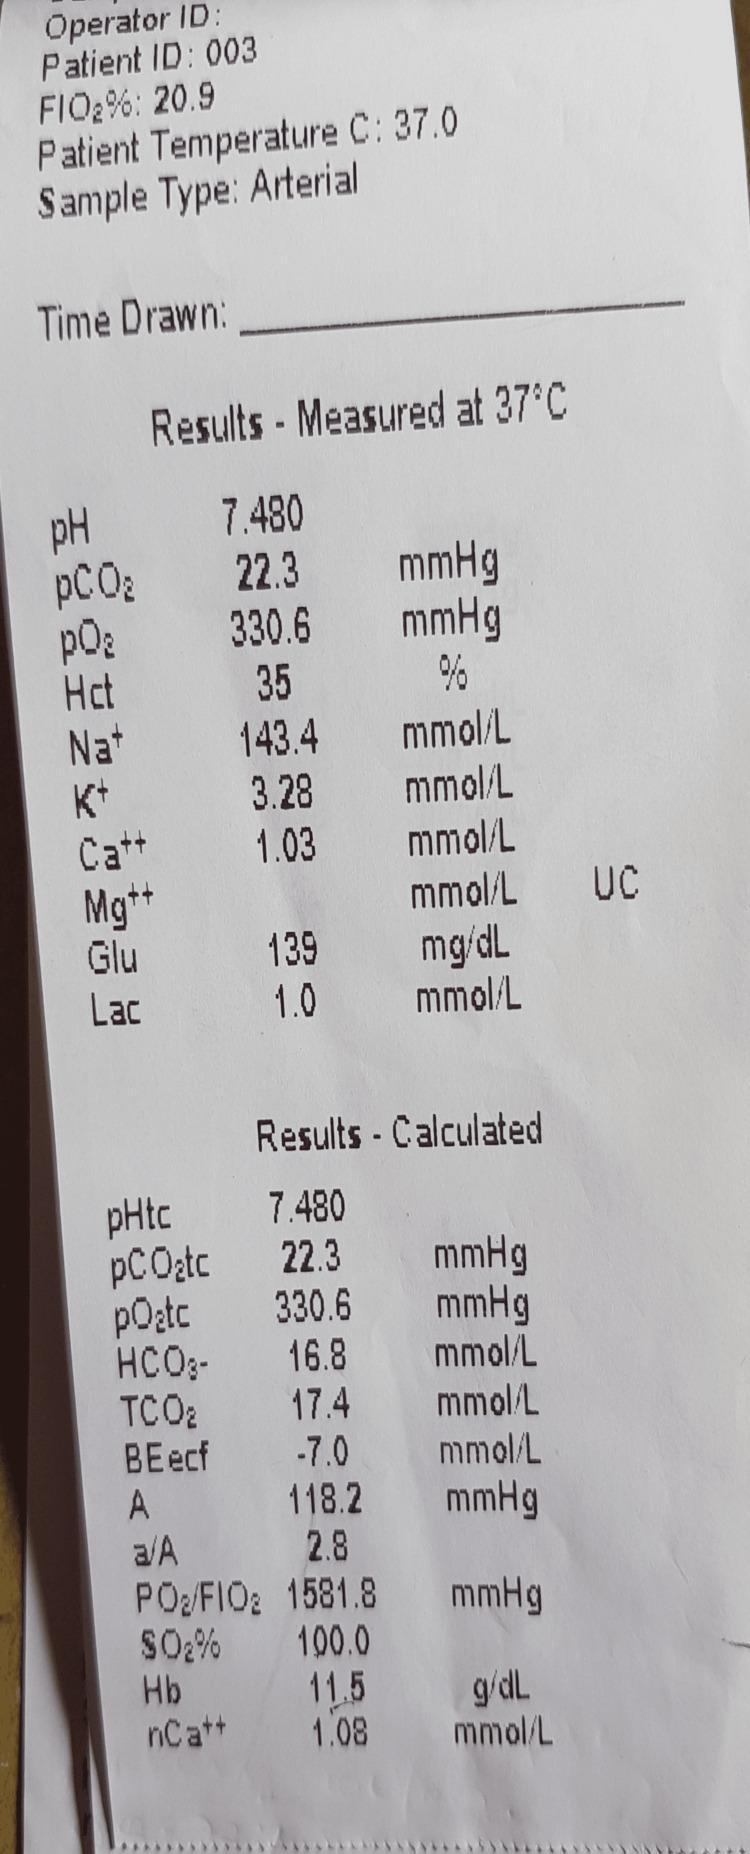
A clinical photograph of a printed arterial blood gas (ABG) analysis report. The document displays measured and calculated physiological values at a patient temperature of 37.0°C. Key measured values include a pH of 7.480, pCO2 of 22.3 mmHg, pO2 of 330.6 mmHg, and electrolyte levels (Na+ 143.4 mmol/L, K+ 3.28 mmol/L, Ca++ 1.03 mmol/L). Calculated values show a bicarbonate (HCO3-) level of 16.8 mmol/L and an oxygen saturation (SO2%) of 100.0%. This visual demonstrates a 'saturation gap' characteristic of certain toxicological conditions, such as methemoglobinemia, where the calculated oxygen saturation from the ABG appears normal (100%) despite the patient potentially experiencing clinical cyanosis and low peripheral pulse oximetry readings. The image is an educational tool for critical care, emergency medicine, and clinical toxicology, illustrating the interpretation of acid-base balance and oxygenation status.
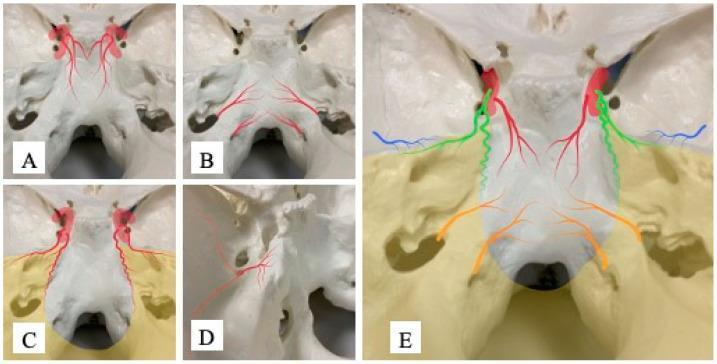
This medical anatomical diagram illustrates the arterial blood supply and vascular distribution patterns across the internal skull base, specifically focusing on feeders involved in skull base meningiomas. The composite image consists of five sub-figures (A-E) superimposed on a superior view of a human skull model. Sub-figure A depicts the Dorsal Meningeal Artery (DMA) in red, originating from the meningohypophyseal trunk and descending along the upper clivus. Sub-figure B shows the Ascending Pharyngeal Artery (APA) in orange, distributing around the foramen magnum and lower clivus. Sub-figure C highlights the Tentorial Artery (TA) in green, following the course of the tentorium cerebelli. Sub-figure D illustrates the Petrosal Branch (PB) in blue, arising from the middle meningeal artery near the foramen spinosum and reaching the petrous apex. Sub-figure E provides a summarized color-coded overlay demonstrating the spatial relationships of these four vascular territories relative to the clivus, petrous bone, and foramen magnum. This visual guide assists in identifying potential feeding arteries based on the tumor's dural attachment site during preoperative planning for meningioma resection.
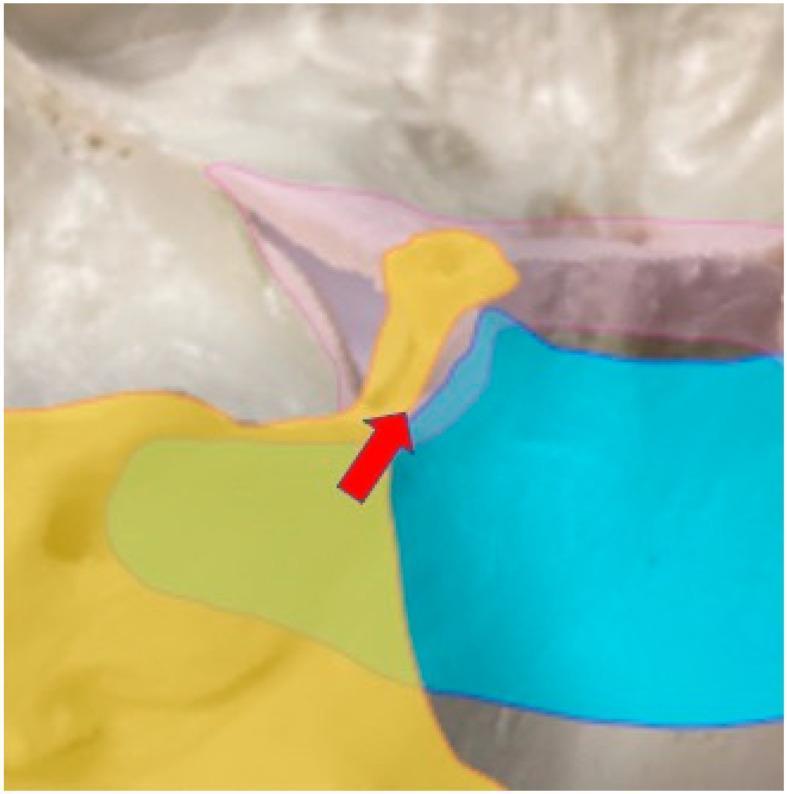
Anatomical Diagram and intraoperative overlay illustrating the arterial blood supply to the cavernous sinus, specifically regarding the feeding vessels of skull base meningiomas. The cavernous sinus is highlighted by a pink outline. The arterial distribution is color-coded: the Tentorial Artery (TA) is represented in yellow, demonstrating its supply to the superolateral aspect of the posterior cavernous sinus. The Dural Meningeal Artery (DMA) is shown in blue, highlighting its coverage of the inferomedial portion of the posterior cavernous sinus. A red arrow identifies the interface where cranial nerves are typically situated between these two arterial territories. The image serves as a clinical reference for neurosurgical planning, helping to differentiate between petrotentorial and petroclival meningioma attachments based on their primary feeding arteries and their spatial relationship to critical neurovascular structures within the skull base.
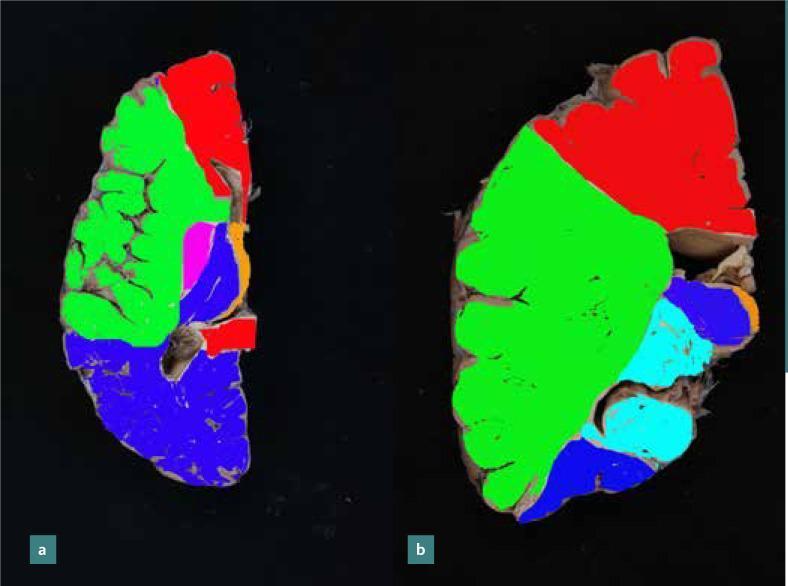
This medical anatomical diagram illustrates the arterial blood supply territories of the human brain through color-coded mapping on axial and coronal sections. Image 'a' displays an axial section at the level of the genu of the corpus callosum, while image 'b' shows a coronal section at the level of the head of the caudate nucleus. The primary vascular territories are identified as follows: red represents the Anterior Cerebral Artery (ACA), supplying the superior and medial aspects; green denotes the Middle Cerebral Artery (MCA), covering the extensive lateral and central regions; and blue indicates the Posterior Cerebral Artery (PCA) territory at the base and posterior aspects. Additionally, smaller vascular zones are identified, including the anterior choroidal artery (purple in 'a', light blue in 'b') and the posterior communicating artery (orange). Blue arrows highlight the border zones or watershed regions between major territories, which are clinically significant as areas highly susceptible to ischemia during hypoperfusion. This visual resource is designed for medical students and clinicians to understand neurovascular anatomy and the pathophysiology of watershed strokes.
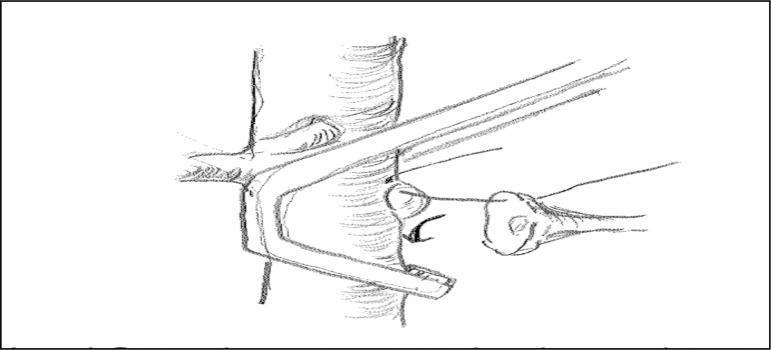
A surgical illustration depicting orthotopic renal transplantation, specifically focusing on the arterial clamping technique. The diagram shows the abdominal aorta as a central, vertical cylindrical vessel. A Satinsky surgical clamp is applied to the aorta, positioned precisely at the base of the left renal artery. This selective clamping method is designed to occlude blood flow for the creation of an anastomotic opening (approximately 8 mm from the artery base) while purposefully sparing the mesenteric arteries and the right renal artery, which are visible branching superiorly to the clamped segment. The illustration highlights the relationship between the surgical instrumentation and vascular anatomy to maintain systemic circulation and prevent lower limb or contralateral renal ischemia during the procedure. Key features include the orientation of the clamp jaws relative to the aortic wall and the positioning of the arterial suture lines for donor kidney attachment.
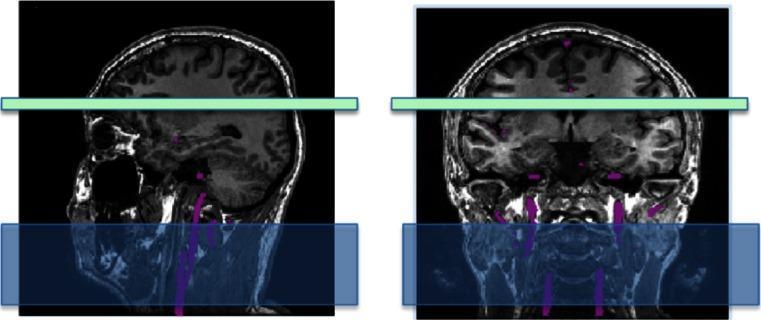
Diagnostic neuroimaging diagram illustrating the setup for Pulsed Arterial Spin Labeling (PASL). The image contains two panels: a sagittal view (left) and a coronal view (right) of the human head and neck, presented as T1-weighted MRI scans. Superimposed on these scans is a large blue rectangular block representing the labeling slice prescription (inversion slab), positioned over the neck region to capture inflowing blood. Within this blue slab, the major feeding arteries (carotid and vertebral arteries) are highlighted in purple, demonstrating the volume where water molecules in the blood are magnetically labeled. A light green horizontal bar is positioned higher across the cerebral cortex, indicating the imaging plane or region where tissue perfusion signal will be measured after a post-labeling delay. Key anatomical landmarks visible include the cervical spine, brainstem, cerebellum, and the base of the skull, showing the spatial relationship between the labeling site in the neck and the target imaging site in the brain. This visual serves as an educational guide for technical MRI protocol positioning in perfusion imaging.
acid base disorders compensation metabolic respiratory table
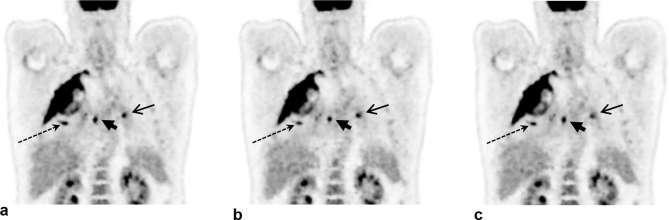
This Comparison Chart displays three coronal PET scan images (a, b, and c) of the human torso, demonstrating the impact of respiratory gating on diagnostic image quality. The modality highlights metabolic activity using a grey scale representing Standardized Uptake Value (SUV) from 0 to 6. Anatomical landmarks include the liver (showing high radiotracer uptake), kidneys, spine, and pulmonary regions. Image (a) shows the scan without motion compensation, where thoracic lesions indicated by arrows appear blurred and elongated along the cranio-caudal axis due to respiratory motion. Image (b) utilizes data-driven quiescent period gating (DDG), and image (c) utilizes externally driven (RPM) quiescent period gating. In both (b) and (c), the motion-compensated images show significantly improved lesion clarity, better definition of lesion morphology, and higher overall image contrast compared to the non-gated image (a). This clinical example illustrates how respiratory gating techniques minimize motion artifacts, particularly for small pulmonary and hilar lesions, enhancing diagnostic accuracy and quantitative SUV measurements in oncology imaging.
![Recommendation Table 52. Recommendations for acid-base homeostasis and electrolytes
<table><thead><tr><th>Recommendations</th><th>Class<sup>a</sup></th><th>Level<sup>b</sup></th><th>Ref<sup>c</sup></th></tr></thead><tbody><tr><td>Alpha-stat acid-base management should be considered in adult cardiac surgery patients with high-moderate hypothermia due to improved neurological and neurocognitive outcomes.</td><td>IIa</td><td>B</td><td>[786, 787]</td></tr><tr><td>Magnesium sulphate may be considered perioperatively for prophylaxis of postoperative arrhythmias and improved cardiac protection/tissue oxygenation.</td><td>IIb</td><td>B</td><td>[790, 792, 793]</td></tr></tbody></table>](https://cdn.orris.care/cdss_images/GLGCA_4542999_1766781092994_908b31cf-2039-4b90-8baf-93bf970c2af4_3bb9602f-af04-476a-8e52-d58189108962.png)
Recommendation Table 52. Recommendations for acid-base homeostasis and electrolytes <table><thead><tr><th>Recommendations</th><th>Class<sup>a</sup></th><th>Level<sup>b</sup></th><th>Ref<sup>c</sup></th></tr></thead><tbody><tr><td>Alpha-stat acid-base management should be considered in adult cardiac surgery patients with high-moderate hypothermia due to improved neurological and neurocognitive outcomes.</td><td>IIa</td><td>B</td><td>[786, 787]</td></tr><tr><td>Magnesium sulphate may be considered perioperatively for prophylaxis of postoperative arrhythmias and improved cardiac protection/tissue oxygenation.</td><td>IIb</td><td>B</td><td>[790, 792, 793]</td></tr></tbody></table>
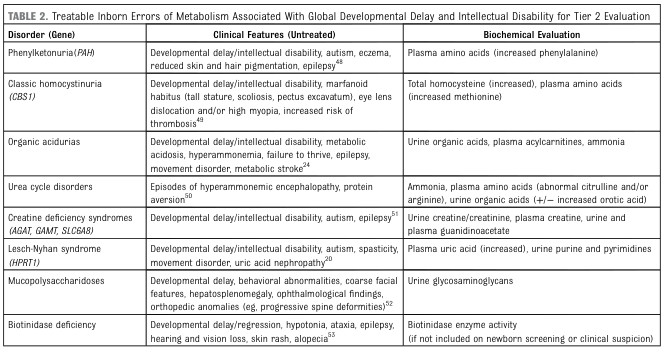
TABLE 2. Treatable Inborn Errors of Metabolism Associated With Global Developmental Delay and Intellectual Disability for Tier 2 Evaluation <table><thead><tr><th>Disorder (Gene)</th><th>Clinical Features (Untreated)</th><th>Biochemical Evaluation</th></tr></thead><tbody><tr><td>Phenylketonuria(PAH)</td><td>Developmental delay/intellectual disability, autism, eczema, reduced skin and hair pigmentation, epilepsy<sup>48</sup></td><td>Plasma amino acids (increased phenylalanine)</td></tr><tr><td>Classic homocystinuria (CBS1)</td><td>Developmental delay/intellectual disability, marfanoid habitus (tall stature, scoliosis, pectus excavatum), eye lens dislocation and/or high myopia, increased risk of thrombosis<sup>49</sup></td><td>Total homocysteine (increased), plasma amino acids (increased methionine)</td></tr><tr><td>Organic acidurias</td><td>Developmental delay/intellectual disability, metabolic acidosis, hyperammonemia, failure to thrive, epilepsy, movement disorder, metabolic stroke<sup>24</sup></td><td>Urine organic acids, plasma acylcarnitines, ammonia</td></tr><tr><td>Urea cycle disorders</td><td>Episodes of hyperammonemic encephalopathy, protein aversion<sup>50</sup></td><td>Ammonia, plasma amino acids (abnormal citrulline and/or arginine), urine organic acids (+/− increased orotic acid)</td></tr><tr><td>Creatine deficiency syndromes (AGAT, GAMT, SLC6A8)</td><td>Developmental delay/intellectual disability, autism, epilepsy<sup>51</sup></td><td>Urine creatine/creatinine, plasma creatine, urine and plasma guanidinoacetate</td></tr><tr><td>Lesch-Nyhan syndrome (HPRT1)</td><td>Developmental delay/intellectual disability, autism, spasticity, movement disorder, uric acid nephropathy<sup>20</sup></td><td>Plasma uric acid (increased), urine purine and pyrimidines</td></tr><tr><td>Mucopolysaccharidoses</td><td>Developmental delay, behavioral abnormalities, coarse facial features, hepatosplenomegaly, ophthalmological findings, orthopedic anomalies (eg, progressive spine deformities)<sup>52</sup></td><td>Urine glycosaminoglycans</td></tr><tr><td>Biotinidase deficiency</td><td>Developmental delay/regression, hypotonia, ataxia, epilepsy, hearing and vision loss, skin rash, alopecia<sup>53</sup></td><td>Biotinidase enzyme activity (if not included on newborn screening or clinical suspicion)</td></tr></tbody></table>
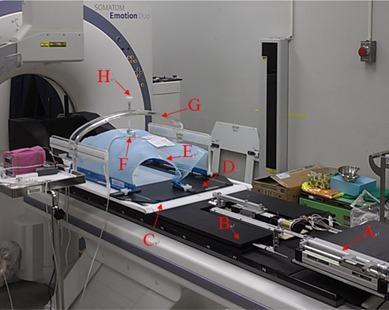
A clinical photograph illustrating a specialized human body experiment architecture for respiratory motion compensation during medical imaging or radiation therapy. The setup is mounted on a Somatom Emotion Duo CT scanner couch and includes several numbered components for immobilization and signal acquisition. A: Target simulator for reproducing respiratory displacement; B: Respiratory compensating system (RSS); C: Body fix base; D: Hip fix for lower body stabilization; E: Custom thermoplastic cast used for precise patient immobilization. For signal acquisition, a strain gauge (F) is placed over the abdominal region, held by an arch-type fixture (G) and connected via a compression rod (H). This arrangement translates the physical movement of the abdomen during respiration into voltage signals. The system is designed to synchronize couch movement with the patient's breathing cycle to offset respiratory motion, ensuring more accurate diagnostic imaging or targeted dose delivery in radiation oncology.
anion gap metabolic acidosis causes MUDPILES mnemonic
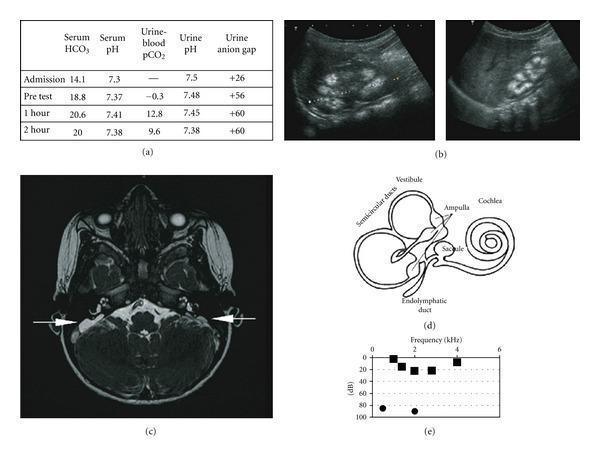
This composite educational image illustrates the clinical and diagnostic features of distal renal tubular acidosis (dRTA) associated with sensorineural hearing loss. (a) Data table showing results of a bicarbonate loading test, characterized by low urine-to-blood pCO2 gradient and positive urinary anion gap. (b) Renal ultrasound images of the left and right kidneys demonstrating medullary nephrocalcinosis, visualized as multiple hyperechoic foci within the renal pyramids. (c) Axial FIESTA (Fast Imaging Employing Steady-state Acquisition) cerebral MRI scan showing bilateral enlargement of the endolymphatic sacs (indicated by white arrows), a common finding in Pendred syndrome or dRTA with hearing loss. (d) Anatomical schematic of the inner ear, labeling the cochlea, vestibule, semicircular ducts, and endolymphatic duct. (e) Audiogram plot showing frequency (kHz) versus decibels (dB), depicting significant hearing impairment. The collection integrates metabolic laboratory data, diagnostic radiology (ultrasound and MRI), and functional audiological testing to present a comprehensive case of a hereditary renal-otological syndrome.
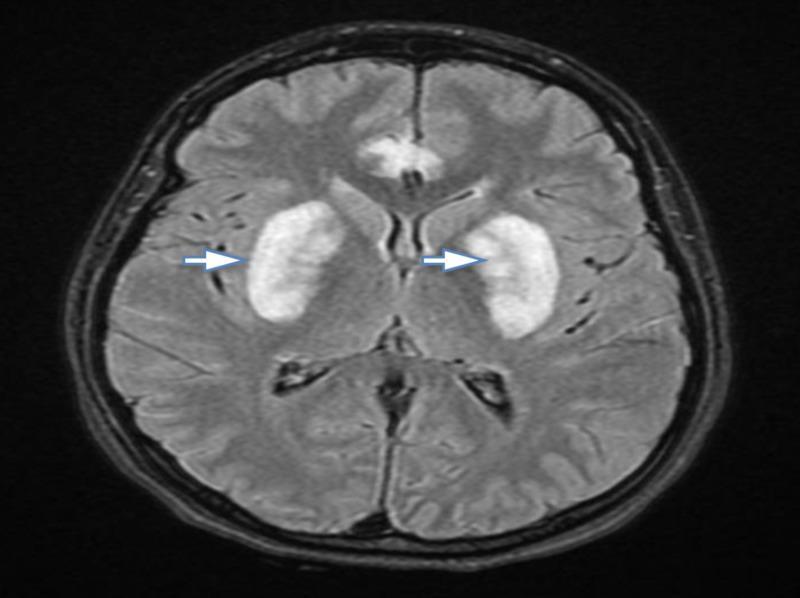
This diagnostic image is an axial Fluid-Attenuated Inversion Recovery (FLAIR) magnetic resonance imaging (MRI) scan of the brain. The image demonstrates prominent, symmetrical hyperintensities localized within the bilateral basal ganglia, specifically involving the putamina (indicated by white arrows). Additionally, a smaller, heterogeneous area of increased signal intensity is visible in the anterior midline of the cerebral parenchyma. These visual findings are characteristic of bilateral putaminal necrosis, often associated with acute toxic metabolic encephalopathy, such as methanol poisoning. The image highlights key radiological features used in neuroradiology for identifying toxic insults to the deep gray matter structures. It serves as an educational example for medical students and clinicians in identifying specific imaging patterns related to systemic toxicity and high-anion gap metabolic acidosis.
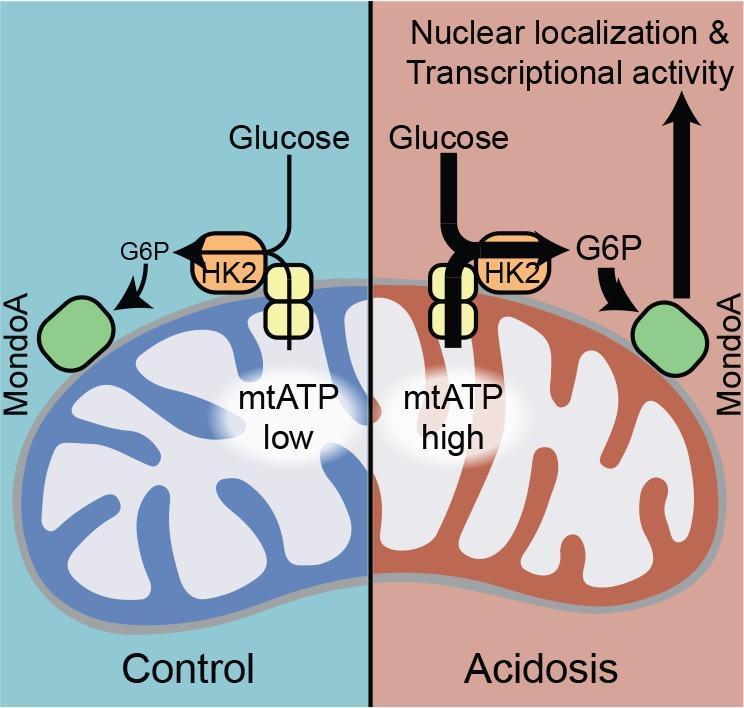
This pathophysiology diagram illustrates the cellular mechanism by which acidosis regulates MondoA transcriptional activity. The schematic is divided into two comparative states: 'Control' (blue background) and 'Acidosis' (red background). Key components include a mitochondrion, Hexokinase 2 (HK2), the MondoA protein, and metabolic intermediates glucose and glucose-6-phosphate (G6P). Under control conditions, mitochondrial ATP (mtATP) levels are low, and HK2 is bound to the outer mitochondrial membrane. Glucose is converted to G6P by HK2, resulting in basal MondoA interaction. In the 'Acidosis' state, a shift in pH drives a significant increase in mtATP production. This high mtATP concentration facilitates enhanced HK2 enzymatic activity at the mitochondrial surface, leading to increased production of G6P. The elevated G6P levels trigger MondoA to undergo nuclear localization and increased transcriptional activity, as indicated by a large upward arrow toward the nucleus. This diagram demonstrates how metabolic sensing of mitochondrial energy charge and cytoplasmic glucose levels are integrated via HK2 to control gene expression under conditions of metabolic stress or altered pH.
oxygenation hypoxemia PaO2 alveolar arterial gradient
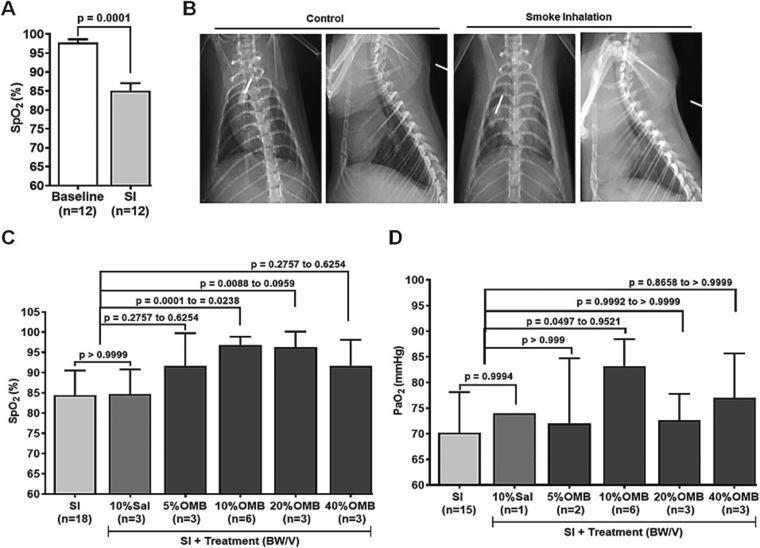
This composite educational image illustrates the physiological and radiological impacts of smoke inhalation (SI) and the therapeutic effects of oxygen microbubbles (OMB). Panel A shows a bar graph demonstrating a significant decrease in peripheral oxygen saturation (SpO2) from a baseline of ~98% to ~85% following smoke inhalation. Panel B presents ventral-dorsal and lateral thoracic x-rays of an animal model. The 'Control' images show clear lung fields and distinct cardiac silhouettes. In contrast, the 'Smoke Inhalation' images demonstrate diffuse, bilateral pulmonary infiltrates and increased lung opacity, characteristic of acute lung injury. Anatomical landmarks including the spine, ribs, and sternum are visible across both views. Panels C and D provide statistical dose-response analyses for SpO2 and partial pressure of arterial oxygen (PaO2). These graphs show that intraperitoneal administration of OMB, particularly at a dose of 10% body weight/volume (BW/V), significantly improves oxygenation compared to saline controls, indicating the potential for OMB to mitigate SI-induced hypoxemia.
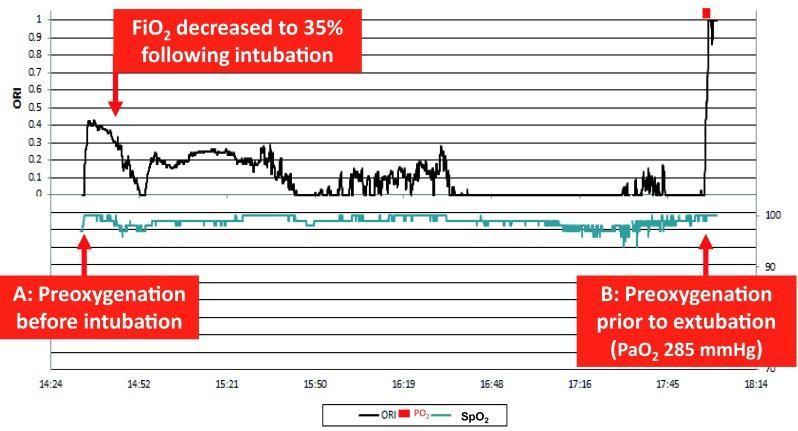
This clinical graphic illustrates the real-time monitoring of Oxygen Reserve Index (ORI) and arterial oxygen saturation (SpO2) in a patient during the perioperative period. The chart displays two primary monitoring windows: (A) pre-oxygenation before tracheal intubation and (B) pre-oxygenation prior to extubation. The ORI (black line), a unit-less index ranging from 0.00 to 1.00, reflects oxygenation status in the moderate hyperoxic range (PaO2 ~100–200 mmHg). During initial pre-oxygenation (A), the ORI sharply rises to approximately 0.4 while SpO2 remains stable near 100%. Following intubation, the FiO2 is reduced to 35%, causing a significant drop in ORI to values fluctuating between 0.0 and 0.2, effectively avoiding hyperoxia. In phase (B), pre-oxygenation before extubation triggers a sharp spike in ORI toward its maximum value, indicating a robust oxygen reserve. This tool provides non-invasive clinical insight into oxygenation levels when SpO2 is already maximized and non-informative, allowing for safer airway management and precise titration of supplemental oxygen.
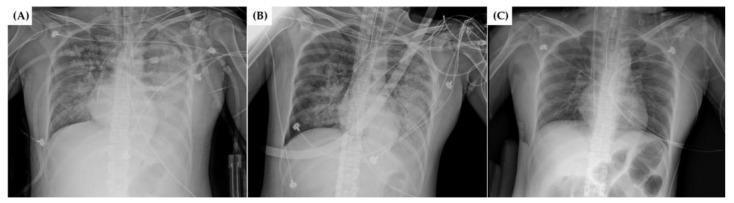
This Comparison Chart consists of a series of three anteroposterior (AP) chest radiographs (labeled A, B, and C) illustrating the radiological progression of a patient undergoing Extracorporeal Membrane Oxygenation (ECMO) for Acute Respiratory Distress Syndrome (ARDS). Radiograph (A), taken before ECMO initiation, shows severe, bilateral pulmonary congestion and diffuse, ill-defined opacities consistent with widespread alveolar edema or consolidation. Radiograph (B), taken during ECMO therapy, demonstrates a moderate reduction in pulmonary opacities and improved aeration of the lung fields. Radiograph (C), captured after ECMO weaning, reveals significant resolution of congestion with clearer lung parenchyma, indicating clinical improvement. Visible medical devices throughout the sequence include an endotracheal tube, multiple electrocardiogram (ECG) leads, and various vascular catheters (including potential ECMO cannulae and central venous lines). The series highlights the role of mechanical circulatory support in managing severe hypoxemia and pulmonary edema, providing a visual timeline of lung recruitment and recovery in a critical care setting.
🫁 Arterial Blood Gas (ABG) - Complete Learning Guide
1. WHAT IS AN ABG?
2. NORMAL ABG VALUES
| Parameter | Normal Range |
|---|---|
| pH | 7.35 - 7.45 |
| PaCO₂ | 35 - 45 mm Hg |
| PaO₂ | 80 - 100 mm Hg |
| HCO₃⁻ | 22 - 26 mEq/L |
| SaO₂ | 95 - 100% |
| Base Excess (BE) | -2 to +2 mEq/L |
3. THE HENDERSON-HASSELBALCH EQUATION (The Foundation)
pH = pKa + log [HCO₃⁻ / (α × PaCO₂)]
[H⁺] = 24 × PaCO₂ / HCO₃⁻
- H⁺ = 25 nmol/L → pH ≈ 7.60
- H⁺ = 40 nmol/L → pH ≈ 7.40
- H⁺ = 63 nmol/L → pH ≈ 7.20
CO₂ + H₂O ⇌ H₂CO₃ ⇌ HCO₃⁻ + H⁺
- ↑ PaCO₂ → reaction shifts right → ↑ H⁺ → ↓ pH = Respiratory Acidosis
- ↓ PaCO₂ → reaction shifts left → ↓ H⁺ → ↑ pH = Respiratory Alkalosis
- ↑ HCO₃⁻ → reaction shifts left → ↓ H⁺ → ↑ pH = Metabolic Alkalosis
- ↓ HCO₃⁻ → reaction shifts right → ↑ H⁺ → ↓ pH = Metabolic Acidosis
4. STEP-BY-STEP ABG INTERPRETATION
Step 1: Is the pH normal, acidotic, or alkalotic?
- pH < 7.35 = Acidosis
- pH 7.35-7.45 = Normal (but a mixed disorder may still exist!)
- pH > 7.45 = Alkalosis
Step 2: Identify the primary disorder (look at PaCO₂ and HCO₃⁻)
| pH | Primary Disorder | Clue |
|---|---|---|
| Low (< 7.35) | Metabolic acidosis | HCO₃⁻ < 24 mEq/L |
| Low (< 7.35) | Respiratory acidosis | PaCO₂ > 40 mm Hg |
| High (> 7.45) | Metabolic alkalosis | HCO₃⁻ > 24 mEq/L |
| High (> 7.45) | Respiratory alkalosis | PaCO₂ < 40 mm Hg |
Step 3: Is compensation appropriate? (Detect mixed disorders)
| Primary Disorder | Expected Compensation |
|---|---|
| Metabolic acidosis | ↓ PaCO₂ = 1.3 × ↓ HCO₃⁻ (Winter's formula) |
| Metabolic alkalosis | ↑ PaCO₂ = 0.6 × ↑ HCO₃⁻ |
| Respiratory acidosis (acute) | ↑ HCO₃⁻ by 1 mEq/L per 10 mm Hg ↑ PaCO₂ |
| Respiratory acidosis (chronic) | ↑ HCO₃⁻ by 4 mEq/L per 10 mm Hg ↑ PaCO₂ |
| Respiratory alkalosis (acute) | ↓ HCO₃⁻ by 2 mEq/L per 10 mm Hg ↓ PaCO₂ |
| Respiratory alkalosis (chronic) | ↓ HCO₃⁻ by 5 mEq/L per 10 mm Hg ↓ PaCO₂ |
Step 4: Calculate the Anion Gap (if metabolic acidosis present)
Anion Gap (AG) = Na⁺ - (Cl⁻ + HCO₃⁻)
Normal AG = 12 ± 4 mEq/L
Step 5: If AG is elevated, check the Delta-Delta ratio (Delta Gap)
Δ-Δ = (AG - 12) / (24 - HCO₃⁻)
| Δ-Δ Ratio | Interpretation |
|---|---|
| < 1 | Concurrent non-anion gap metabolic acidosis |
| 1 - 2 | Pure anion gap metabolic acidosis |
| > 2 | Concurrent metabolic alkalosis |
Step 6: Assess oxygenation
- PaO₂ < 80 mm Hg = Hypoxemia
- Calculate the A-a gradient to localize the cause:
Alveolar PO₂ (PAO₂) = (FiO₂ × [Patm - PH₂O]) - (PaCO₂ / RQ)
= (0.21 × 713) - (PaCO₂ / 0.8) [at sea level, room air]
≈ 150 - (PaCO₂ × 1.25)
A-a Gradient = PAO₂ - PaO₂
Normal A-a gradient = age/4 + 4 (or roughly < 10-15 mm Hg in young adults)
| A-a Gradient | Cause of Hypoxemia |
|---|---|
| Normal | Hypoventilation, high altitude, low FiO₂ |
| Elevated | V/Q mismatch, diffusion defect, shunt |
5. THE ACID-BASE MAP (Visual Guide)
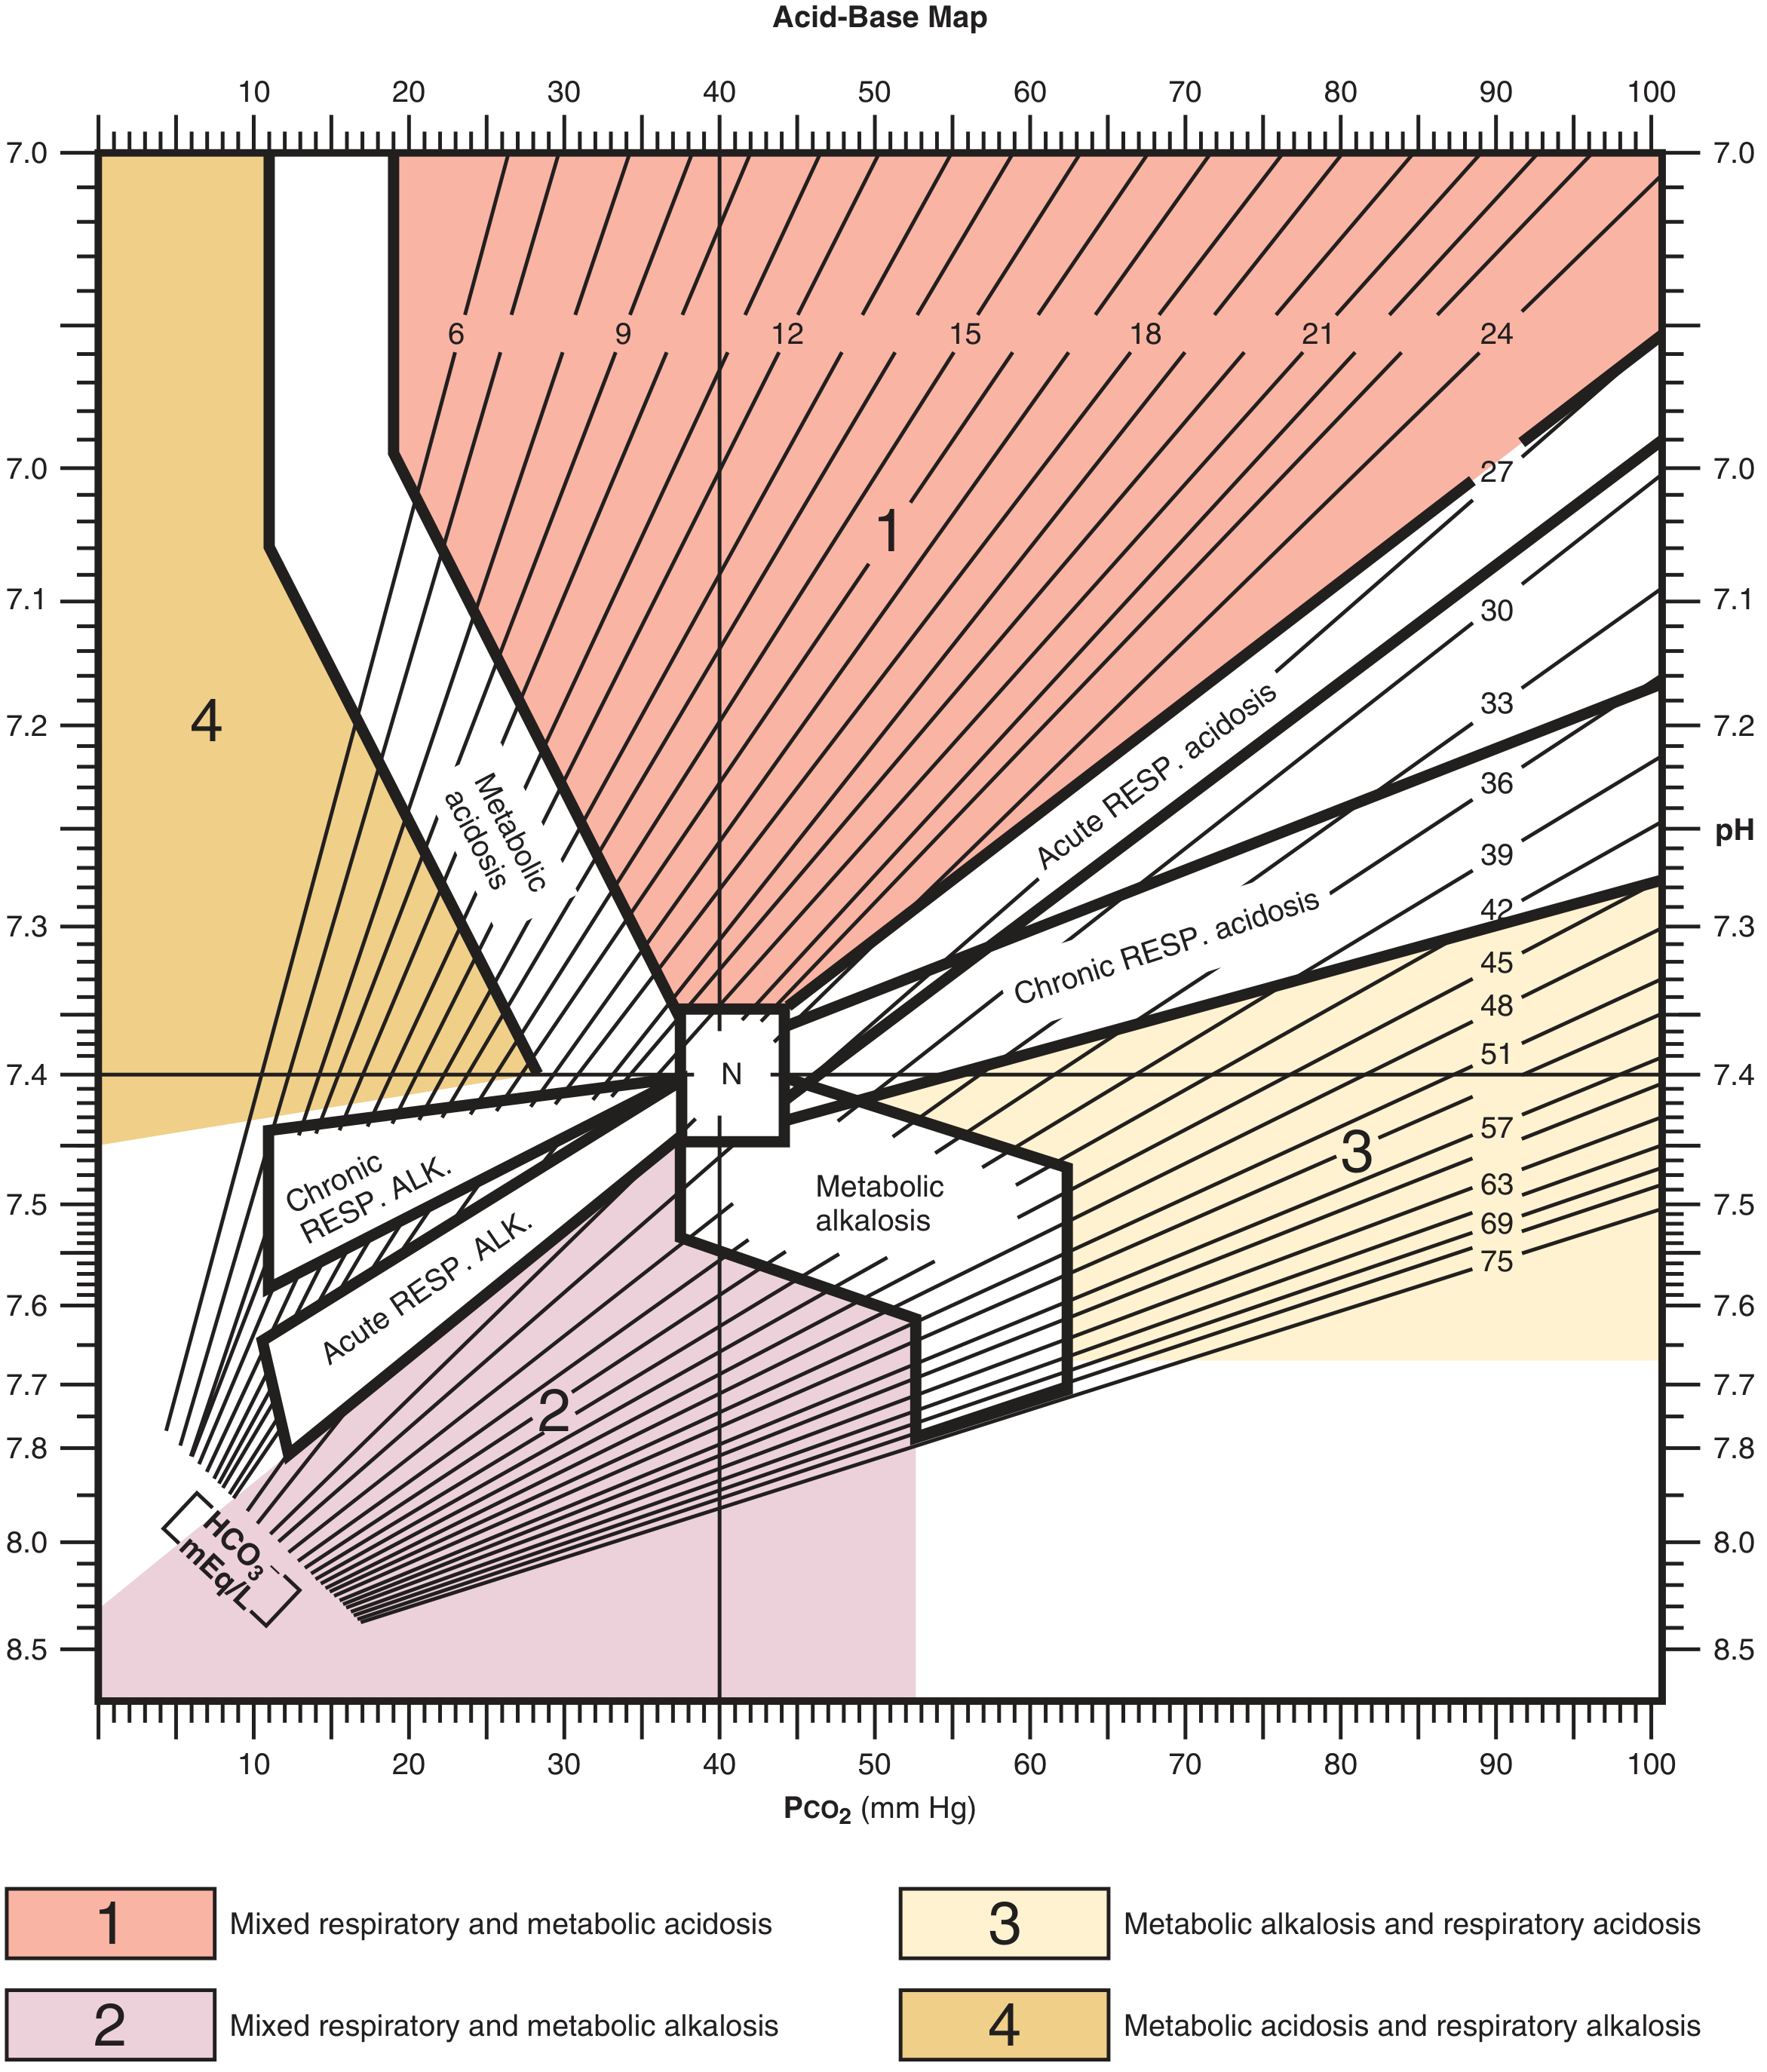
- Zone 1 (red): Mixed respiratory + metabolic acidosis
- Zone 2 (pink): Mixed respiratory + metabolic alkalosis
- Zone 3 (yellow): Metabolic alkalosis + respiratory acidosis
- Zone 4 (gold): Metabolic acidosis + respiratory alkalosis
- N = Normal point (pH 7.40, PaCO₂ 40 mm Hg)
6. THE FOUR PRIMARY DISORDERS IN DETAIL
A. RESPIRATORY ACIDOSIS
| Category | Examples |
|---|---|
| Pulmonary | COPD, asthma, pulmonary edema, pneumonia, pneumothorax, massive pleural effusion |
| Neuromuscular | Stroke, opioid/sedative overdose, sleep apnea, Guillain-Barré, myasthenia gravis, ALS, polio |
| Chest wall | Flail chest, muscular dystrophy, morbid obesity (OHS) |
| Airway obstruction | Foreign body, laryngospasm |
- Acute: kidneys raise HCO₃⁻ by 1 mEq/L per 10 mm Hg rise in PaCO₂
- Chronic (3-5 days): kidneys raise HCO₃⁻ by 4 mEq/L per 10 mm Hg rise in PaCO₂
B. RESPIRATORY ALKALOSIS
| Category | Examples |
|---|---|
| Pulmonary | Pneumonia, PE, asthma, pulmonary edema, interstitial lung disease |
| Extrapulmonary | Anxiety/pain, fever, pregnancy, CNS insult (stroke, tumor), cirrhosis, salicylate toxicity, sepsis |
| Iatrogenic | Mechanical over-ventilation |
- Acute: kidneys lower HCO₃⁻ by 2 mEq/L per 10 mm Hg fall in PaCO₂
- Chronic: kidneys lower HCO₃⁻ by 5 mEq/L per 10 mm Hg fall in PaCO₂
C. METABOLIC ACIDOSIS
High Anion Gap Metabolic Acidosis (HAGMA)
| MUDPILES | GOLDMARK |
|---|---|
| Methanol | Glycols (ethylene, propylene) |
| Uremia | Oxoproline (5-oxoprolinuria) |
| DKA / Diabetic ketoacidosis | L-Lactic acidosis |
| Paraldehyde | D-Lactic acidosis |
| Isoniazid / Iron | Methanol |
| Lactic acidosis | Aspirin (salicylates) |
| Ethylene glycol | Renal failure (uremia) |
| Salicylates | Ketoacidosis |
Normal Anion Gap Metabolic Acidosis (NAGMA)
| Cause | Mechanism |
|---|---|
| Diarrhea (most common) | GI HCO₃⁻ loss |
| Renal Tubular Acidosis (RTA) | Failure to reabsorb/generate HCO₃⁻ |
| Carbonic anhydrase inhibitors (acetazolamide) | Blocked renal HCO₃⁻ reabsorption |
| Dilutional acidosis | Large-volume normal saline infusion |
| Early renal failure | Before AG elevates |
| Ureterosigmoidostomy / GI fistulas | HCO₃⁻ exchange for Cl⁻ |
| Addison's disease | Aldosterone deficiency → H⁺ retention |
UAG = Urine (Na⁺ + K⁺) - Urine Cl⁻
- UAG negative (< 0): intact renal acidification = GI cause (diarrhea)
- UAG positive (> 0): impaired renal acidification = RTA
Expected PaCO₂ = (1.5 × HCO₃⁻) + 8 ± 2
or: ΔPaCO₂ = 1.3 × ΔHCO₃⁻
D. METABOLIC ALKALOSIS
| Urine Cl⁻ < 20 mEq/L (Chloride-responsive) | Urine Cl⁻ > 20 mEq/L (Chloride-resistant) |
|---|---|
| Vomiting / NG suction (HCl loss) | Primary hyperaldosteronism |
| Thiazide/loop diuretics (after discontinuation) | Cushing's syndrome |
| Post-hypercapnia | Exogenous mineralocorticoids |
| Villous adenoma | Bartter's / Gitelman's syndromes |
| Severe hypokalemia | |
| Excessive licorice ingestion |
- (PaCO₂ rarely exceeds 55 mm Hg due to hypoxic ventilatory drive)
- Chloride-responsive: IV normal saline + KCl replacement
- Chloride-resistant: Treat underlying cause (e.g., spironolactone for hyperaldosteronism)
7. MIXED ACID-BASE DISORDERS
- pH is normal but both PaCO₂ and HCO₃⁻ are abnormal
- Compensation is more or less than predicted
- The pH changes in opposite directions from what a single disorder would predict
| Combination | Clinical Example |
|---|---|
| Metabolic acidosis + Respiratory acidosis | Cardiac arrest, severe COPD + pneumonia |
| Metabolic alkalosis + Respiratory alkalosis | Cirrhosis with vomiting or NG suctioning |
| Metabolic acidosis + Metabolic alkalosis | DKA + vomiting |
| Metabolic acidosis + Respiratory alkalosis | Salicylate toxicity, sepsis |
| Metabolic alkalosis + Respiratory acidosis | COPD + diuretic use |
8. OXYGENATION ASSESSMENT
| Parameter | Formula / Value | Clinical Meaning |
|---|---|---|
| PaO₂ | Direct measurement | Oxygen dissolved in plasma |
| SaO₂ | Measured (co-oximetry) | Hemoglobin saturation |
| A-a gradient | PAO₂ - PaO₂ | Lung efficiency |
| PaO₂/FiO₂ ratio | PaO₂ ÷ FiO₂ | ARDS severity |
| CaO₂ | (Hgb × 1.34 × SaO₂) + (0.003 × PaO₂) | Total O₂ content |
-
300: Normal
- 200-300: Mild ARDS
- 100-200: Moderate ARDS
- < 100: Severe ARDS
| Mechanism | A-a Gradient | Examples |
|---|---|---|
| Hypoventilation | Normal | CNS depression, neuromuscular disease |
| Low FiO₂ | Normal | High altitude |
| V/Q mismatch | Elevated | PE, COPD, pneumonia, atelectasis |
| Diffusion impairment | Elevated | Pulmonary fibrosis |
| Right-to-left shunt | Elevated, doesn't correct with O₂ | ASD, intrapulmonary shunt, ARDS |
9. VENOUS BLOOD GAS (VBG) - When to Use
| Parameter | Arterial vs. Venous |
|---|---|
| pH | VBG pH is ~0.03-0.05 lower than ABG - closely correlates |
| PaCO₂ | VBG PCO₂ is ~4-6 mm Hg higher - trends with ABG |
| PaO₂ | Cannot use VBG for oxygenation |
| Lactate | VBG correlates well for normal or very high values |
10. WORKED EXAMPLES
Example 1: Diarrhea (Metabolic Acidosis with appropriate compensation)
- Na⁺ = 133, Cl⁻ = 118, pH = 7.26, PaCO₂ = 13, HCO₃⁻ = 5
Example 2: Sepsis (Respiratory Alkalosis)
- Na⁺ = 138, Cl⁻ = 105, pH = 7.49, PaCO₂ = 25, HCO₃⁻ = 22
Example 3: DKA (HAGMA with mixed disorder)
- Na⁺ = 138, Cl⁻ = 100, pH = 7.15, PaCO₂ = 20, HCO₃⁻ = 6
11. QUICK REFERENCE - THE SIX-STEP APPROACH
Step 1: pH → Acidemia or Alkalemia?
Step 2: PaCO₂ / HCO₃⁻ → Respiratory or Metabolic?
Step 3: Expected compensation → Appropriate? (If not = mixed disorder)
Step 4: Anion gap → High or Normal? (For metabolic acidosis)
Step 5: Delta-Delta → Hidden second metabolic disorder?
Step 6: PaO₂ / A-a gradient → Oxygenation status?
12. MEMORY TRICKS AT A GLANCE
| Trick | Meaning |
|---|---|
| ROME | Respiratory Opposite, Metabolic Equal (pH and primary parameter move in same direction for metabolic, opposite for respiratory) |
| MUDPILES | Causes of high-AG metabolic acidosis |
| USED CARP | Causes of normal-AG metabolic acidosis |
| Winter's formula | Expected PaCO₂ = 1.5×HCO₃⁻ + 8 ± 2 |
| "1-4-2-5 rule" | Resp. acidosis compensation: acute ↑1, chronic ↑4; Resp. alkalosis: acute ↓2, chronic ↓5 (per 10 mmHg PaCO₂ change) |
13. CRITICAL pH VALUES TO KNOW
| pH | Significance |
|---|---|
| < 6.8 | Usually incompatible with life |
| < 7.1 | Severe acidosis - consider bicarbonate therapy |
| 7.35 | Lower limit of normal |
| 7.40 | Physiologic target |
| 7.45 | Upper limit of normal |
| > 7.7 | Severe alkalosis - high risk of arrhythmia, tetany |
- Roberts & Hedges' Clinical Procedures in Emergency Medicine, p.1732-1734
- Tintinalli's Emergency Medicine: A Comprehensive Study, p.121
- Murray & Nadel's Textbook of Respiratory Medicine, p.272-2310
- Symptom to Diagnosis: An Evidence-Based Guide, 4th Ed., p.68-73
- Fishman's Pulmonary Diseases and Disorders

Read this report
🧪 Lab Report - Gurukrupa Clinical Laboratory
🩸 COMPLETE HAEMOGRAM
| Test | Result | Unit | Normal Range | Status |
|---|---|---|---|---|
| Haemoglobin | 11.9 | g/dL | 11.5 - 16.5 | ✅ Normal |
| RBC Count | 3.97 | million/cu.mm | 4.5 - 6.5 | 🔻 Low |
| PCV (Haematocrit) | 37.5 | % | 37 - 47 | ✅ Normal |
| MCV | 94.3 | fL | 80 - 99 | ✅ Normal |
| MCH | 30.2 | pg | 27 - 33 | ✅ Normal |
| MCHC | 32.0 | g/dL | 32 - 37 | ✅ Normal (low-normal) |
| RDW-CV | 13.6 | % | 11.0 - 14.5 | ✅ Normal |
| RDW-SD | 45.0 | fL | 10.0 - 15.0 | — |
| WBC Count | 8300 | /cu.mm | 4000 - 11000 | ✅ Normal |
| Neutrophils | 74 | % | 40 - 75 | ✅ Normal |
| Lymphocytes | 23 | % | 20 - 45 | ✅ Normal |
| Eosinophils | 01 | % | 1 - 6 | ✅ Normal |
| Monocytes | 02 | % | 0 - 10 | ✅ Normal |
| Basophils | 00 | % | 0 - 1 | ✅ Normal |
| Platelet Count | 2.28 | lakhs/cu.mm | 1.50 - 4.50 | ✅ Normal |
| PCT | 0.213 | % | 0.08 - 1.0 | ✅ Normal |
| MPV | 9.4 | fL | 7.4 - 11.5 | ✅ Normal |
| PDW | 16.3 | % | 10.0 - 15.0 | 🔺 Slightly High |
🍬 BLOOD GLUCOSE (RANDOM)
| Test | Result | Unit | Normal Range | Status |
|---|---|---|---|---|
| Plasma Glucose (Random) | 118 | mg% | 70 - 140 | ✅ Normal |
| Urine Glucose (Random) | Nil | — | — | ✅ Normal |
🫘 CREATININE TEST
| Test | Result | Unit | Normal Range | Status |
|---|---|---|---|---|
| Creatinine | 0.85 | mg/dL | 0 - 1.4 | ✅ Normal |
| eGFR | 78 | mL/min/1.73m² | 90 - 120 | 🔻 Mildly Reduced |
Summary of Abnormal Findings
| Finding | Value | Significance |
|---|---|---|
| RBC Count low (3.97 million/cu.mm) | Below normal (4.5-6.5) | Mild anaemia - red cells fewer than expected, though Hb and PCV are acceptable |
| PDW elevated (16.3%) | Above normal (10-15%) | Platelet Distribution Width raised - suggests platelet size variation (anisothrombia), can be seen with inflammation, iron deficiency, or reactive thrombocytosis |
| eGFR mildly reduced (78 mL/min/1.73m²) | Below normal (90-120) | Suggests mildly reduced kidney filtration function (CKD Stage G2 by KDIGO if persistent) |
Key Observations
- Haemoglobin is normal at 11.9 g/dL (just above the lower cut-off of 11.5) - technically within range but toward the lower end for a 42-year-old woman.
- RBC count is low despite acceptable Hb - this pattern alongside a normal MCV (94.3 fL) and normal MCHC suggests the cells are adequately filled but fewer in number. This pattern is worth monitoring.
- Kidney function - Creatinine is normal, but the eGFR of 78 is modestly below the 90-120 range. This could reflect the patient's age and body size rather than true kidney disease, but should be re-checked if not done previously.
- Random glucose is normal at 118 mg% with no glycosuria.
- WBC and differential are entirely normal - no infection/inflammatory signal.
⚠️ Note: This is a summary for informational purposes only. Please consult Dr. Ware Rahul G. or your treating physician to interpret these results in the context of your symptoms, medical history, and clinical examination.

Generate echocardiography report from above image
🫀 2D ECHOCARDIOGRAPHY REPORT
| Patient Name | HAJARE, MARUTI |
| Age | 70 Years |
| Sex | Male |
| Date | 06/07/2026 |
| Referred By | Dr. Rahul Ware |
A. LEFT VENTRICULAR (LV) STUDY
| Parameter | Value | Normal Range | Status |
|---|---|---|---|
| IVSd (Interventricular Septum - Diastole) | 1.0 cm | 0.6 - 1.1 cm | ✅ Normal |
| LVIDd (LV Internal Diameter - Diastole) | 4.1 cm | 3.9 - 5.3 cm | ✅ Normal |
| LVPWd (LV Posterior Wall - Diastole) | 1.1 cm | 0.6 - 1.1 cm | ✅ Normal (upper limit) |
| IVSs (Interventricular Septum - Systole) | 1.5 cm | 0.9 - 1.8 cm | ✅ Normal |
| LVIDs (LV Internal Diameter - Systole) | 2.4 cm | 2.0 - 3.5 cm | ✅ Normal |
| LVPWs (LV Posterior Wall - Systole) | 1.4 cm | 1.0 - 1.8 cm | ✅ Normal |
| EDV - Teichholz | 76 ml | 67 - 155 ml | ✅ Normal |
| ESV - Teichholz | 19 ml | 22 - 58 ml | ✅ Normal |
| EF - Teichholz | 75 % | 55 - 75 % | ✅ Normal (Hyperdynamic) |
| %FS (Fractional Shortening) | 43 % | 25 - 45 % | ✅ Normal |
| SV (Stroke Volume) | 57 ml | 60 - 100 ml | 🔻 Low-normal |
B. LEFT ATRIUM / AORTA (LA/Ao)
| Parameter | Value | Normal Range | Status |
|---|---|---|---|
| Aortic Root Diameter | 2.7 cm | 2.0 - 3.7 cm | ✅ Normal |
| LA Diameter | 3.8 cm | 1.9 - 4.0 cm | ✅ Normal (borderline) |
| LA/Ao Ratio | 1.40 | < 1.3 | 🔺 Mildly Elevated |
| D-E Excursion | 1.9 cm | > 1.5 cm | ✅ Normal |
| E-F Slope | 0.05 m/s | — | — |
| EPSS (E-Point Septal Separation) | 0.5 cm | < 1.0 cm | ✅ Normal |
C. MITRAL VALVE
| Parameter | Value | Normal Range | Status |
|---|---|---|---|
| MV E Velocity | 0.57 m/s | 0.6 - 1.3 m/s | 🔻 Low |
| MV Deceleration Time (DecT) | 265 ms | 150 - 220 ms | 🔺 Prolonged |
| MV Deceleration Slope | 2.2 m/s² | — | — |
| MV A Velocity | 0.77 m/s | 0.2 - 0.6 m/s | 🔺 Elevated |
| MV E/A Ratio | 0.74 | 0.8 - 1.5 | 🔺 Reversed (< 0.8) |
| E/E' (Lateral) | 10.53 | < 8 (normal), > 14 (elevated filling) | ⚠️ Intermediate |
| E' (Tissue Doppler) | 0.05 m/s | > 0.10 m/s | 🔻 Reduced |
- E < A with E/A ratio 0.74 (reversed)
- Prolonged deceleration time (265 ms)
- Reduced E' (0.05 m/s) indicating impaired myocardial relaxation
- E/E' of 10.53 - intermediate zone (indeterminate filling pressures)
- No significant stenosis or regurgitation pattern identified
D. AORTIC VALVE
| Parameter | Value | Normal Range | Status |
|---|---|---|---|
| AV Vmax (Peak Velocity) | 1.48 m/s | < 2.0 m/s | ✅ Normal |
| AV maxPG (Max Pressure Gradient) | 8.73 mmHg | < 20 mmHg | ✅ Normal |
E. TRICUSPID VALVE
| Parameter | Value | Normal Range | Status |
|---|---|---|---|
| TR Vmax (Tricuspid Regurgitation Peak Velocity) | 1.45 m/s | < 2.8 m/s | ✅ Normal |
| TR maxPG (Max Pressure Gradient) | 8.46 mmHg | — | ✅ Normal |
| RAP (Right Atrial Pressure) | 10.00 mmHg | 3 - 8 mmHg | 🔺 Mildly Elevated |
| RVSP (RV Systolic Pressure) | 18.46 mmHg | < 35 mmHg | ✅ Normal |
F. PULMONARY VALVE
| Parameter | Value | Normal Range | Status |
|---|---|---|---|
| PV Vmax | 1.48 m/s | < 1.9 m/s | ✅ Normal |
| PV maxPG | 8.80 mmHg | < 16 mmHg | ✅ Normal |
SUMMARY & IMPRESSION
- EF = 75%, %FS = 43% - preserved and hyperdynamic systolic function.
- E/A ratio reversed at 0.74, prolonged DT (265 ms), reduced E' (0.05 m/s)
- E/E' = 10.53 - indeterminate filling pressures
- Consistent with age-related and possibly hypertension-related diastolic impairment
RECOMMENDATIONS
- Correlate clinically with symptoms of exertional dyspnoea, orthopnoea, or ankle oedema which may reflect diastolic heart failure (HFpEF - Heart Failure with Preserved Ejection Fraction).
- Optimize blood pressure control if hypertensive, as this is the most common cause of diastolic dysfunction in a 70-year-old male.
- Follow-up echocardiogram in 1-2 years or earlier if symptoms worsen.
- Consider BNP/NT-proBNP if clinically indicated.
⚠️ Disclaimer: This report is generated from raw machine data captured on screen. The "Conventional Colour & Tissue Doppler" section and impression text were not fully visible in the image. Final interpretation should be made by a qualified cardiologist in conjunction with clinical findings.
Does orris care have API?
Orris care API developer access medical AI
- Founded May 2025 (US entity) / Feb 2025 (Indian entity - Orriumisocare Pvt Ltd)
- Small team of 2-10 employees, still in beta
- Product is designed for point-of-care clinical decision support
- Mentioned goal of "Integration with hospital workflows" - suggesting API/integration capabilities may be on the roadmap, but not yet publicly available
- Reach out to their team directly at hi@orris.care to ask about API access, partnership, or integration possibilities
- Visit orris.care for the latest updates
Do you need help connecting your lab data or imaging systems to clinical AI tools?
What best describes your role? · What are you trying to achieve? · Where are you in the process?
🏗️ Building a Clinical AI Integration - Your Roadmap
1. 📄 Lab Report Ingestion (Like Gurukrupa Lab)
| Approach | How | Tools |
|---|---|---|
| Image/PDF → AI extraction | Photo or scan → OCR + AI parsing | Google Vision API, AWS Textract, Azure Form Recognizer |
| Direct LIS integration | If the lab uses software (Meditech, SoftClinic, etc.) ask for HL7 or CSV export | HL7 v2 / FHIR R4 |
| What you just did here | Upload photo → Orris reads it | Already working! |
2. 🫀 ECHO / Imaging Machine Integration
| Approach | How |
|---|---|
| DICOM receiver | Most ECHO machines can push to a PACS server via DICOM. Set up an open-source PACS (Orthanc is free) to receive files |
| Screen capture (what you're doing now) | Photo → AI reads values - simple but not scalable |
| Structured report export | Some machines export XML/PDF structured reports - check your ECHO machine's model |
| AI on DICOM video | Advanced - AI reads the actual echo loops (requires specialized CV models) |
3. 🤖 AI Interpretation Layer
| Tool | Best For | API? |
|---|---|---|
| Orris Care | Clinical Q&A, report interpretation | Not yet (contact hi@orris.care) |
| EvidenceMD API | Evidence-based clinical reasoning | ✅ Yes, OpenAI-compatible |
| OpenAI GPT-4o | General interpretation with custom prompts | ✅ Yes |
| Google Health AI (Med-PaLM) | Medical reasoning | Limited access |
| Build your own | Fine-tune on your own patient data | Requires ML expertise |
4. 🔗 Putting It Together - A Simple Architecture
Lab Machine / ECHO Machine
↓
PDF / DICOM / Photo
↓
OCR / DICOM Parser
↓
Structured JSON Data
{Hb: 11.9, EF: 75%, ...}
↓
AI Interpretation API
(EvidenceMD / GPT-4o / Orris)
↓
Clinical Report / Alert
→ Doctor's Phone / EMR
5. 🇮🇳 India-Specific Considerations
- ABDM (Ayushman Bharat Digital Mission) - India's national health stack supports FHIR R4. Building ABDM-compliant can unlock interoperability with PHR apps and government systems.
- ABHA integration - Linking patient records to their ABHA ID is the direction India's health system is moving.
- Data privacy - DPDP Act 2023 applies. Patient data must be handled with consent.
What I'd Suggest as Your Next Step
- Standardize your data input - get lab PDFs + ECHO structured reports
- Use a Vision AI API (AWS Textract or Google Vision) to parse reports automatically - this replaces manual photo uploads
- Call EvidenceMD or GPT-4o API with the parsed data for interpretation
- Display results in a simple web/mobile dashboard for the clinic