
Explain ECG
I'll start by reading the medical library skill, then pull relevant ECG content from the textbooks.
Reading File
Now let me search the library for ECG content in parallel:
Finding Sources
Finding Sources
Good sources found. Let me read the key ECG sections from Costanzo Physiology and Medical Physiology, and also grab the normal ECG image from Goldman-Cecil:
Reading File
Reading File
Reading File
Good. Now let me read the core ECG section from Costanzo (the dedicated Electrocardiogram section) and fetch the normal ECG image:
Reading File
Loading Image
Finding Sources
Excellent. Now let me read the Guyton ECG waveforms section and the Harrison's ECG section, plus the Costanzo ECG diagram:
Reading File
Reading File
Loading Image
Now let me read more Costanzo content on QRS/ST/QT and leads, plus the Harrison's leads and axis section:
Reading File
Reading File
I now have comprehensive content from multiple authoritative textbooks. Let me also fetch the Harrison's waveform diagram and read a bit more on clinical interpretation:
Loading Image
Reading File
I now have rich content from multiple major textbooks plus three diagrams. I have everything needed to write a thorough, well-illustrated explanation of the ECG.
Electrocardiogram (ECG)
The ECG (also called EKG, from the German Elektrokardiogramm) is a recording of tiny electrical potential differences on the surface of the body that reflect the electrical activity of the heart. These voltages arise because the different parts of the myocardium depolarize and repolarize in a specific timed sequence - the atria before the ventricles, and with the ventricles following a precise pathway through the His-Purkinje system. Surface electrodes detect those voltage gradients and plot them against time.
Why Can We Record the Heart From the Skin?
When a cardiac impulse travels through the heart, electrical current spreads into surrounding tissues and a small fraction reaches the skin. Electrodes placed on opposite sides of the heart detect the potential difference. A key rule: a positive (upward) deflection is recorded in a lead when the depolarization wave travels toward that lead's positive pole; a negative deflection is recorded when it travels away from it. - Harrison's Principles of Internal Medicine 22E
The Normal ECG Waveform
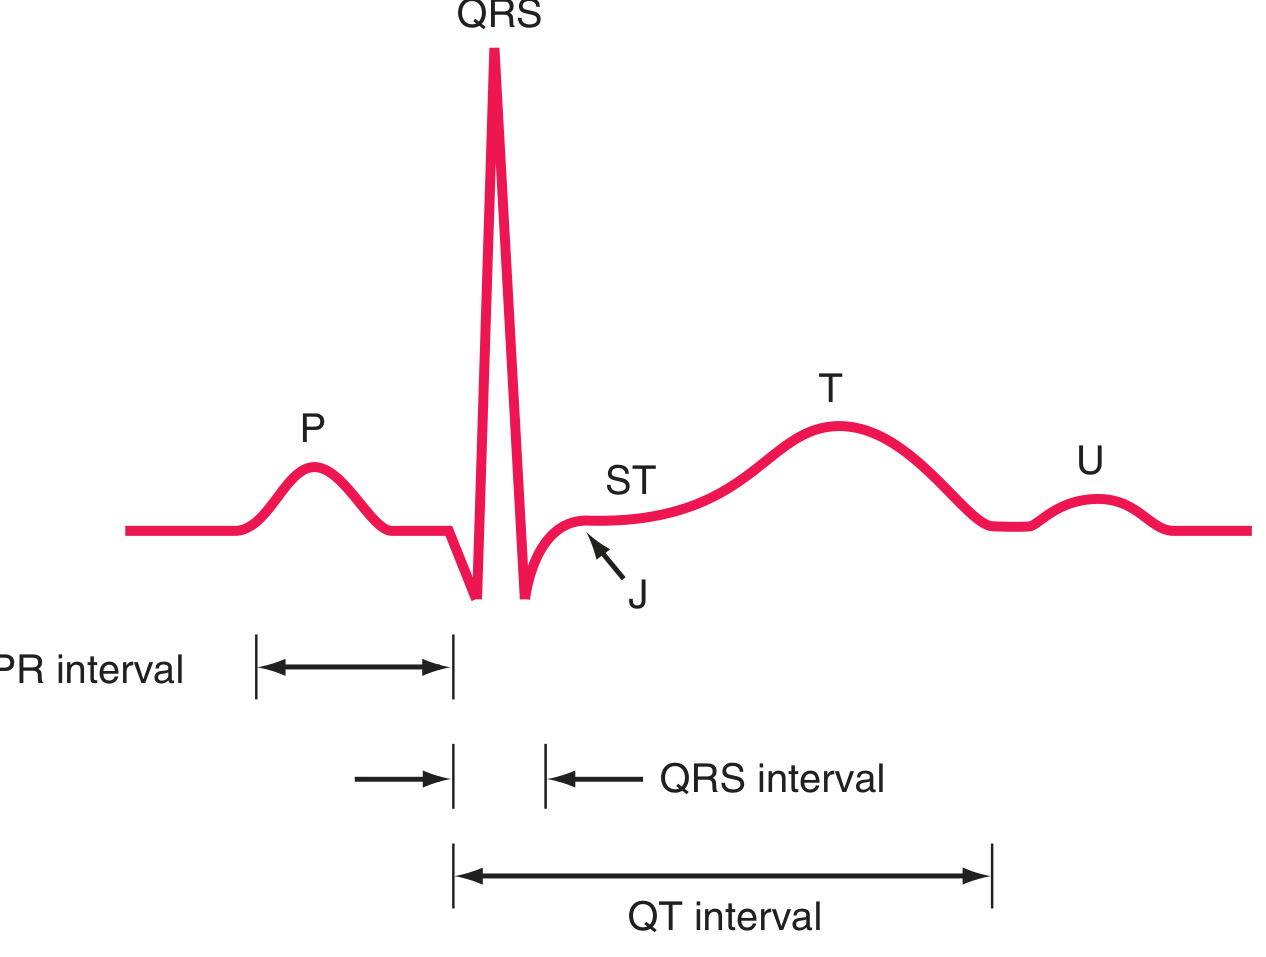
ECG waveforms and intervals. The J point marks the junction between the end of QRS and the start of the ST segment. - Harrison's Principles of Internal Medicine 22E

The ECG from Lead II showing all major waves, intervals, and segments. - Costanzo Physiology 7th Edition
Waves
| Wave | What it represents | Notes |
|---|---|---|
| P wave | Atrial depolarization | Normally positive in lead II, negative in aVR. A wider P wave = slower atrial conduction. |
| Q wave | Initial septal depolarization (left to right) | Small Q in V6; abnormal Q = myocardial infarction |
| R wave | Main ventricular depolarization vector | Tallest component of QRS |
| S wave | Terminal ventricular depolarization | Negative deflection after R |
| T wave | Ventricular repolarization | Normally concordant (same direction) with QRS |
| U wave | Late-phase ventricular repolarization | Usually small; prominent in hypokalemia |
Atrial repolarization is not seen on a normal ECG - it is buried within the QRS complex. - Costanzo Physiology 7th Edition, p.149
Intervals and Segments
The key distinction: intervals include the waves on both ends; segments are purely flat (isoelectric) connectors between waves and do not include the waves themselves.
| Feature | Normal Value | What it measures | Clinical significance |
|---|---|---|---|
| PR interval | 120-200 ms | Atrial depolarization + AV node conduction delay | Prolonged = 1st-degree heart block; short = pre-excitation (WPW) |
| PR segment | Isoelectric | AV node conduction time only | ST depression here = pericarditis |
| QRS duration | ≤100-110 ms | Ventricular depolarization time | Wide QRS (≥120 ms) = bundle branch block or ventricular origin |
| ST segment | Isoelectric (J point to T) | Corresponds to plateau of ventricular action potential (phase 2) | Elevation = STEMI, pericarditis; depression = ischemia |
| QT interval | ≤460 ms (women), ≤450 ms (men) | Ventricular depolarization + repolarization | Prolonged = drugs/electrolytes/channelopathy; short = hypercalcemia, digoxin |
| RR interval | Varies with HR | Time between beats | Used to calculate heart rate |
Heart rate = 300 ÷ number of large squares between R waves (at 25 mm/s paper speed), or more precisely = 1/cycle length (in seconds). - Costanzo Physiology 7th Edition
ECG Paper Speed and Calibration
The standard ECG is recorded at 25 mm/s:
- Each small 1 mm box = 40 ms (0.04 s)
- Each large 5 mm box = 200 ms (0.20 s)
- Vertically: 1 mV = 10 mm (standard calibration)
The 12-Lead ECG System
A standard 12-lead ECG uses 10 electrodes to create 12 different "viewpoints" of the heart's electrical activity. - Harrison's Principles of Internal Medicine 22E
Limb Leads (Frontal Plane)
These record electrical activity projected onto the frontal plane:
| Lead | Positive pole direction |
|---|---|
| Lead I | Left arm (0°) |
| Lead II | Left leg (+60°) |
| Lead III | Left leg (+120°) |
| aVR | Right arm (-150°) |
| aVL | Left arm (-30°) |
| aVF | Left leg (+90°) |
Precordial (Chest) Leads (Horizontal Plane)
These record the horizontal plane and are placed across the chest:
| Lead | Position |
|---|---|
| V1 | 4th intercostal space, right sternal border |
| V2 | 4th intercostal space, left sternal border |
| V3 | Between V2 and V4 |
| V4 | 5th intercostal space, midclavicular line |
| V5 | Anterior axillary line |
| V6 | Midaxillary line |
Each lead is like a different camera angle looking at the same event. The precordial leads show R-wave progression - the QRS complex transitions from predominantly negative (V1-V2) to predominantly positive (V4-V6) as you move leftward around the chest. - Harrison's Principles of Internal Medicine 22E
The Normal ECG - 12-Lead Example
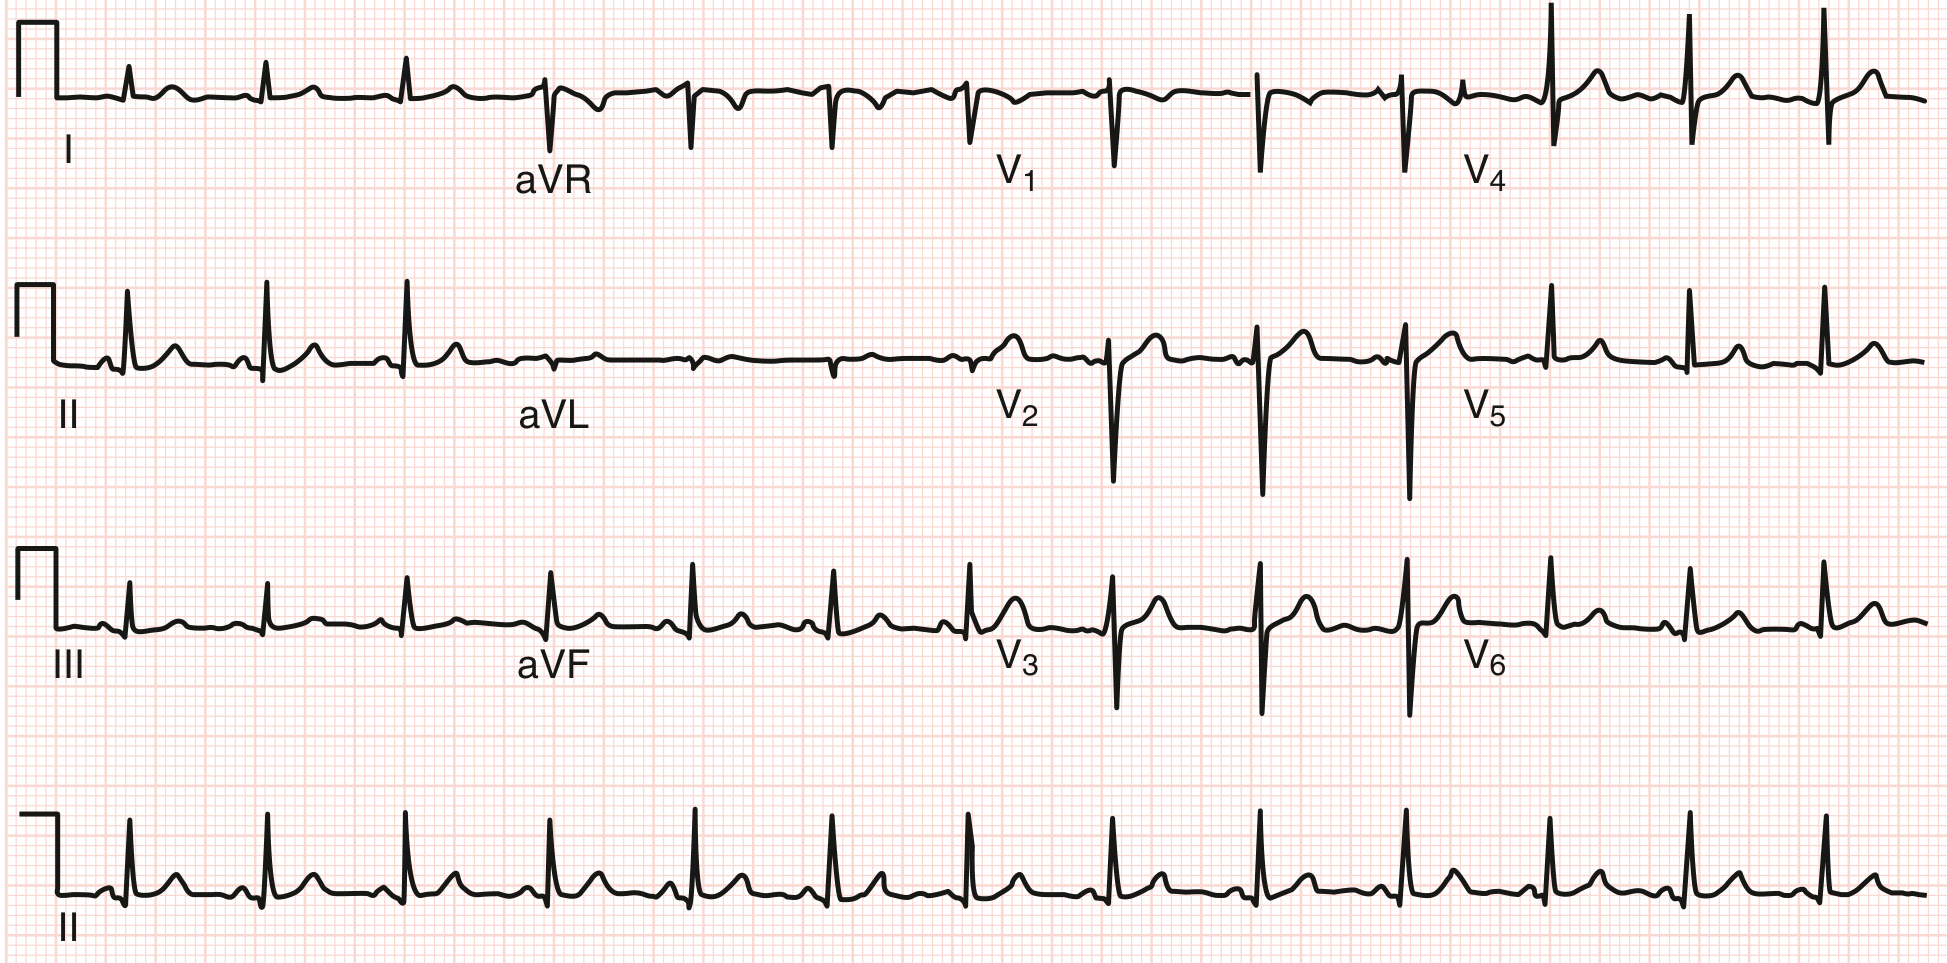
Normal 12-lead ECG. Heart rate ~78 bpm. PR ~140 ms, QRS ~90 ms, QT ~360 ms. Axis ~+60°. Sinus arrhythmia present. No abnormal Q waves. ST segments isoelectric. - Goldman-Cecil Medicine
Cardiac Electrical Sequence and ECG Correlation
The sequence of electrical activation maps precisely onto each part of the ECG:
- SA node fires - not visible on ECG (too small)
- Atria depolarize → P wave (vector directed downward-left from SA node)
- AV node delay → PR segment (isoelectric, ~50-70 ms)
- His bundle → Bundle branches → Purkinje fibers → Ventricles depolarize → QRS complex
- First, the septum depolarizes left-to-right (small Q in lateral leads, small r in V1)
- Then the larger left ventricle dominates the vector (tall R in lateral leads, deep S in V1)
- Ventricular plateau (phase 2) → ST segment (isoelectric)
- Ventricles repolarize → T wave (normally same direction as QRS because repolarization reverses direction)
The QRS-to-action potential relationship: phase 0 (rapid Na+ influx upstroke) = QRS onset; phase 2 (plateau) = ST segment; phase 3 (repolarization) = T wave. - Harrison's Principles of Internal Medicine 22E
Electrical Axis
The mean QRS axis is the net direction of ventricular depolarization in the frontal plane.
- Normal axis: -30° to +90°
- Left axis deviation (LAD): more negative than -30° - seen in left anterior fascicular block, inferior MI, LVH
- Right axis deviation (RAD): more positive than +90° - seen in right ventricular hypertrophy, left posterior fascicular block, pulmonary embolism
Quick method: If the QRS is positive in lead I and positive in aVF, the axis is normal (+quadrant). - Goldman-Cecil Medicine
Key Clinical Abnormalities
| Finding | Likely Cause |
|---|---|
| Prolonged PR (>200 ms) | 1st-degree AV block, AV nodal disease |
| Short PR + delta wave | Wolff-Parkinson-White (pre-excitation) |
| Wide QRS (≥120 ms) | Bundle branch block, ventricular rhythm, hyperkalemia |
| ST elevation | STEMI, pericarditis, Brugada syndrome |
| ST depression | Subendocardial ischemia, digoxin effect |
| Tall peaked T waves | Early hyperkalemia |
| Flattened/inverted T waves | Ischemia, hypokalemia |
| Prolonged QT | Drugs (amiodarone, quinidine), hypocalcemia, hypomagnesemia, congenital LQTS |
| Shortened QT | Hypercalcemia, digoxin, congenital SQTS |
| Tall R in V1, deep S in V5-V6 | Right ventricular hypertrophy |
| Tall R in V5-V6, deep S in V1-V2 | Left ventricular hypertrophy (by voltage criteria) |
Summary: What the ECG Tells You
The 12-lead ECG is a non-invasive window into:
- Heart rate and rhythm (via R-R intervals and P-wave morphology)
- Conduction system integrity (PR, QRS duration)
- Ventricular repolarization (ST-T changes)
- Chamber size/hypertrophy (voltage amplitude)
- Ischemia and infarction (ST changes, Q waves)
- Electrolyte and drug effects (QT, T-wave morphology)
Sources: Costanzo Physiology 7th Ed. | Guyton and Hall Medical Physiology | Harrison's Principles of Internal Medicine 22E | Goldman-Cecil Medicine | Medical Physiology (Boron & Boulpaep)
This is a shared conversation. Sign in to Orris to start your own chat.