The cell and its functions chapter short notes of all topics in sequence with all important points covered from guyton
Reading File
Finding Sources
Finding Sources
Reading File
Finding Sources
Finding Sources
Reading File
Reading File
I now have all the key content. Let me compile the comprehensive short notes from everything I've gathered.
The Cell and Its Functions — Short Notes (Guyton & Hall, Chapter 2)
1. CELL STRUCTURE — Overview
Every cell contains intracellular organelles that are critical for function (e.g., loss of mitochondria → >95% energy loss immediately).
Chemical composition of the cell:
- Water — 70–85% of cell mass; solvent for salts, gases, nutrients, waste
- Electrolytes — K⁺, Mg²⁺, PO₄³⁻ (mainly intracellular); Na⁺, Cl⁻, HCO₃⁻ (mainly extracellular); provide the electrical environment needed for cellular reactions
- Proteins — 10–20% of cell mass; two types:
- Structural proteins — form long filaments; build microtubules (cytoskeleton, cilia, nerve axons, mitotic spindles), collagen, elastin
- Functional proteins (enzymes) — tubular-globular; mobile in cell fluid; catalyze chemical reactions (e.g., glucose → CO₂ + H₂O + energy)
- Lipids — ~2% of cell mass; mainly phospholipids and cholesterol → form membranes; triglycerides stored in adipocytes (up to 95% cell mass) as energy reserve
- Carbohydrates — ~1% (up to 3% in muscle, 6% in liver); stored as glycogen; dissolved glucose always available in ECF
2. MEMBRANOUS STRUCTURES OF THE CELL
Organelles enclosed by lipid-protein membranes: cell membrane, nuclear membrane, ER membrane, mitochondrial membranes, lysosomal, peroxisomal, and Golgi membranes.
- Lipid barrier → impedes water-soluble substances
- Protein channels in membranes → specialized transport pathways
3. CELL MEMBRANE (Plasma Membrane)
- Thickness: 7.5–10 nm; thin, pliable, elastic
- Composition: 55% proteins, 25% phospholipids, 13% cholesterol, 4% other lipids, 3% carbohydrates
Lipid Bilayer
Three main lipids:
- Phospholipids — most abundant; phosphate head = hydrophilic (faces water); fatty acid tail = hydrophobic (faces center); self-orient into bilayer
- Sphingolipids — derived from sphingosine; mainly in nerve cells; functions: protection from harmful environment, signal transmission, adhesion sites for extracellular proteins
- Cholesterol — steroid nucleus = fat-soluble; dissolved in bilayer; regulates degree of permeability to water-soluble substances
Key permeability rule:
- Impermeable to: ions, glucose, urea (water-soluble)
- Freely permeable to: O₂, CO₂, alcohol (fat-soluble)
Membrane Proteins
- Integral proteins — span the full thickness of membrane; form ion channels/pores; act as carrier proteins; function as enzymes
- Peripheral proteins — attached to integral proteins or lipid surface; mostly enzymes or control substances that transmit signals
Carbohydrates on cell membrane:
- Attached to proteins → glycoproteins; attached to lipids → glycolipids
- Together form the glycocalyx (carbohydrate coat)
- Functions: (a) negatively charged → repels other negative objects; (b) loose connective tissue attachment (fibronectin); (c) immune reactions (ABO blood group antigens); (d) receptor sites for hormones (e.g., insulin)
4. CYTOPLASM AND ITS ORGANELLES
A. Endoplasmic Reticulum (ER)
- A network of tubules and vesicles throughout the cytoplasm
- Two types:
- Granular (Rough) ER: surface studded with ribosomes; synthesizes proteins destined for secretion or membrane use
- Agranular (Smooth) ER: no ribosomes; synthesizes lipids; stores Ca²⁺ (in muscle); contains drug-metabolizing enzymes
ER Functions (detailed):
- Synthesis of proteins (rough ER): large polypeptide chains pass into ER lumen → undergo modifications (folding, glycosylation, disulfide bonds)
- Proteins extruded into ER are carried in vesicles to Golgi apparatus
- Synthesis of lipids → phospholipids and cholesterol for membrane replenishment
- Detoxification of drugs by smooth ER enzymes (esp. in liver)
- Initial processing and packaging of substances for export
B. Golgi Apparatus
- Closely related to ER; consists of 4 or more stacked flat vesicular sacs
- Concentrated near nucleus, but distributed throughout the cell
- Receives vesicles from ER ("cis" side), processes them, then packages them at the "trans" side
Golgi Functions:
- Glycosylation — adds carbohydrate moieties to proteins → forms glycoproteins and proteoglycans
- Packaging for secretion → forms secretory vesicles that migrate to cell surface → exocytosis (triggered by Ca²⁺ entry)
- Lysosome formation — packages digestive enzymes into primary lysosomes
- Membrane replenishment — vesicle membranes fuse with cell membrane or organelle membranes to replenish membrane used in phagocytosis/pinocytosis
C. Lysosomes
- Membrane-enclosed vesicles (~250–750 nm); formed by Golgi apparatus
- Contain hydrolytic (digestive) enzymes (acid hydrolases) — active at pH ~5
- Lysosomal membrane: thick, resistant to enzyme digestion; prevents self-destruction
- Primary lysosomes → fuse with phagocytic/pinocytotic vesicles → secondary lysosomes (digestive vacuoles)
- Digest bacteria, foreign particles, damaged organelles (autophagy)
- Residual body: indigestible material remaining after digestion
- Autolysis: in necrotic or damaged cells, lysosomal membranes rupture → enzymes digest entire cell
D. Peroxisomes
- Similar to lysosomes but contain oxidases (not hydrolases)
- Oxidize various substances using O₂ → produce H₂O₂ → immediately broken down by catalase
- Especially important in liver: oxidize alcohol → detoxification
- Oxidize long-chain fatty acids
E. Secretory Vesicles
- Formed by Golgi apparatus in highly secretory cells
- Diffuse to cell membrane → fuse → exocytosis (stimulated by Ca²⁺)
- Secrete hormones, enzymes, neurotransmitters, etc.
F. Mitochondria
- Present throughout cytoplasm; number varies from a few hundred to thousands depending on cell energy needs
- Structure:
- Outer membrane: smooth
- Inner membrane: folded into cristae → greatly increases surface area
- Matrix between cristae: contains citric acid cycle enzymes, dissolved O₂, CO₂, water, and ATP
- Two compartments: intermembrane space and matrix
- Mitochondria contain their own DNA → can reproduce themselves (self-replicating)
- Function: "powerhouse of the cell" — oxidative metabolism
- Nutrients (glucose → pyruvate, fatty acids, amino acids) enter the matrix
- Citric acid cycle (Krebs cycle) in matrix → releases H atoms
- Oxidative phosphorylation on inner membrane (electron transport chain + ATP synthase) → produces ATP
- ~95% of all cellular ATP is produced here
G. Cell Cytoskeleton
Three types of structural filaments:
- Microtubules (~25 nm diameter) — made of tubulin polymers; provide structural support; form mitotic spindle during cell division; form cores of cilia and flagella
- Microfilaments (~6 nm) — composed of actin; involved in cell movement, muscle contraction, cell division (cytokinesis)
- Intermediate filaments (~10 nm) — mechanical support; various types (desmin, vimentin, cytokeratins)
5. NUCLEUS
- Control center of the cell — contains the genetic code (DNA)
- Structure:
- Nuclear envelope = double membrane with large pores (~10 nm) allowing substances to pass between nucleus and cytoplasm
- Nucleolus = dense body inside nucleus; contains large amounts of RNA and proteins; site of ribosome synthesis; may be multiple; absent during mitosis
- Nucleoplasm = fluid of nucleus; contains DNA organized into chromosomes
- Human cells have 46 chromosomes (23 pairs); total DNA = ~6 feet long when unraveled, packed into a nucleus only 6 μm in diameter
- Chromatin: DNA + histone proteins; condensed into chromosomes during mitosis
- DNA function: controls protein synthesis and cell reproduction
6. FUNCTIONAL SYSTEMS OF THE CELL
A. Endocytosis — Ingestion by the Cell
Two main types:
- Pinocytosis (cell drinking):
- Cell membrane invaginates around extracellular fluid + dissolved particles → forms pinocytotic vesicle (~100–200 nm)
- Continuous in most cells, especially macrophages
- Driven by: proteins with RGD sequences, clathrin-coated pits
- Phagocytosis (cell eating):
- Large particles (bacteria, dead cells, foreign matter) engulfed by pseudopods → form phagocytic vesicle (phagosome)
- Mainly performed by: macrophages and neutrophils
- Phagosome fuses with lysosome → phagolysosome → digestion
Receptor-mediated endocytosis:
- Specific proteins on membrane surface bind ligands → invagination → endosome
- LDL cholesterol enters cells this way
B. Lysosomes Digest Ingested Substances
- Pinocytotic/phagocytic vesicles fuse with lysosomes → digestion
- Products (amino acids, fatty acids, glucose, ions) diffuse into cytoplasm for use
- Lysosomal storage diseases: genetic absence of specific lysosomal enzyme → accumulation of undigested substances (e.g., Gaucher disease, Tay-Sachs disease)
7. SYNTHESIS BY ER AND GOLGI APPARATUS
Rough ER → Protein Synthesis Pathway:
- mRNA attaches to ribosomes on rough ER
- Polypeptide chain grows and enters ER lumen
- Proteins folded, disulfide bridges formed, glycosylation begins
- Proteins packaged into transport vesicles → migrate to Golgi apparatus
Golgi Apparatus Processing:
- Proteins further glycosylated and sorted
- Packaged into:
- Secretory vesicles (for exocytosis)
- Lysosomes
- Vesicles for intracellular membranes
Signal peptide hypothesis: newly synthesized protein has N-terminal signal sequence → directs ribosome to dock on ER membrane → protein threaded into ER lumen
8. MITOCHONDRIA EXTRACT ENERGY FROM NUTRIENTS
Substrates entering cell: glucose, fatty acids, amino acids + O₂
Steps:
- Glucose → pyruvate → acetyl-CoA (glycolysis in cytoplasm)
- Fatty acids → β-oxidation → acetyl-CoA
- Acetyl-CoA enters citric acid cycle (Krebs cycle) → CO₂ + NADH + FADH₂ + GTP
- NADH/FADH₂ → electron transport chain on inner mitochondrial membrane → H atoms oxidized by O₂ → H₂O
- Energy released → ATP synthesis (oxidative phosphorylation via ATP synthase)
ATP — Functional Characteristics
- Structure: adenine + ribose + 3 phosphate groups; last two linked by high-energy phosphate bonds (~7,300 cal/mol each)
- ATP → ADP + Pᵢ + energy (used for all cellular work)
- ADP recharged back to ATP by mitochondria
- Acts as the universal energy currency of the cell
- 1 glucose molecule → ~38 ATP (net) under aerobic conditions
- Used for: muscle contraction, active transport, protein synthesis, cell division, secretion
9. LOCOMOTION OF CELLS
A. Ameboid Movement
- Cell extends pseudopods (false feet) in the direction of movement
- Actin filaments polymerize at leading edge → push membrane forward
- Cytoplasm streams into pseudopod
- Stimulated by: chemotaxis (chemical gradient toward higher concentration)
- Important in: macrophages, neutrophils (move toward bacteria/inflammation)
- Also important in: embryonic cell migration, wound healing
B. Cilia and Ciliary Movement
- Cilia: hair-like projections on cell surfaces (e.g., respiratory epithelium, fallopian tube)
- Structure: 9 + 2 arrangement of microtubules (9 peripheral doublets + 2 central)
- Mechanism: dynein arms (ATPase) walk along adjacent doublet → causes bending
- Ciliary beat: effective stroke (stiff, rapid) + recovery stroke (flexible, slow) → net fluid movement
- Flagella: longer; similar structure; propel sperm
- Primary cilia: single (9+0); no motility; act as sensory antennae
10. KEY SUMMARY TABLE
| Organelle | Main Function |
|---|---|
| Cell membrane | Selective barrier; receptor site; signal transduction |
| Rough ER | Protein synthesis; initial glycosylation |
| Smooth ER | Lipid synthesis; Ca²⁺ storage; drug detoxification |
| Golgi apparatus | Processing, sorting, packaging of proteins; lysosome formation |
| Lysosomes | Intracellular digestion; autophagy |
| Peroxisomes | Oxidation reactions; H₂O₂ → H₂O (catalase); fatty acid oxidation |
| Mitochondria | ATP production (oxidative phosphorylation); ~95% of cell ATP |
| Nucleus | DNA storage; gene expression; cell reproduction control |
| Cytoskeleton | Cell shape; motility; intracellular transport |
| Secretory vesicles | Exocytosis of secretory products |
Source: Guyton and Hall Textbook of Medical Physiology (14th Ed.), Chapter 2 - The Cell and Its Functions, ISBN 9780443111013
Now all important images of this chapter
Reading File
Reading File
Searching Content
"cdn.orris.care/cdss_images" in /textbooks/9780443111013
Loading Image
Loading Image
Loading Image
Loading Image
Loading Image
Reading File
Loading Image
Reading File
Loading Image
Loading Image
Reading File
Reading File
Loading Image
Reading File
Loading Image
Here are all the important images from Chapter 2 — The Cell and Its Functions (Guyton & Hall), in sequence:
Fig. 2.1 — Cell Structures Visible Under Light Microscope
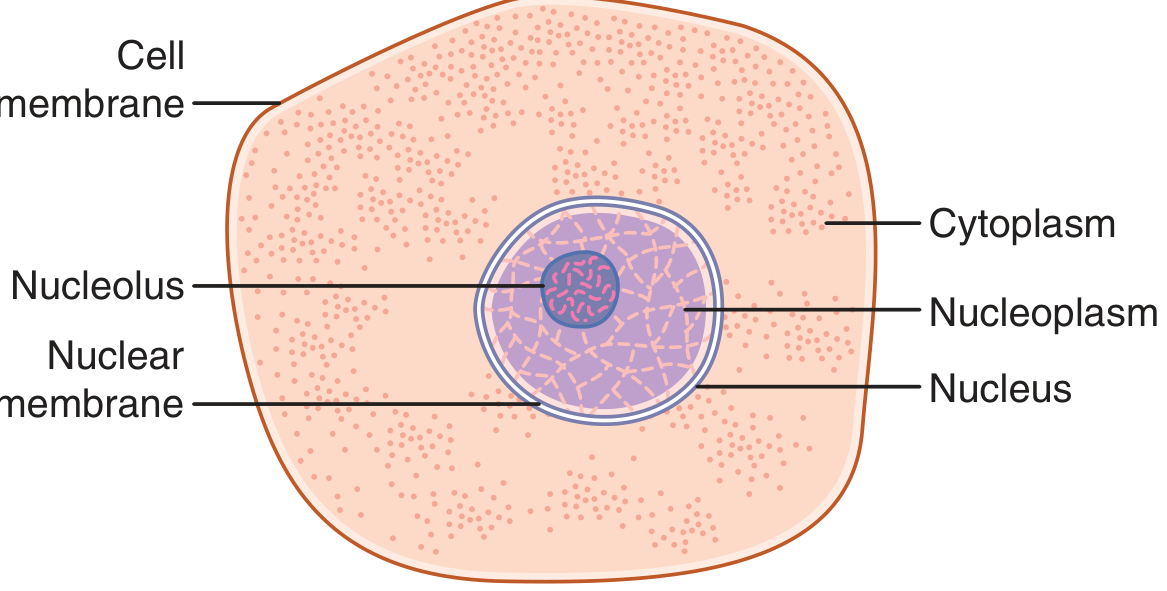
Key labels: Cell membrane, Cytoplasm, Nucleus, Nucleoplasm, Nucleolus, Nuclear membrane
The basic cell compartments as seen under light microscopy — what you can identify without electron microscopy.
Fig. 2.2 — Reconstruction of a Typical Cell (All Organelles)
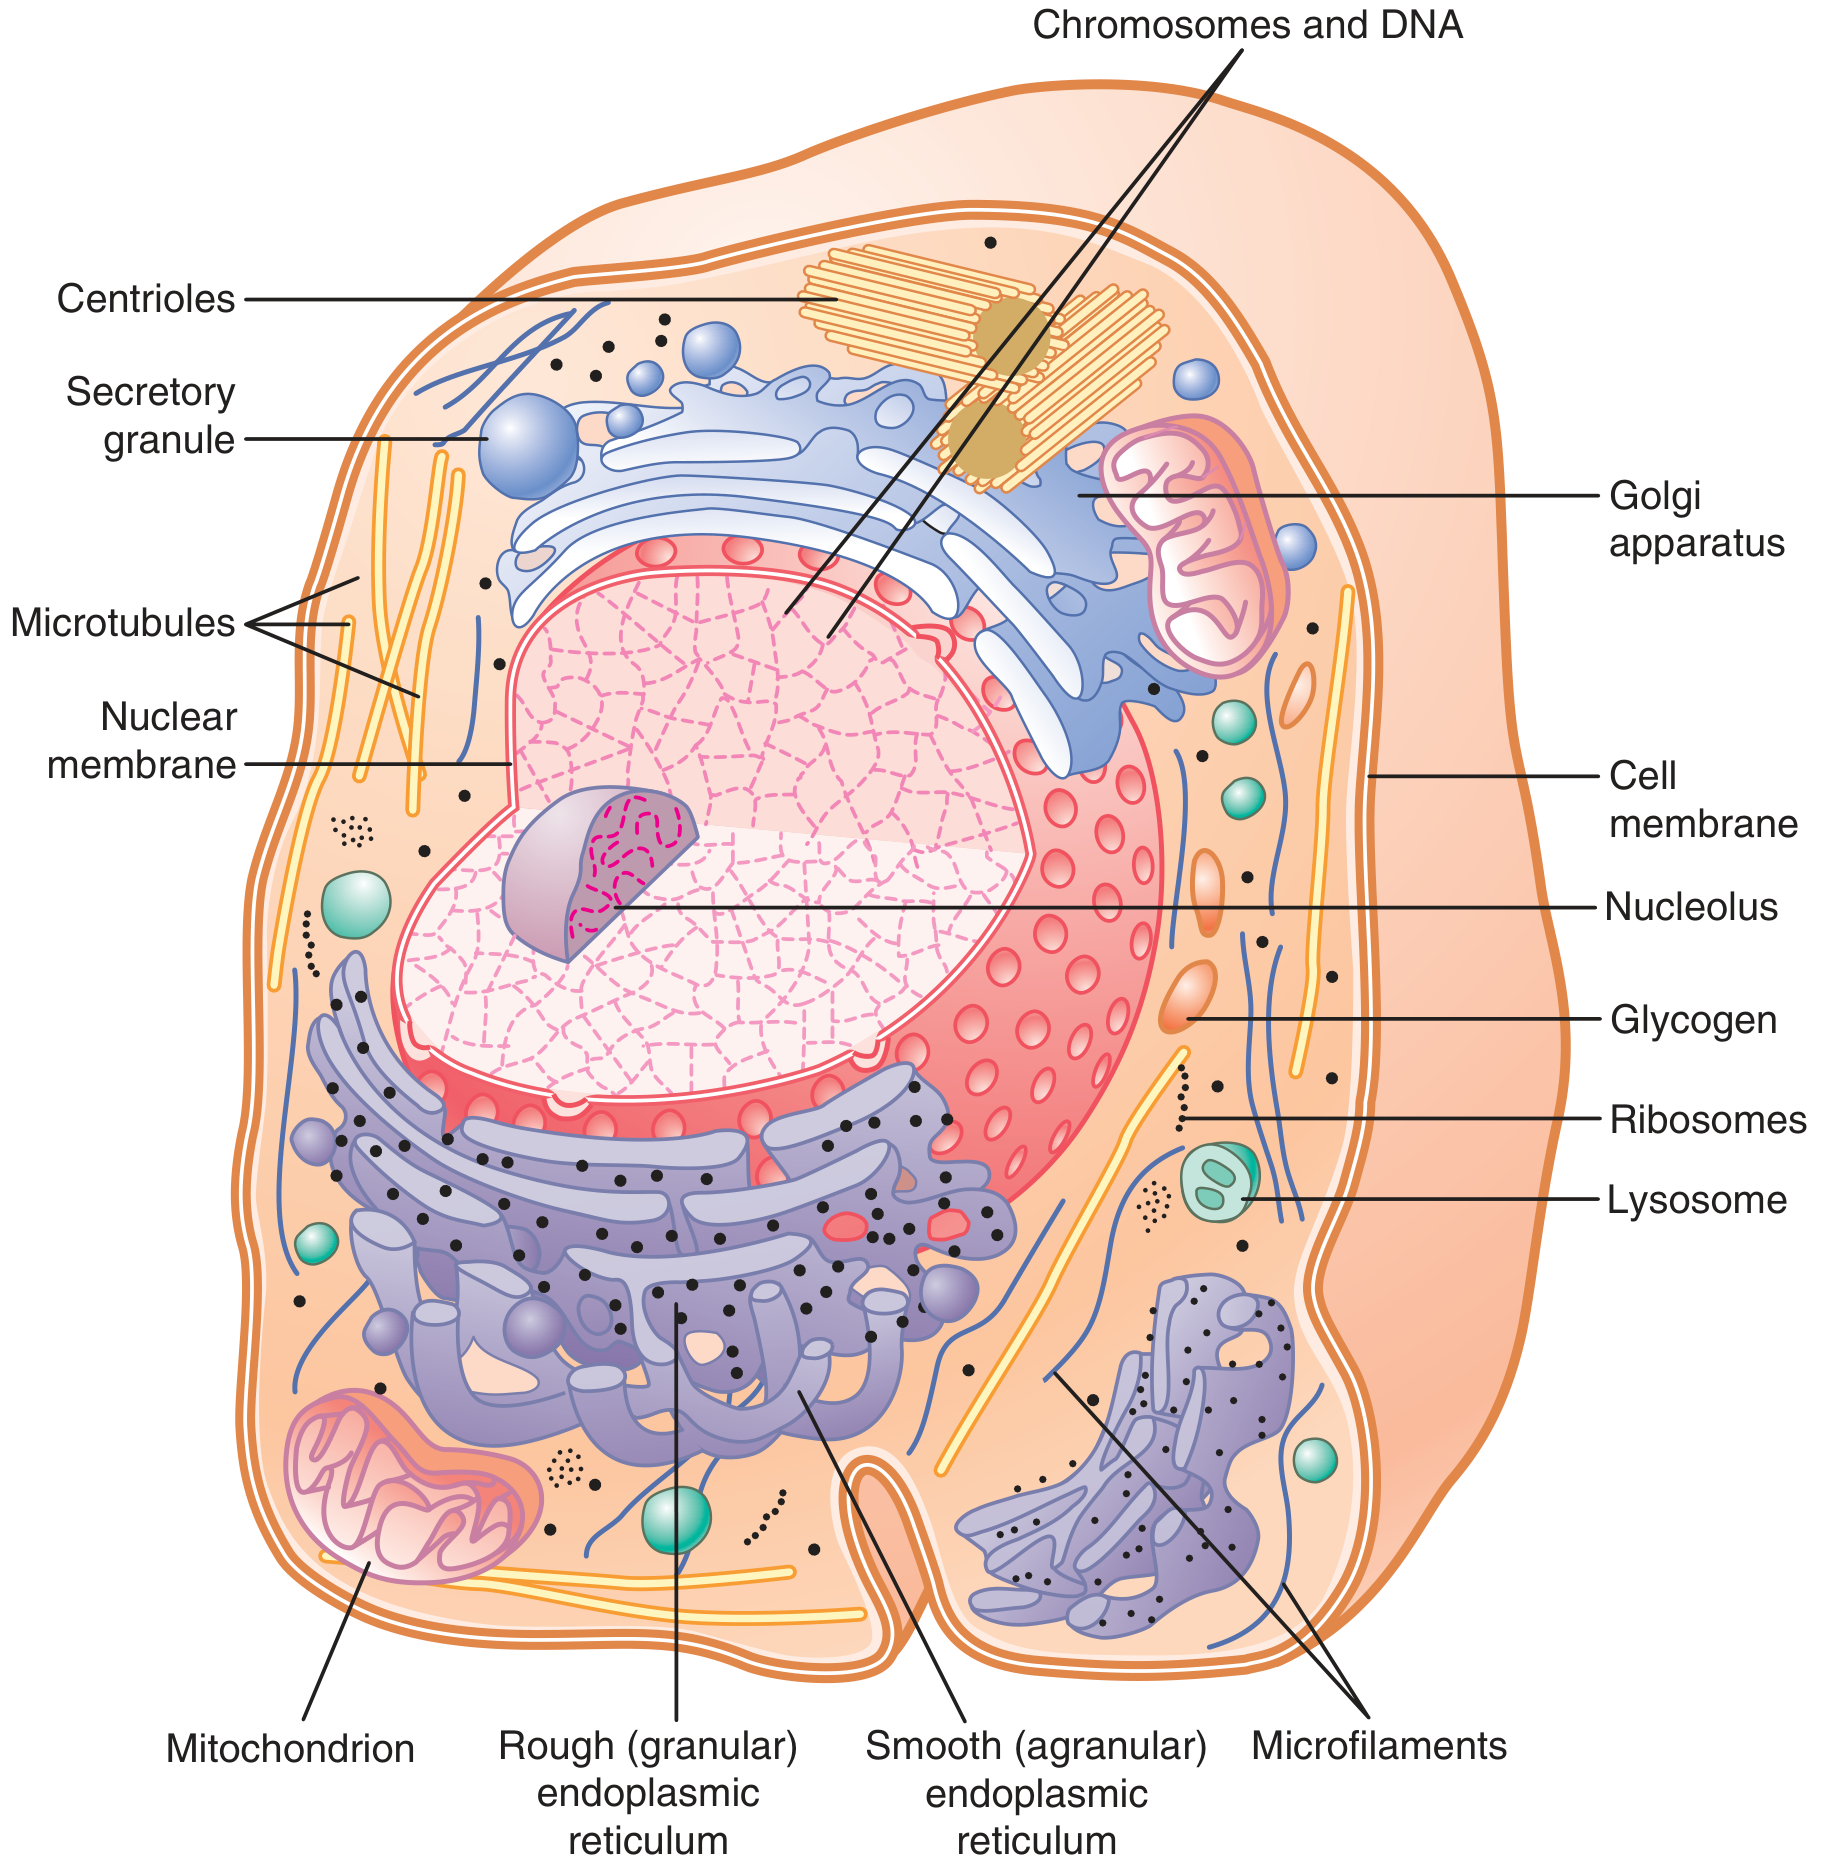
Key labels: Centrioles, Secretory granule, Microtubules, Nuclear membrane, Mitochondrion, Rough (granular) ER, Smooth (agranular) ER, Microfilaments, Golgi apparatus, Cell membrane, Nucleolus, Glycogen, Ribosomes, Lysosome, Chromosomes & DNA
The most important diagram of the chapter — master this and you know the layout of every organelle.
Fig. 2.3 — Structure of the Cell Membrane (Lipid Bilayer)
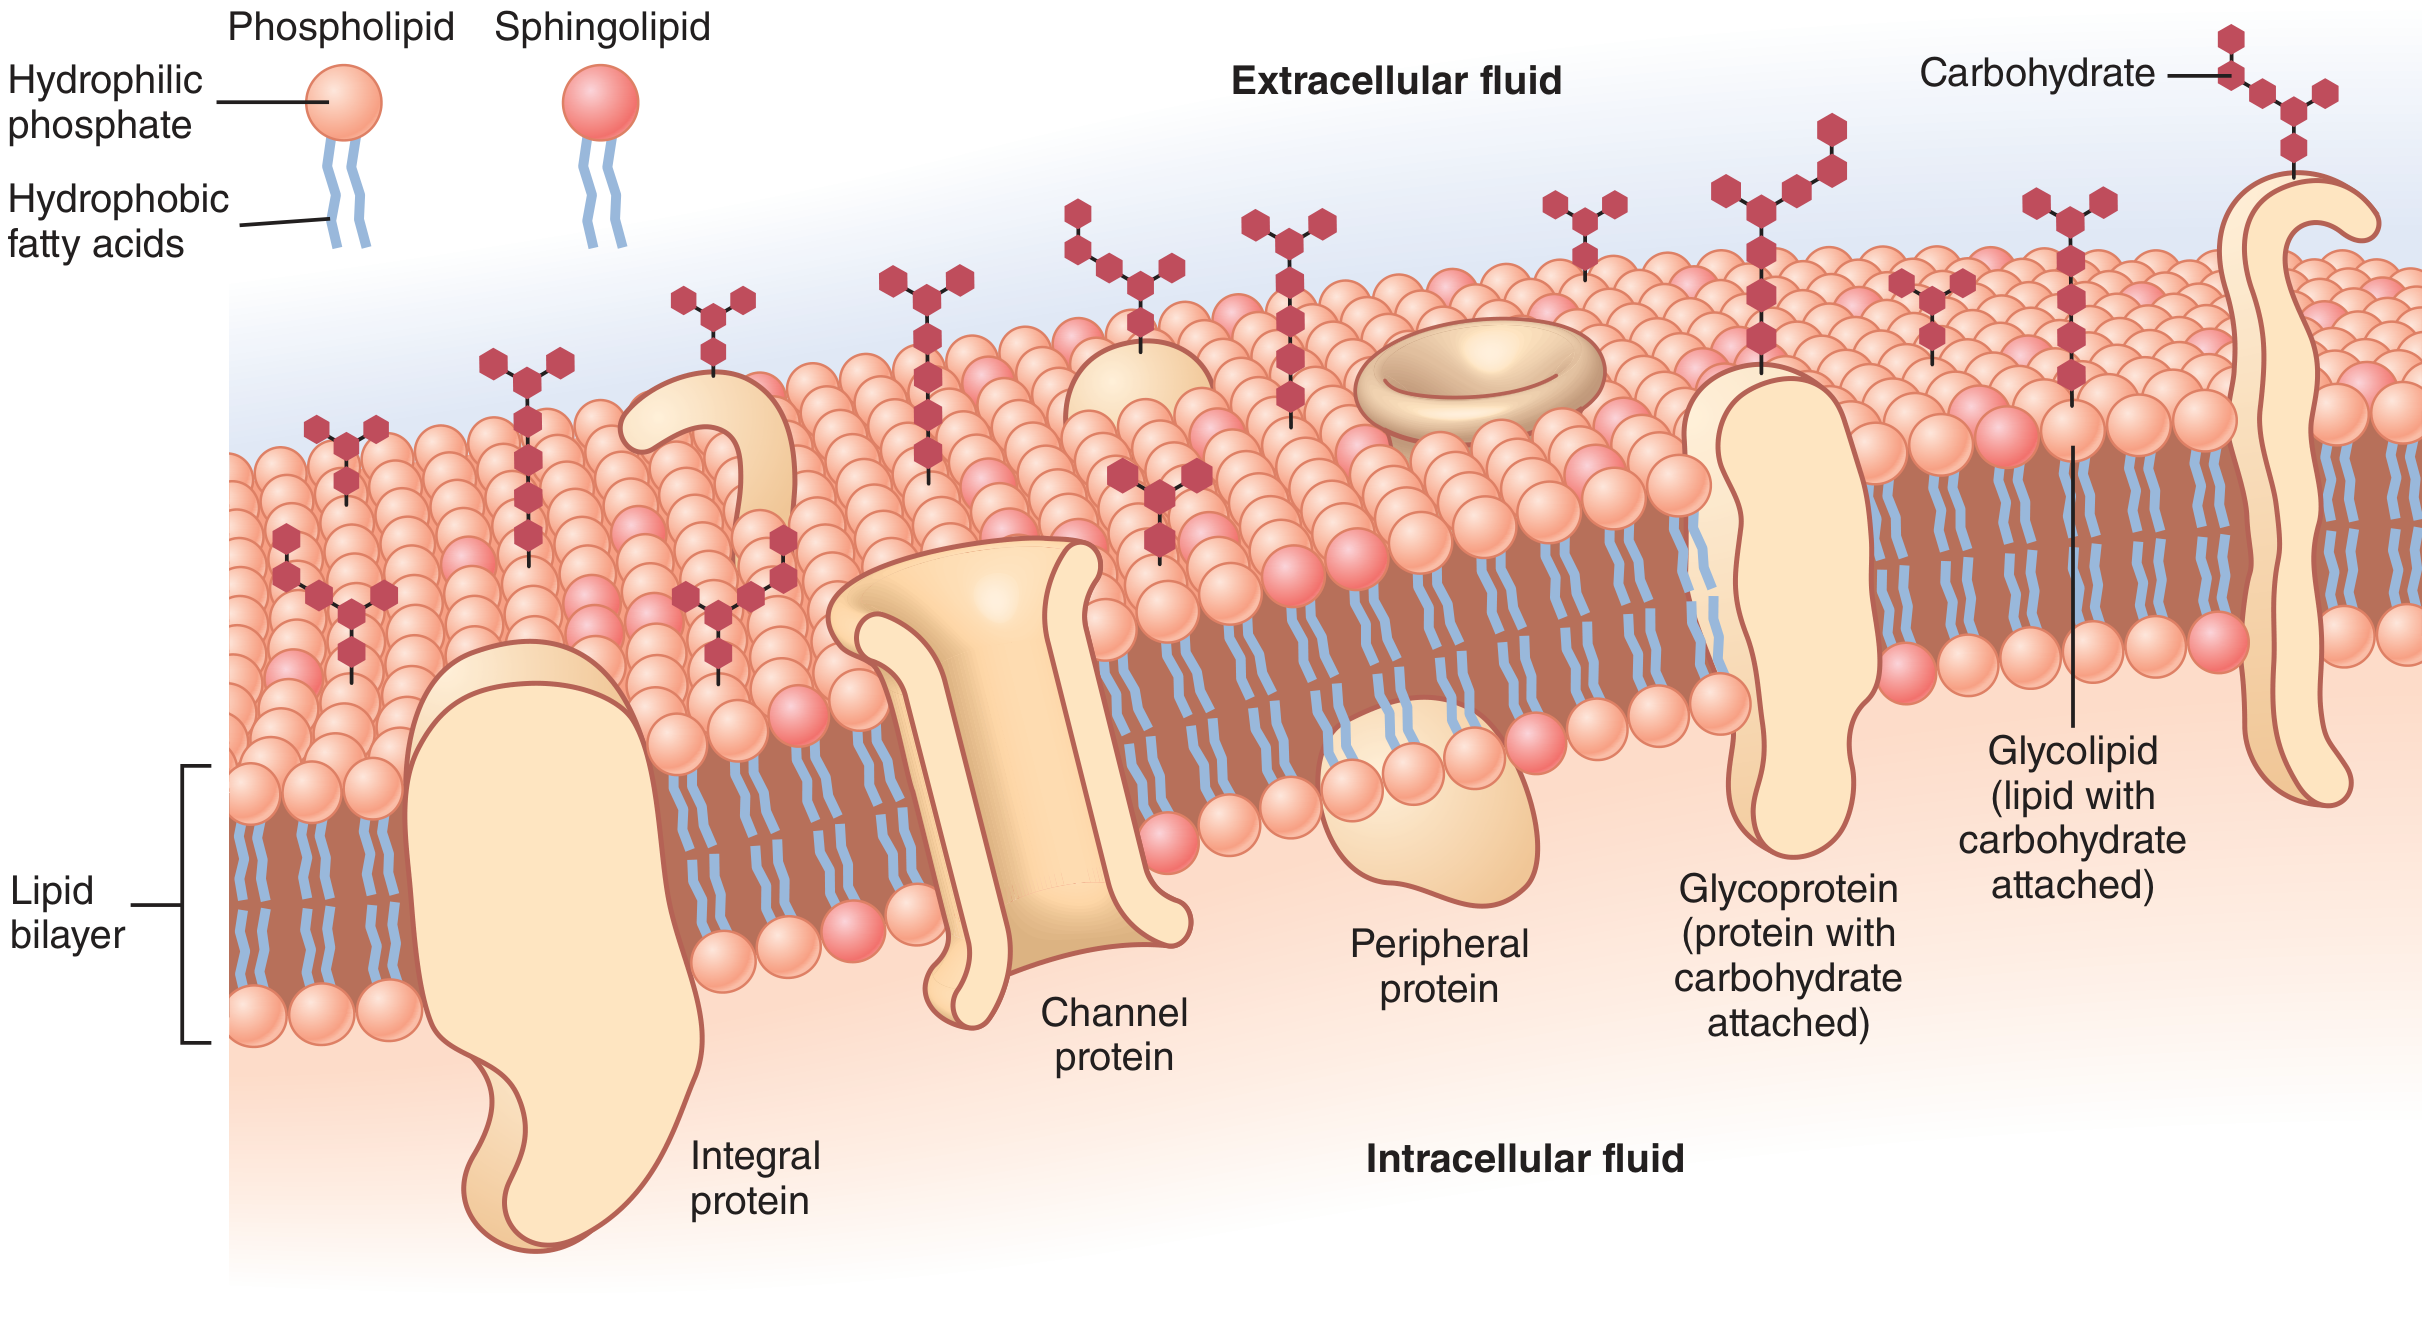
Key labels: Phospholipid (hydrophilic phosphate head + hydrophobic fatty acid tails), Sphingolipid, Lipid bilayer, Integral protein, Channel protein, Peripheral protein, Glycoprotein, Glycolipid, Extracellular fluid, Intracellular fluid, Carbohydrate branches (glycocalyx)
Shows the fluid mosaic model — phospholipid bilayer with embedded integral proteins, peripheral proteins, and carbohydrate coat on the outer surface.
Fig. 2.11 — Mechanism of Pinocytosis (A→B→C→D)
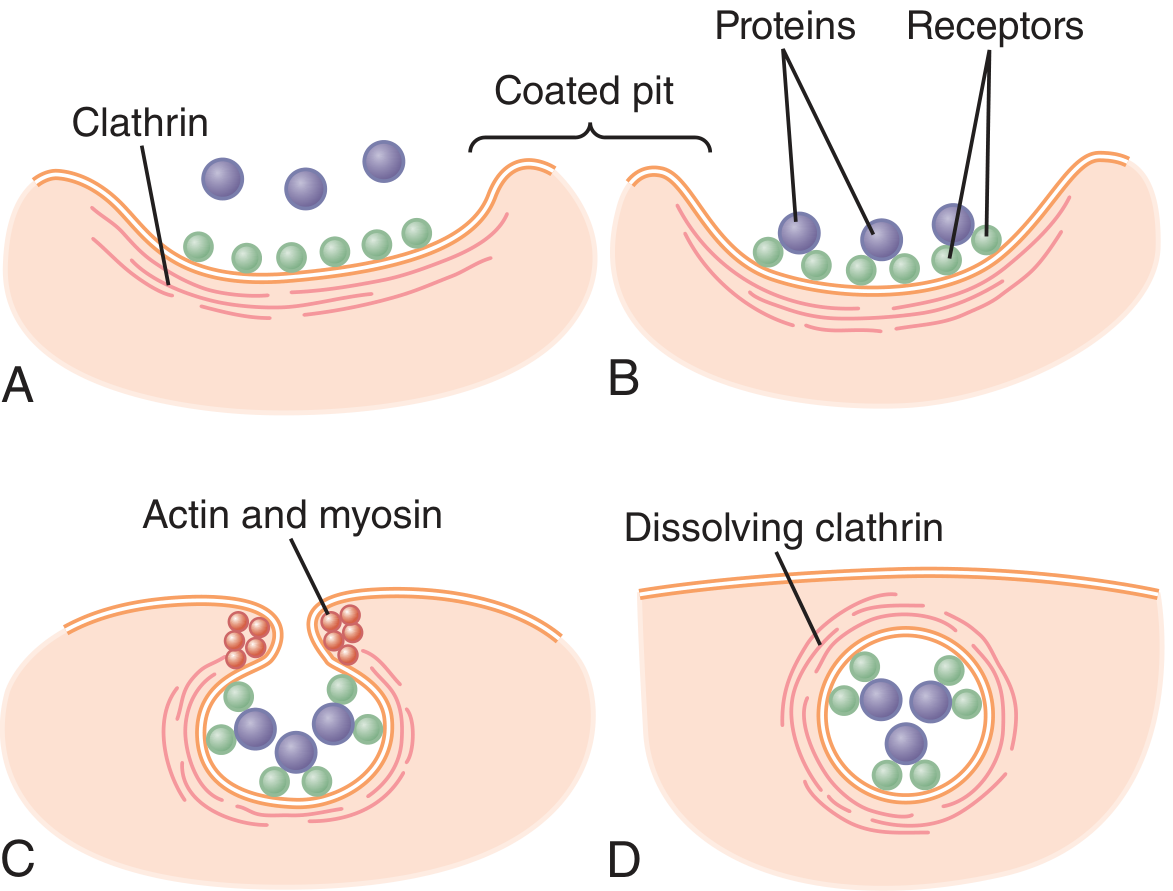
Steps shown:
- A — Coated pit forms; clathrin lines the inner membrane
- B — Proteins bind to receptors in the coated pit
- C — Actin and myosin pull the pit inward (invagination)
- D — Vesicle pinches off; clathrin begins dissolving → pinocytotic vesicle formed inside cytoplasm
Fig. 2.12 — Lysosomal Digestion of Pinocytotic/Phagocytic Vesicles
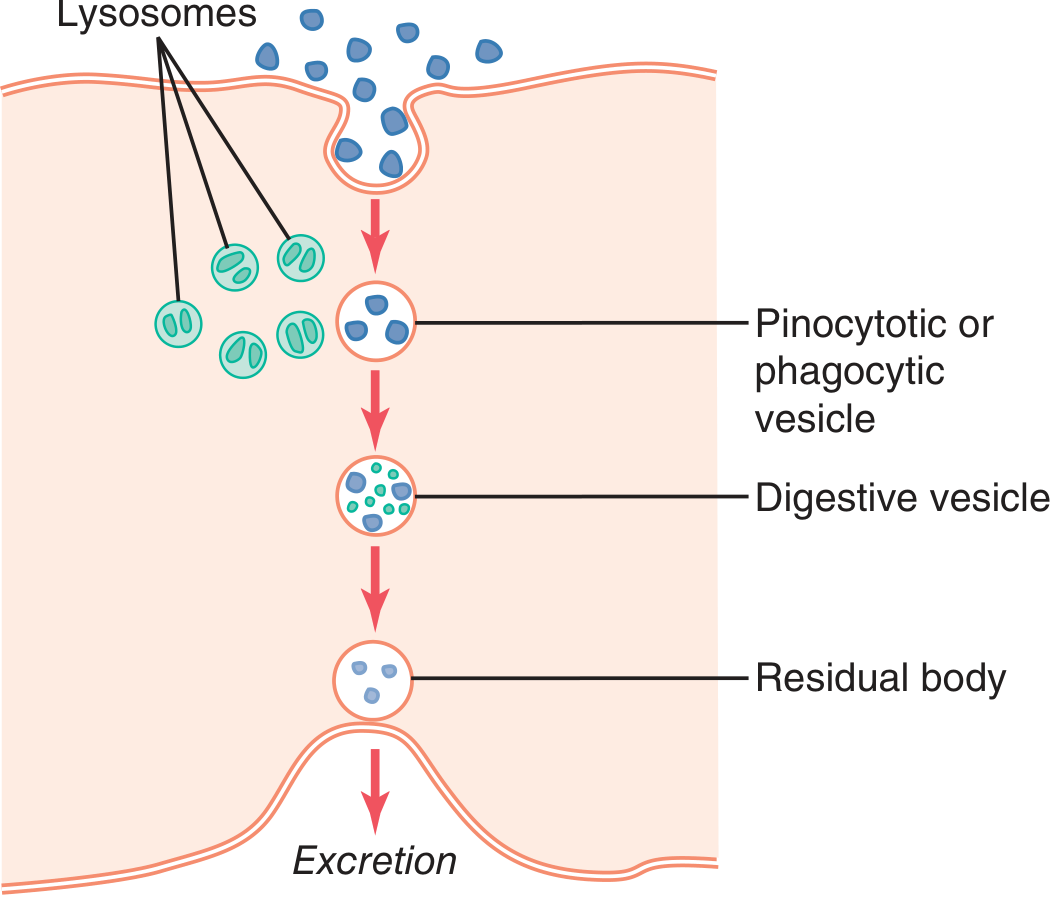
Sequence shown: Lysosomes → fuse with pinocytotic/phagocytic vesicle → Digestive vesicle (hydrolysis of contents) → Residual body (indigestible remains) → Exocytosis (excretion)
The complete intracellular digestion pathway from ingestion to excretion of waste.
Fig. 2.15 — ATP Formation in the Mitochondria
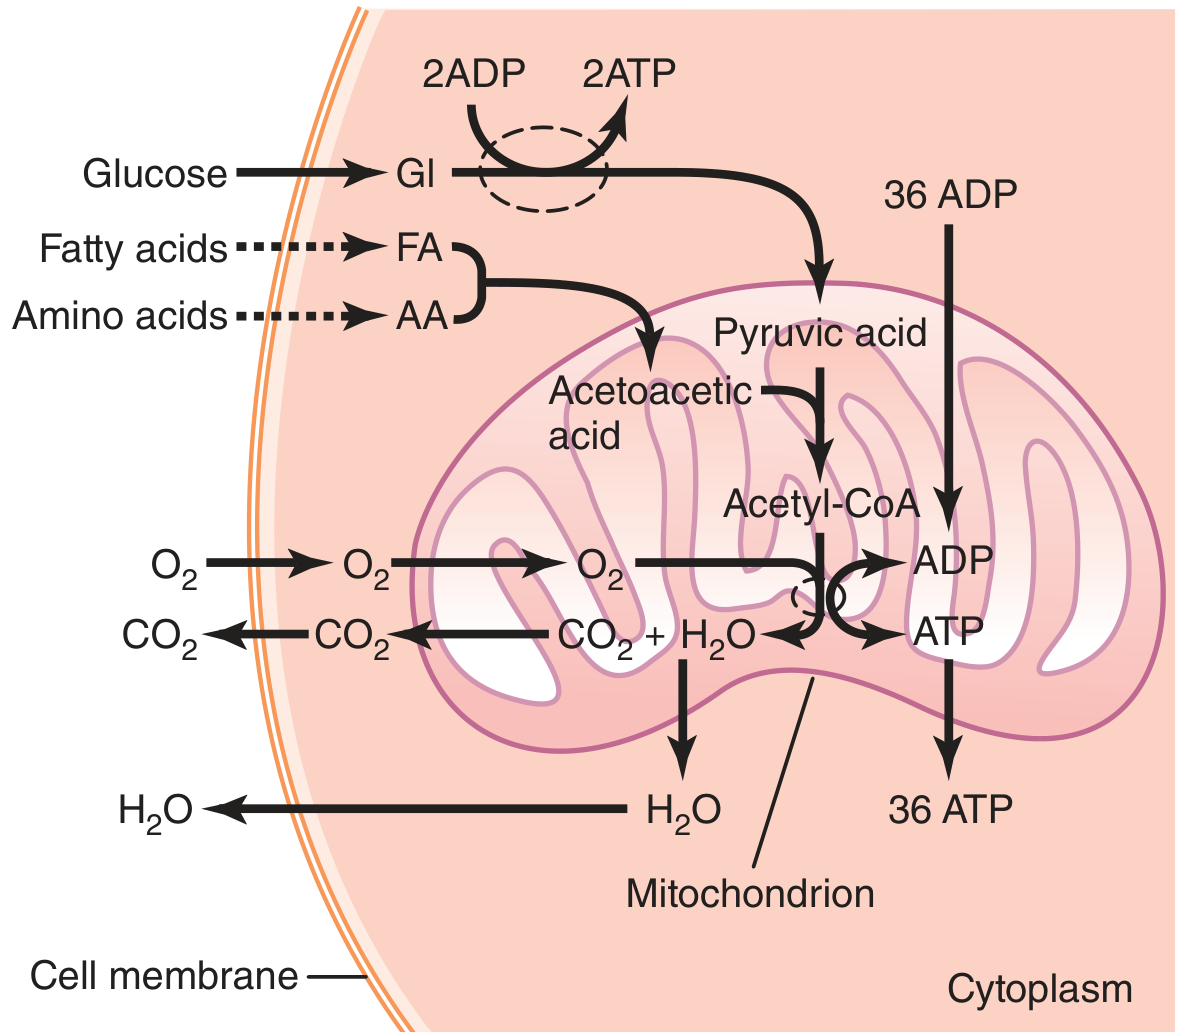
Key points shown:
- Glucose → glycolysis (cytoplasm) → 2 ATP + pyruvic acid
- Fatty acids + Amino acids → Acetoacetic acid → Acetyl-CoA
- Acetyl-CoA → mitochondria → Krebs cycle → 36 ATP
- O₂ enters mitochondria; CO₂ + H₂O produced as byproducts
- Total: 38 ATP per glucose molecule
Fig. 2.16 — Chemical Structure of Adenosine Triphosphate (ATP)
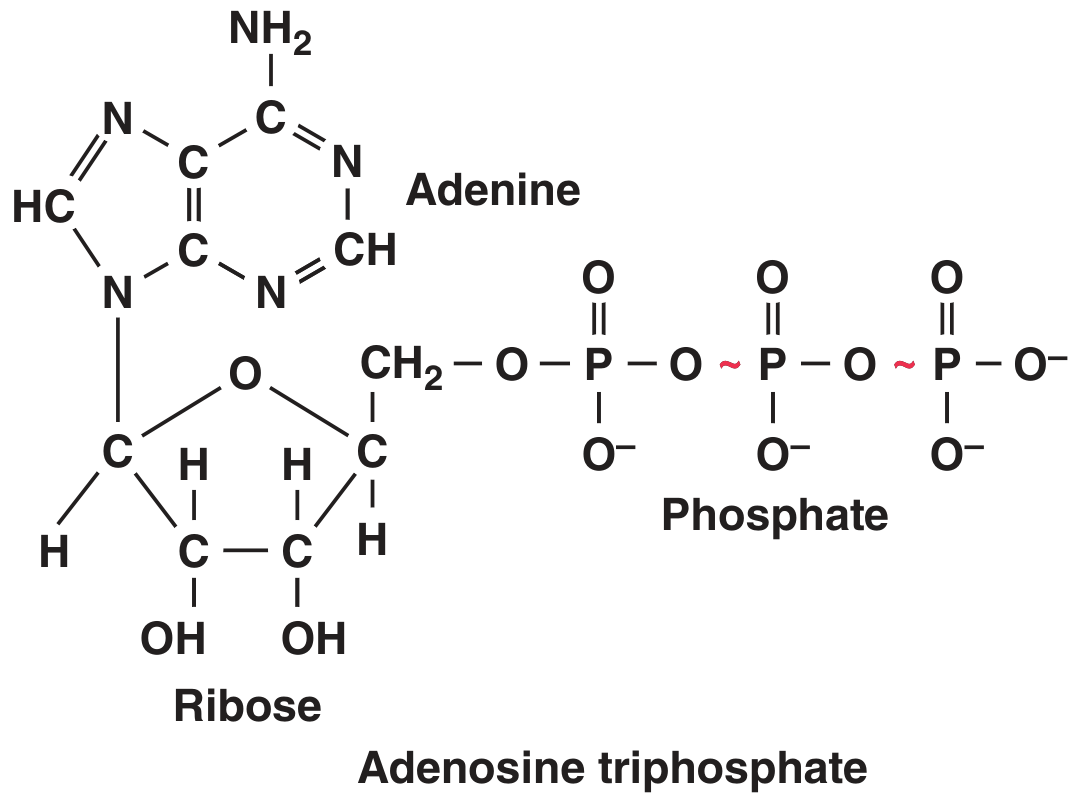
Structure: Adenine + Ribose + 3 Phosphate groups
- The ~ bonds (red wavy lines) between the last two phosphate groups = high-energy phosphate bonds (~7,300 cal/mol each)
- Hydrolysis of ATP → ADP + Pᵢ + usable energy for all cell work
Fig. 2.17 — Ameboid Movement of a Cell
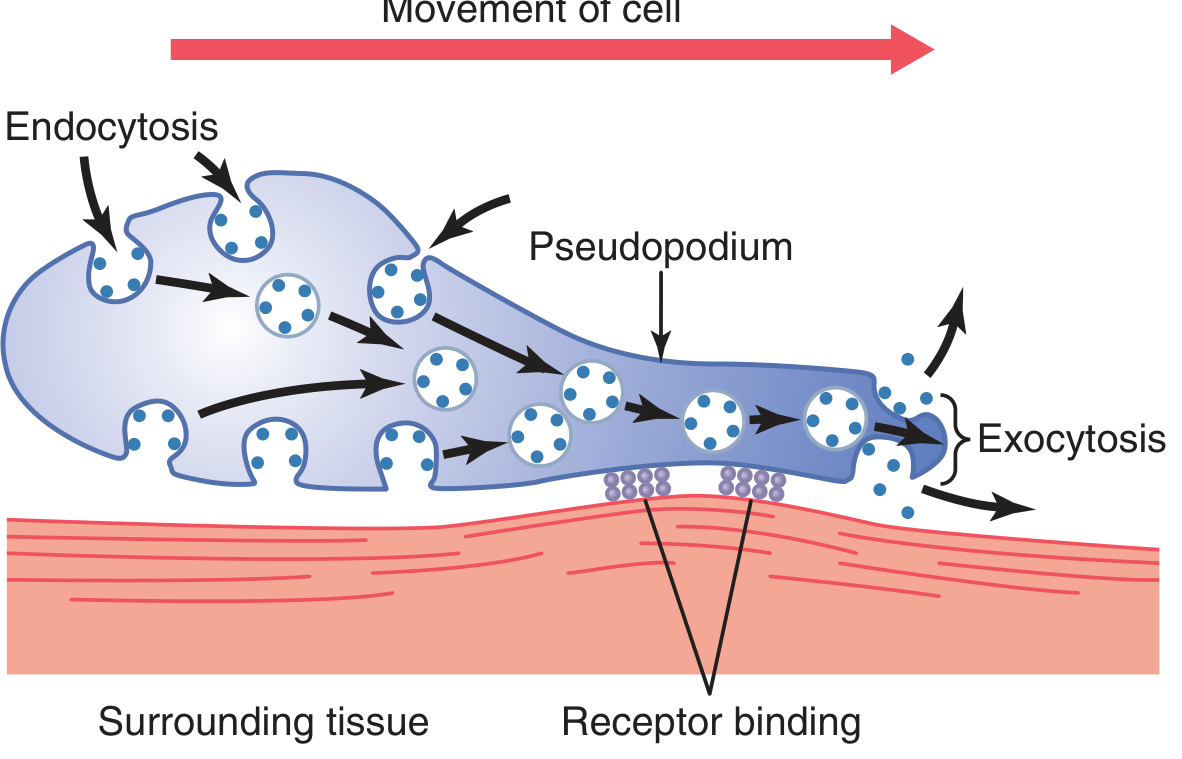
Key features shown:
- Cell moves in direction of pseudopodium (leading edge)
- Exocytosis at the leading pseudopodal tip → new membrane + receptor binding to surrounding tissue
- Endocytosis at the trailing end → vesicles stream forward to form new pseudopodal membrane
- Powered by actin-myosin + ATP
Fig. 2.18 — Structure and Function of the Cilium
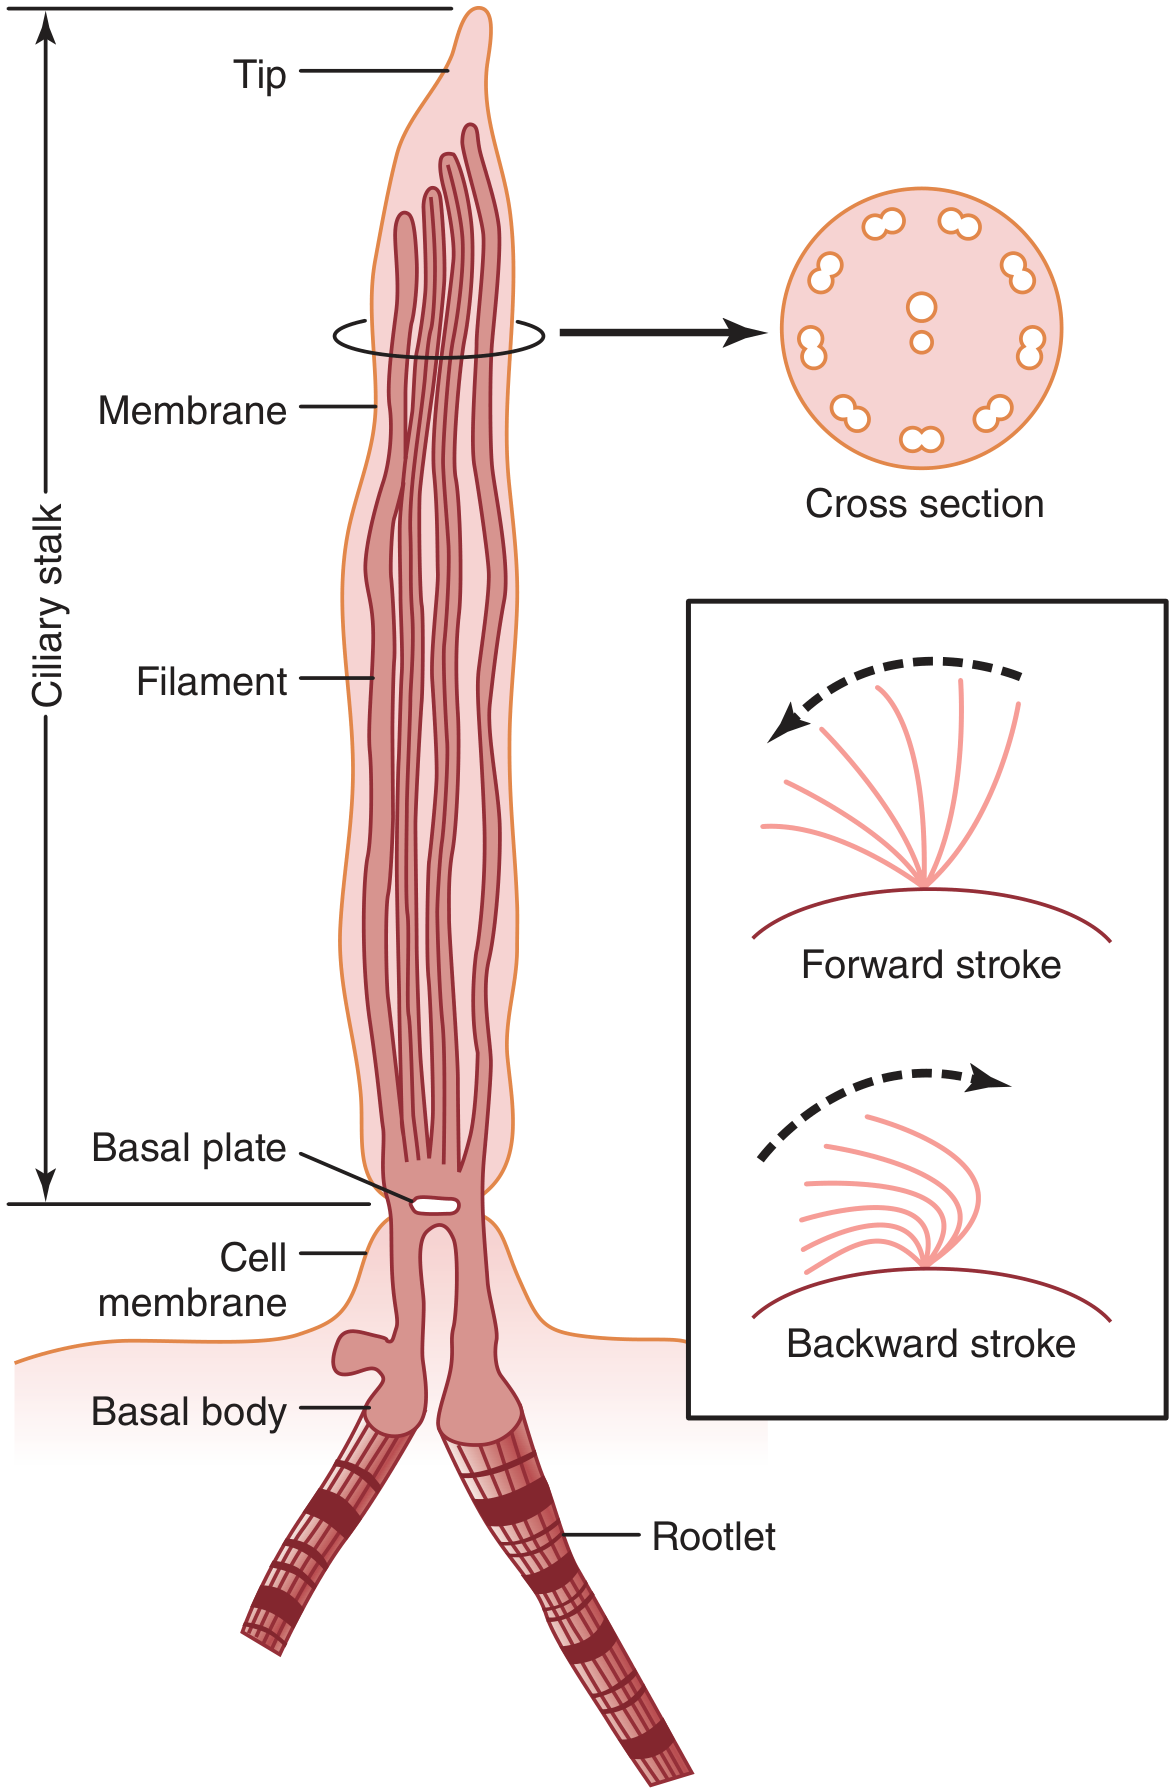
Key labels:
- Ciliary stalk with membrane, filaments (axoneme)
- Basal plate → anchors to cell membrane
- Basal body → origin of the cilium
- Rootlet → anchors into cytoplasm
- Cross section → 9 peripheral double tubules + 2 central single tubules = 9+2 arrangement
- Inset: Forward stroke (rapid, whiplike, propels fluid) vs. Backward stroke (slow, flexible, no fluid movement)
Total: 8 key diagrams from Chapter 2, covering cell structure, membrane, pinocytosis, lysosomal digestion, ATP synthesis, ATP structure, ameboid movement, and cilia — all directly from Guyton and Hall Textbook of Medical Physiology, 14th Ed.
This is a shared conversation. Sign in to Orris to start your own chat.