
Cellular response to injury and inflammation
leukocyte recruitment adhesion endothelium inflammation rolling
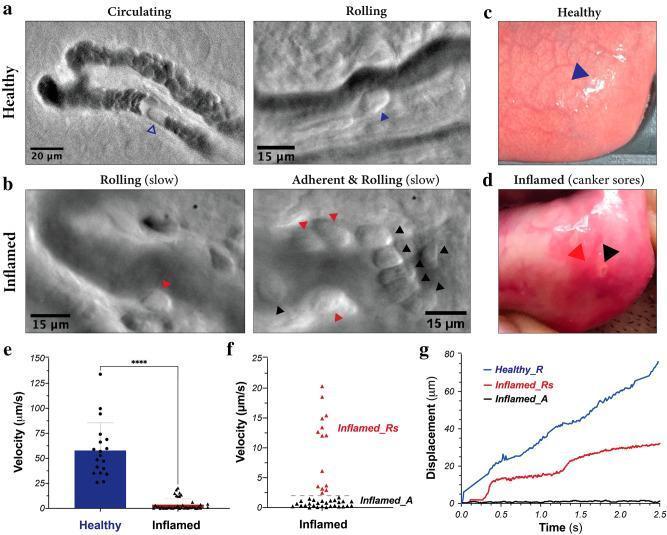
Educational panel illustrating in vivo leukocyte dynamics within human oral mucosa microvasculature under healthy and inflamed conditions, captured using oblique back-illumination microscopy (mOBM). Panels (a) and (c) depict healthy tissue with uniform mucosal appearance and leukocytes exhibiting normal circulation and rolling behavior (blue arrowheads). Panels (b) and (d) show inflamed tissue featuring a canker sore, characterized macroscopically by focal erythema and microscopically by slow-rolling (red arrowheads) and stationary, adherent leukocytes (black arrowheads) forming clusters along the endothelium. Quantitative analysis is provided in graphs (e-g): Panel (e) shows a significant reduction in mean leukocyte velocity in inflamed tissue (p < 0.0001); panel (f) distinguishes two subpopulations in inflammation—slow-rolling (Inflamed_Rs) and adherent (Inflamed_A); panel (g) tracks displacement over time, contrasting the continuous movement in healthy vessels against the 'stop-and-go' or near-zero displacement patterns in inflamed vessels. This content demonstrates the pathophysiological recruitment of leukocytes (tethering, rolling, and adhesion) during a localized inflammatory response.
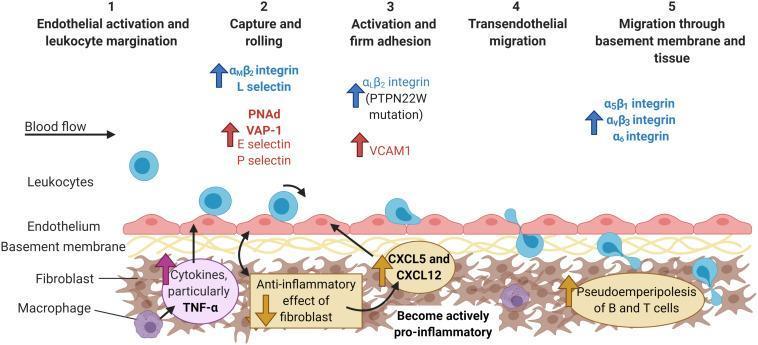
A pathophysiology diagram illustrating the multi-step leukocyte adhesion cascade in the context of chronic inflammatory arthritis. The diagram depicts five sequential stages: 1) Endothelial activation and leukocyte margination within blood flow; 2) Capture and rolling, mediated by αMβ2 integrin and L-selectin on leukocytes interacting with endothelial PNAd, VAP-1, and E/P-selectins; 3) Activation and firm adhesion, involving αLβ2 integrin (noting PTPN22W mutation) and VCAM1; 4) Transendothelial migration through the endothelial monolayer; and 5) Migration through the basement membrane and synovial tissue facilitated by α5β1, αvβ3, and α6 integrins. The model highlights the role of the inflammatory microenvironment, showing macrophages producing TNF-α and fibroblasts transitioning from an anti-inflammatory state to an actively pro-inflammatory state. This transition involves the shuttling of chemokines CXCL5 and CXCL12 to the endothelium. The final stage illustrates pseudoemperipolesis of B and T cells within the tissue stroma. This educational visual explains the cellular and molecular mechanisms of pathogenic leukocyte recruitment in rheumatoid and psoriatic arthritis.
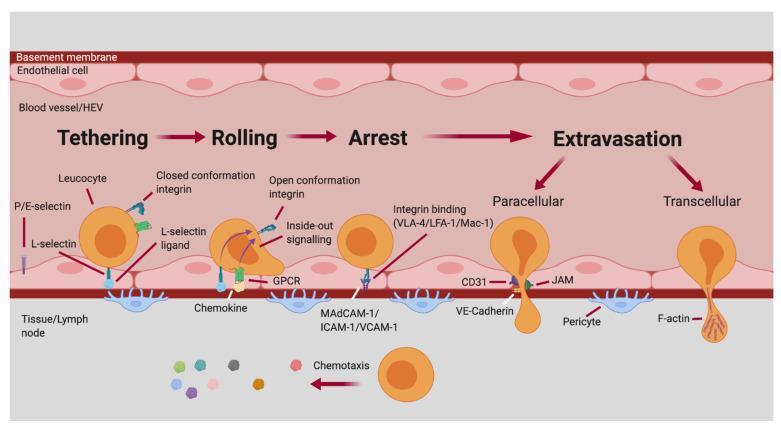
This pathophysiology diagram illustrates the sequential stages of the leukocyte adhesion cascade within a blood vessel or high endothelial venule (HEV). The process is divided into four main phases: Tethering, Rolling, Arrest, and Extravasation. 1. Tethering: Mediated by L-selectin and P/E-selectins interacting with their respective ligands. Leukocyte integrins are in a closed conformation. 2. Rolling: Leukocyte shape elongates as it interacts with chemokines via GPCRs. This triggers 'inside-out signaling,' shifting integrins to an open conformation. 3. Arrest: Firm adhesion is achieved through high-affinity integrin binding (VLA-4, LFA-1, Mac-1) to endothelial ligands (MAdCAM-1, ICAM-1, VCAM-1). 4. Extravasation: The leukocyte exits into the tissue/lymph node via two pathways: Paracellular migration (between endothelial cells, involving CD31, JAM, and VE-Cadherin) or Transcellular migration (through the endothelial cell, involving F-actin). The diagram concludes with the leukocyte passing the basement membrane and pericytes, directed by chemotaxis. This visual is designed for advanced immunology and medical students to understand cellular recruitment during inflammation or immune surveillance.
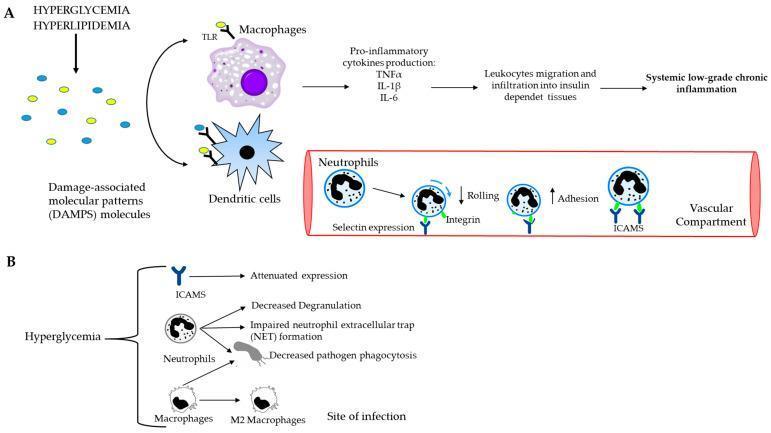
A two-part medical pathophysiology diagram illustrating the link between metabolic dysfunction and systemic inflammation. Part A depicts the cascade where hyperglycemia and hyperlipidemia generate Damage-Associated Molecular Patterns (DAMPs). These molecules bind to Toll-like receptors (TLRs) on macrophages and dendritic cells, triggering the release of pro-inflammatory cytokines (TNFͱ, IL-1̢, IL-6). This lead to leukocyte migration into insulin-dependent tissues and systemic low-grade chronic inflammation. An inset showing the vascular compartment details the neutrophil recruitment process, highlighting decreased rolling (mediated by selectin) and increased adhesion (mediated by integrins and ICAMs). Part B focuses on the cellular impact of hyperglycemia, showing attenuated ICAM expression, decreased neutrophil degranulation, impaired Neutrophil Extracellular Trap (NET) formation, and decreased phagocytosis by neutrophils and macrophages. It also notes the transition of macrophages to the M2 phenotype at sites of infection. This diagram is designed for advanced medical education regarding the immunology of metabolic diseases like diabetes and obesity.
arachidonic acid metabolites prostaglandins leukotrienes inflammation pathway
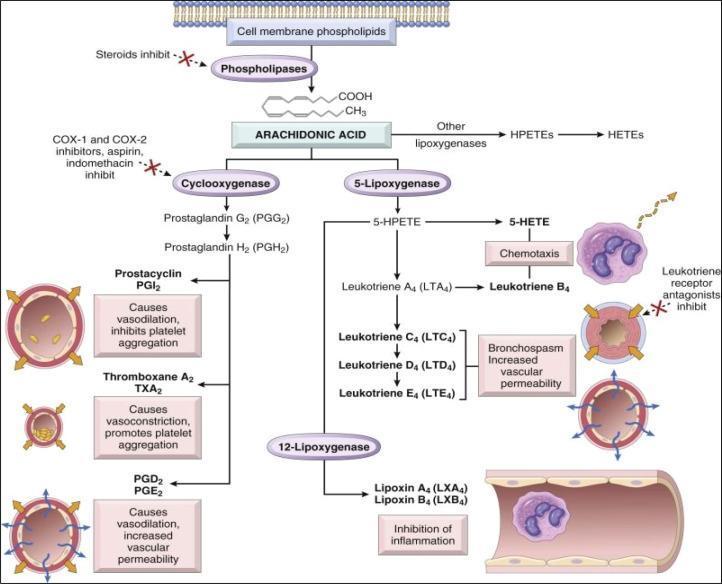
This pathophysiology diagram illustrates the arachidonic acid (AA) metabolic pathway and its role in the inflammatory response. The process begins with cell membrane phospholipids, which are converted into AA by phospholipases; this step is inhibited by steroids. AA then follows two primary enzymatic pathways: the Cyclooxygenase (COX) and Lipoxygenase (LOX) pathways. The COX pathway, inhibited by aspirin and NSAIDs, produces Prostaglandins G2 and H2, leading to Prostacyclin (PGI2, causing vasodilation and anti-aggregation), Thromboxane A2 (TXA2, causing vasoconstriction and aggregation), and PGD2/PGE2 (promoting vascular permeability). The LOX pathway includes 5-LOX, which produces Leukotriene B4 (mediating chemotaxis) and Leukotrienes C4, D4, and E4 (causing bronchospasm and increased vascular permeability), and 12-LOX, which produces Lipoxins A4 and B4 for the inhibition of inflammation. Visual icons include blood vessels and airway cross-sections to demonstrate physiological effects like vasodilation, vasoconstriction, and bronchoconstriction. The diagram serves as a key educational tool for understanding eicosanoid pharmacology and inflammation.
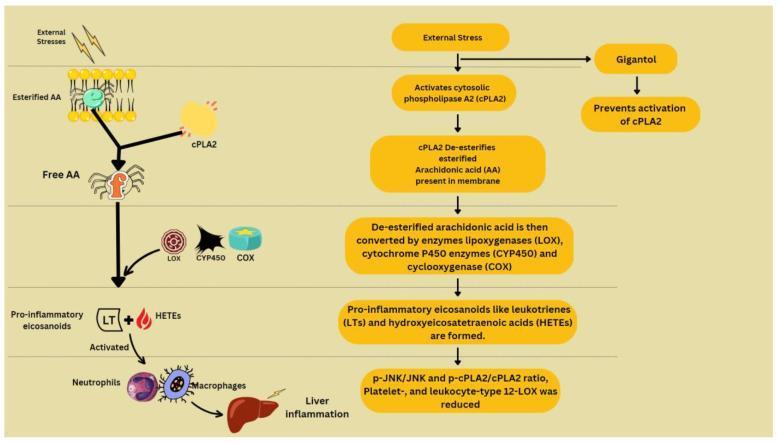
This pathophysiology diagram illustrates the arachidonic acid (AA) metabolism pathway and its contribution to liver inflammation, alongside the inhibitory effect of gigantol. The flowchart is organized in a top-down hierarchical sequence. At the start, 'External Stresses' activate cytosolic phospholipase A2 (cPLA2), which de-esterifies 'Esterified AA' embedded within the cell membrane. This release produces 'Free AA'. The diagram depicts the subsequent conversion of free AA by three key enzymatic groups: lipoxygenases (LOX), cytochrome P450 enzymes (CYP450), and cyclooxygenase (COX). These enzymatic reactions generate pro-inflammatory eicosanoids, specifically leukotrienes (LTs) and hydroxyeicosatetraenoic acids (HETEs). These mediators lead to the activation of neutrophils and macrophages, resulting in liver inflammation. A parallel branch shows that the compound Gigantol acts to prevent the activation of cPLA2, thereby mitigating the inflammatory cascade. The visual features icons representing molecular structures, stylized enzymes, and anatomical liver sketches to reinforce the clinical relevance of lipid signaling in hepatology and immunology.
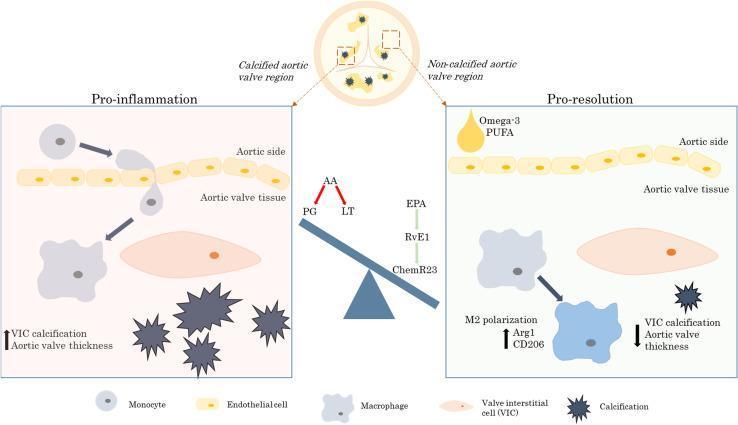
This pathophysiology diagram illustrates the cellular and molecular mechanisms of aortic valve stenosis, specifically contrasting 'Pro-inflammation' and 'Pro-resolution' pathways. The central overview shows a cross-section of an aortic valve with highlighted calcified and non-calcified regions. In the 'Pro-inflammation' panel, the diagram depicts monocyte transendothelial migration from the aortic side into the valve tissue, where they differentiate into macrophages that interact with valvular interstitial cells (VICs). This state is characterized by increased VIC calcification (shown as dark starburst shapes) and increased aortic valve thickness, driven by arachidonic acid (AA) metabolites like prostaglandins (PG) and leukotrienes (LT). Conversely, the 'Pro-resolution' panel demonstrates the therapeutic signaling axis involving Omega-3 polyunsaturated fatty acids (PUFA), eicosapentaenoic acid (EPA), resolvin E1 (RvE1), and the ChemR23 receptor. This axis promotes M2 macrophage polarization (marked by Arg1 and CD206), leading to a reduction in VIC calcification and valve thickness. The visual comparison highlights the role of specialized pro-resolving mediators in mitigating valvular disease progression by shifting the balance away from inflammatory lipid mediators.
Cellular Response to Injury and Inflammation
Overview
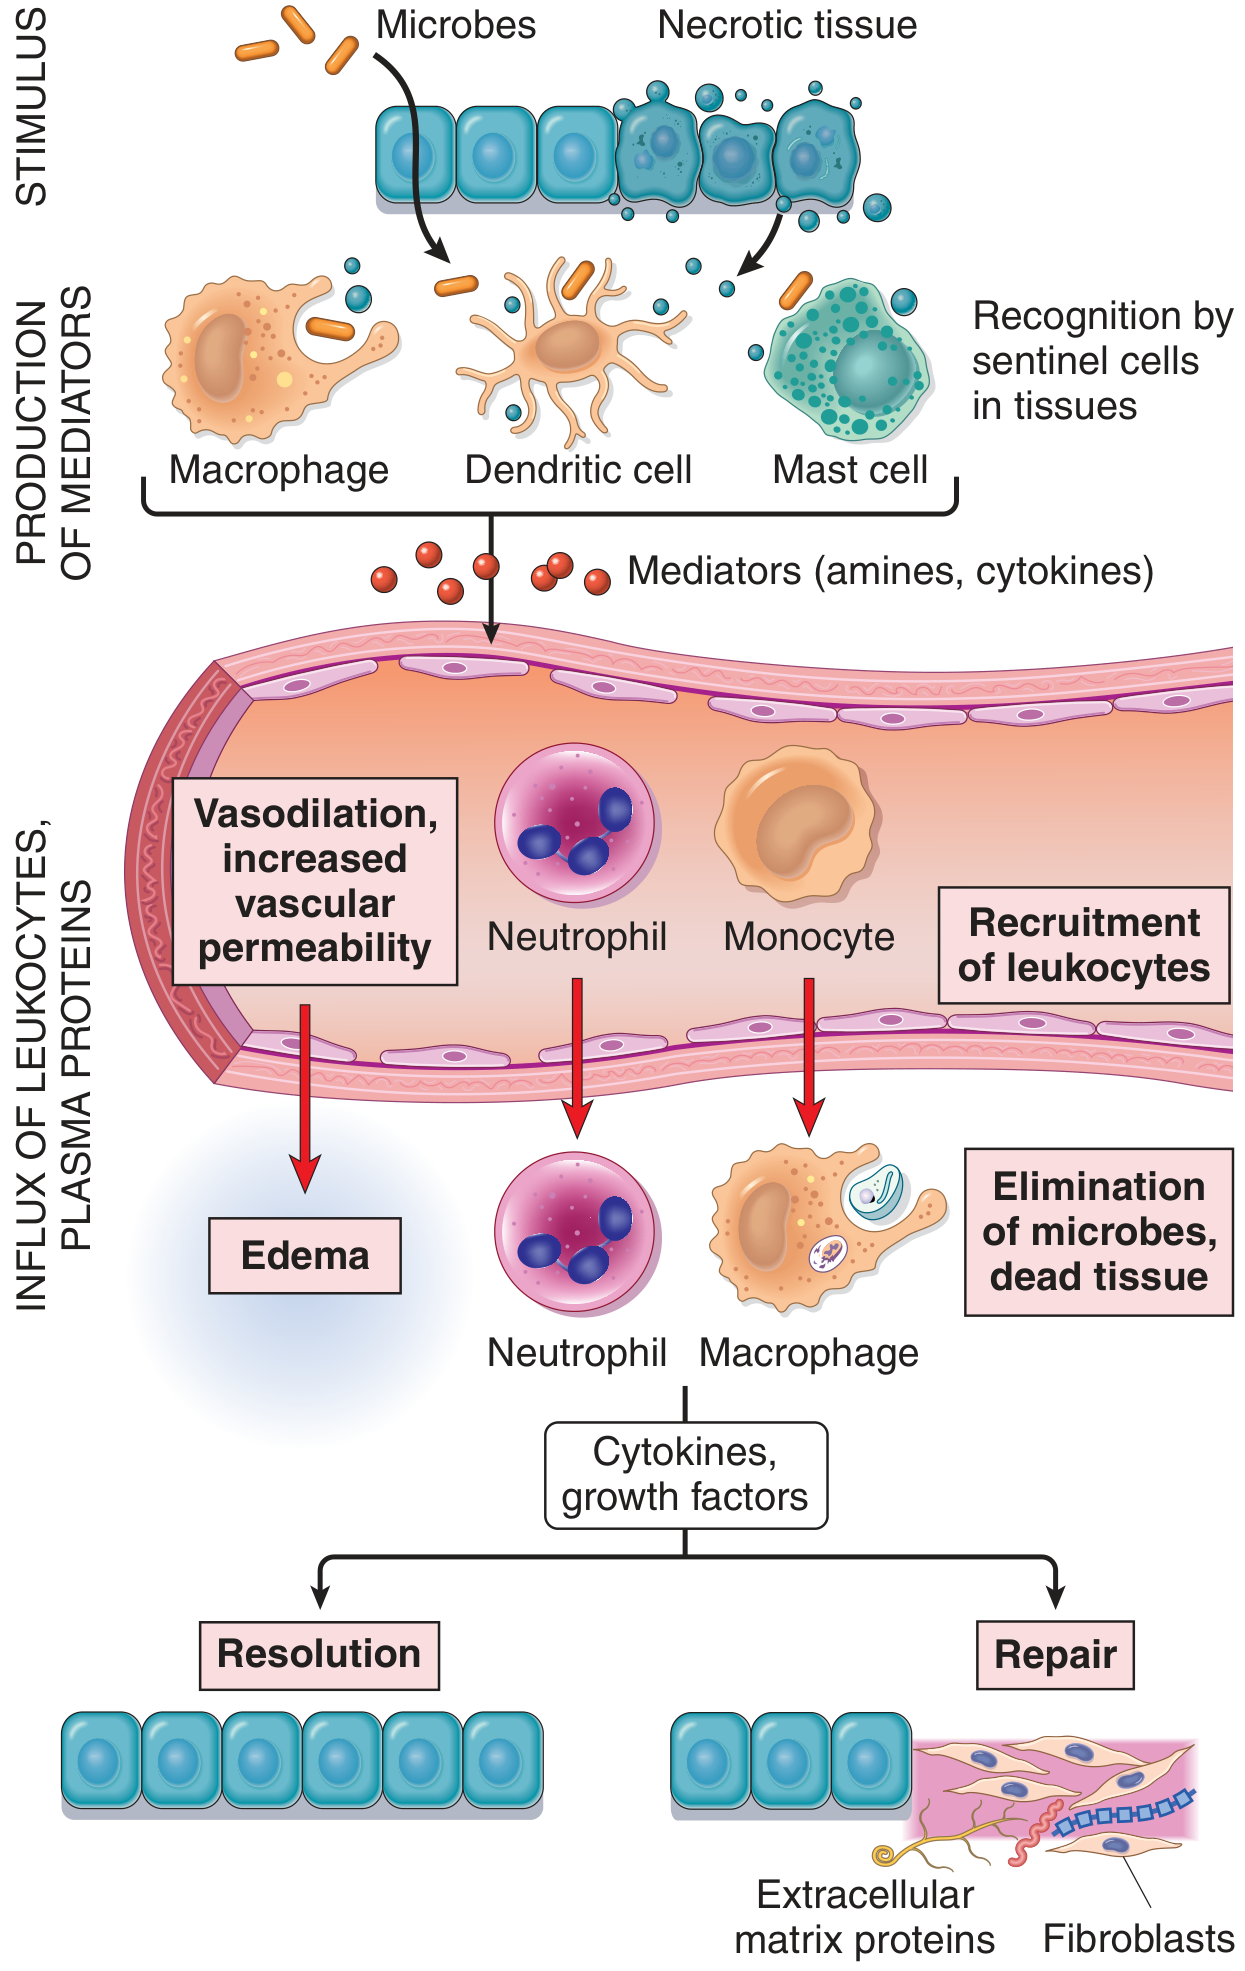
- Recognition of the offending agent
- Recruitment of blood cells and proteins to the tissue site
- Removal of the offending agent
- Regulation of the response
- Resolution (repair of damaged tissue)
Acute vs. Chronic Inflammation
| Feature | Acute Inflammation | Chronic Inflammation |
|---|---|---|
| Onset | Fast: minutes to hours | Slow: days |
| Cellular infiltrate | Mainly neutrophils | Monocytes/macrophages and lymphocytes |
| Tissue injury | Usually mild and self-limited | May be significant |
| Fibrosis | None | May be severe and progressive |
| Local and systemic signs | Prominent | Variable, usually modest |
- Calor (heat)
- Rubor (redness)
- Tumor (swelling)
- Dolor (pain)
- Functio laesa (loss of function)
1. Recognition of the Offending Agent
- PAMPs (Pathogen-Associated Molecular Patterns) - conserved microbial structures such as LPS, flagellin, and bacterial DNA
- DAMPs (Damage-Associated Molecular Patterns) - endogenous molecules released from necrotic cells (e.g., ATP, HMGB1, uric acid, DNA)
2. Vascular Reactions in Acute Inflammation
Changes in Vascular Flow and Caliber
- Transient vasoconstriction (seconds)
- Vasodilation - first arterioles, then capillaries → increased blood flow → heat and redness
- Slowing of circulation - increased vascular permeability leads to protein-rich fluid exiting → blood becomes more viscous → stasis
- Margination - leukocytes accumulate along the vessel wall
Increased Vascular Permeability (Edema)
- Immediate transient response: histamine and serotonin from mast cells; primarily venules
- Delayed prolonged response: cytokines (TNF, IL-1) cause structural reorganization; can affect venules and capillaries
- Direct endothelial injury: burns, severe infections causing immediate necrosis
- Increased transcytosis: vesicular transport increased by VEGF
3. Leukocyte Recruitment
Step 1: Margination and Rolling
- As blood flow slows and leukocytes marginalize, they begin loosely rolling along endothelium
- Mediated by selectins: E-selectin and P-selectin on endothelium bind sialyl-Lewis X ligands on leukocytes; L-selectin on leukocytes binds endothelial ligands
Step 2: Firm Adhesion (Arrest)
- Chemokines (particularly IL-8/CXCL8) presented on the endothelial surface trigger integrin activation on rolling leukocytes (inside-out signaling)
- Leukocyte integrins LFA-1 (CD11a/CD18) and Mac-1 (CD11b/CD18) bind to ICAM-1 on endothelium with high affinity → firm adhesion
Step 3: Transmigration (Diapedesis)
- Leukocytes squeeze through interendothelial junctions (mainly venules)
- Driven by PECAM-1 (CD31), JAM proteins, and VE-cadherin remodeling
- After crossing the endothelium, leukocytes pierce the basement membrane using matrix metalloproteinases (MMPs)
Step 4: Chemotaxis
- Leukocytes migrate directionally toward the highest concentration of chemoattractants:
- Bacterial products (N-formylmethionyl peptides)
- Complement fragment C5a
- Leukotriene B4 (LTB4)
- Chemokines (e.g., CXCL8/IL-8 for neutrophils; CCL2/MCP-1 for monocytes)
- Binding to G-protein-coupled receptors triggers cytoskeletal assembly (pseudopods) and directed locomotion
4. Phagocytosis and Microbial Killing
Phagocytosis
- Recognition and attachment: direct binding of leukocyte PRRs to microbes, or via opsonins - IgG (Fc receptors) and C3b (complement receptors)
- Engulfment: pseudopods extend and fuse around the particle → phagosome formation → fuses with lysosome → phagolysosome
- Killing and degradation
Intracellular Killing - Two Major Systems
- Activation of NADPH oxidase → respiratory burst → superoxide (O₂⁻) → hydrogen peroxide (H₂O₂)
- Myeloperoxidase (MPO) converts H₂O₂ + Cl⁻ → hypochlorous acid (HOCl) - the most potent bactericidal agent
- Nitric oxide synthase (iNOS) generates NO in macrophages; reacts with superoxide → peroxynitrite (ONOO⁻)
- Bactericidal permeability increasing protein (BPI): disrupts outer membrane of gram-negative bacteria
- Lysozyme: degrades bacterial cell walls
- Lactoferrin: chelates iron needed for bacterial growth
- Defensins: cationic peptides that create pores in microbial membranes
- Acid hydrolases in lysosomes degrade dead organisms
Neutrophil Extracellular Traps (NETs)
5. Mediators of Inflammation
Vasoactive Amines
| Mediator | Source | Actions |
|---|---|---|
| Histamine | Mast cells, basophils, platelets | Vasodilation, increased vascular permeability, early response |
| Serotonin (5-HT) | Platelets | Similar to histamine |
Arachidonic Acid Metabolites (Eicosanoids)
- Prostaglandins (PGE₂, PGD₂, PGI₂): vasodilation, increased permeability, fever, pain sensitization
- Thromboxane A₂ (TXA₂): vasoconstriction and platelet aggregation
- Prostacyclin (PGI₂): vasodilation and inhibits platelet aggregation
- Leukotriene B₄ (LTB₄): potent chemotactic agent; activates neutrophils
- Leukotrienes C₄, D₄, E₄ (cysteinyl leukotrienes): increased vascular permeability, bronchospasm (key mediators of asthma)
- Lipoxins: generated from AA by 12-LOX and 5-LOX in sequence; inhibit inflammation (pro-resolution)
Cytokines and Chemokines
- Produced mainly by activated macrophages
- Stimulate endothelial cells to upregulate selectins (E/P-selectin) and ICAM-1, VCAM-1
- Stimulate macrophages and other cells to produce additional cytokines
- Induce systemic effects: fever (via PGE₂ in hypothalamus), acute phase response, leukocytosis
- CXCL8 (IL-8): major chemokine for neutrophils
- CCL2 (MCP-1): monocyte recruitment
- CCL5 (RANTES): T cells, eosinophils, basophils
Complement System
- C3a and C5a (anaphylatoxins): stimulate mast cell degranulation (→ histamine release), vasodilation, increased permeability
- C5a: most potent chemoattractant and leukocyte activator
- C3b: opsonin - coats microbes for phagocytosis
- C5b-9 (MAC): membrane attack complex → lysis of gram-negative bacteria and thin-walled microbes
Other Mediators
- Platelet activating factor (PAF): vasodilation, increased permeability, platelet aggregation
- Bradykinin: vascular permeability and pain
- Nitric oxide (NO): vasodilation; microbicidal at high concentrations
- Neuropeptides (substance P): pain and permeability
6. Morphologic Patterns of Acute Inflammation
| Pattern | Description | Example |
|---|---|---|
| Serous | Thin, watery exudate; little cellular content | Pleural effusion in viral pleuritis, blister fluid |
| Fibrinous | Fibrin-rich exudate; fibrinous pericarditis | "Bread and butter" pericarditis |
| Suppurative (Purulent) | Pus (neutrophils + liquefactive necrosis); abscess formation | Staphylococcal abscess |
| Ulcer | Local defect of surface epithelium | Peptic ulcer, skin ulcer in arterial insufficiency |
7. Outcomes of Acute Inflammation
- Complete resolution - elimination of offending agent, clearance of mediators, and restoration of normal tissue
- Healing by scarring - when tissue destruction is extensive or the tissue cannot regenerate (e.g., heart muscle)
- Progression to chronic inflammation - if the injurious agent persists or the acute response fails to resolve
8. Chronic Inflammation
- Persistent infections (M. tuberculosis, H. pylori, Treponema pallidum)
- Immune-mediated diseases (autoimmune diseases, allergies)
- Toxic agents (silica, asbestos, cholesterol crystals)
- Cases where acute inflammation never fully resolved
Cells of Chronic Inflammation
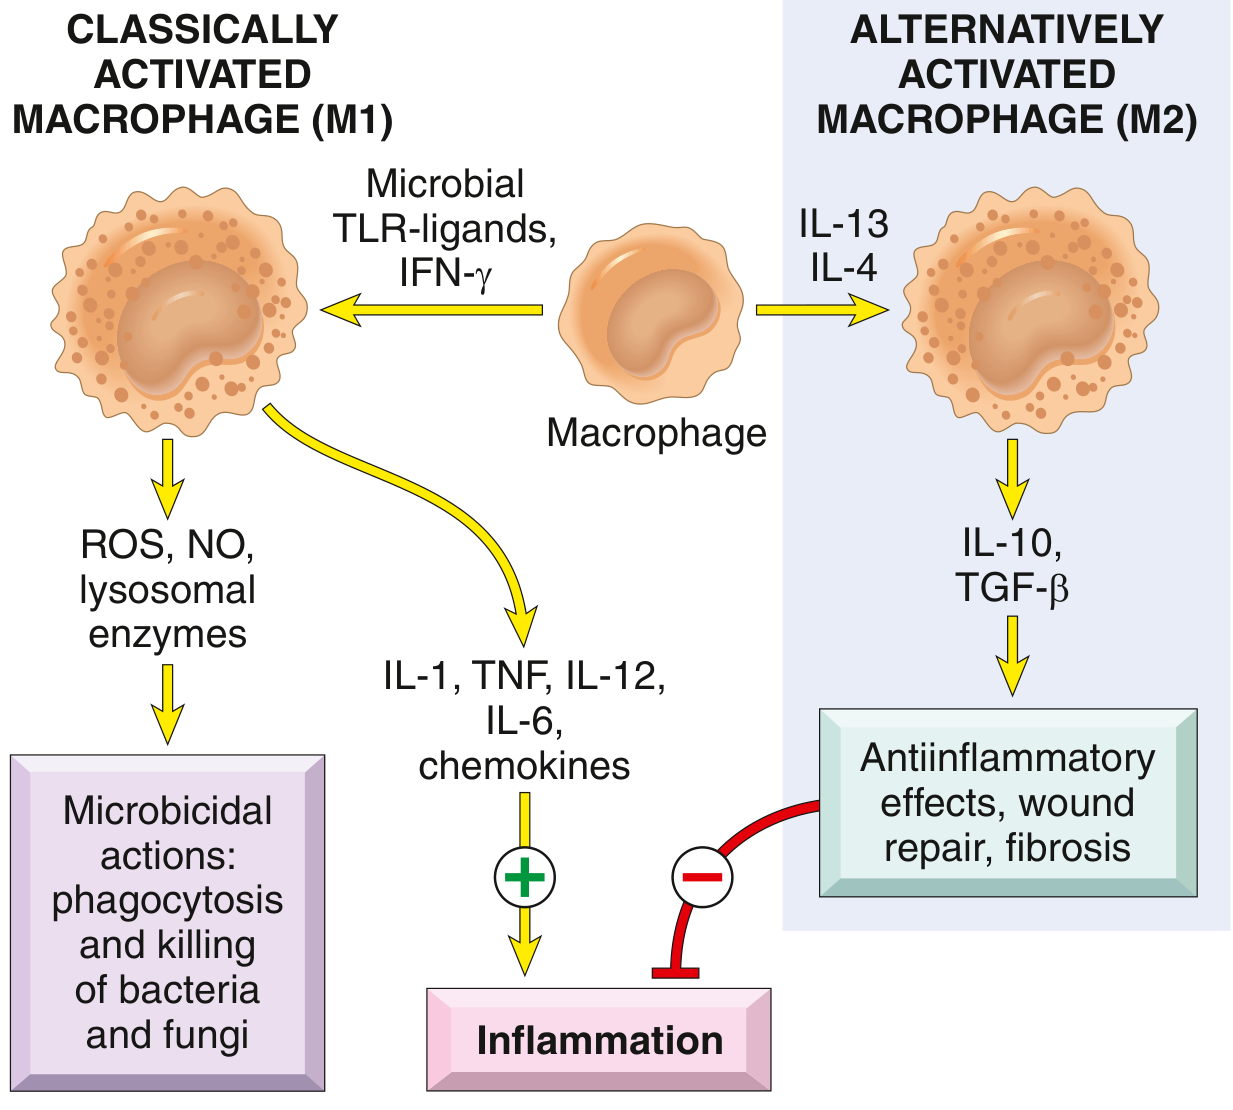
- M1 (classically activated): induced by microbial products (TLR ligands) and IFN-γ; produce ROS, NO, IL-1, TNF, IL-12, IL-6 → amplify inflammation and kill microbes
- M2 (alternatively activated): induced by IL-4 and IL-13; produce IL-10 and TGF-β → anti-inflammatory, wound repair, fibrosis
- T cells (especially CD4+ Th1 cells) produce IFN-γ → activate macrophages
- Th17 cells produce IL-17 → recruit neutrophils
- B cells produce antibodies
- T and B cell-macrophage bidirectional communication via CD40/CD40L, IFN-γ/IL-12 amplifies the response
Granulomatous Inflammation
9. Systemic Effects of Inflammation (Acute Phase Response)
- Fever: cytokines stimulate PGE₂ production in the hypothalamus; PGE₂ raises the thermostat set point. Elevated temperature enhances leukocyte killing ability and inhibits microbial replication.
- Leukocytosis: IL-1 and TNF stimulate early release of leukocytes from bone marrow reserves → left shift in neutrophils. Colony-stimulating factors (G-CSF, M-CSF) stimulate production.
- Bacterial infections → neutrophilia
- Viral infections → lymphocytosis
- Parasitic/allergic → eosinophilia
- Acute phase proteins (produced by liver under IL-6):
- CRP: opsonin; activates complement; rises within hours
- Fibrinogen: coagulation; increases ESR
- SAA (serum amyloid A): apolipoprotein; chronic overproduction leads to systemic amyloidosis (AA type)
- Hepcidin: reduces iron availability (anemia of chronic disease)
- Other: increased ACTH and glucocorticoids, decreased appetite (IL-1/TNF act on hypothalamus), decreased libido, somnolence
10. Tissue Repair and Resolution
- Short-lived mediators that decline when no longer produced
- Lipoxins, resolvins, and protectins that actively turn off the response
- Clearance of neutrophils by apoptosis and macrophage phagocytosis
- Hemostasis - platelet plug and clot formation
- Inflammation - neutrophils, then macrophages clear debris
- Proliferation (days 3-5):
- Angiogenesis: VEGF (stimulated by hypoxia via HIF) drives endothelial sprouting; matrix metalloproteinases degrade basement membrane to allow sprouting; pericytes recruited to stabilize new vessels
- Fibroblast migration and proliferation: stimulated by TGF-β, PDGF, FGF; produce collagen (Type III first, then Type I) → granulation tissue (soft, pink, granular; richly vascularized connective tissue)
- Remodeling (weeks to months): collagen cross-linking and reorganization by MMPs/TIMPs; vascular regression → pale, avascular scar
Healing by First vs. Second Intention
- First intention (primary union): clean surgical wound with apposed edges; minimal granulation tissue; minimal scar
- Second intention (secondary union): large open wound; extensive granulation tissue; wound contraction by myofibroblasts; significant scarring
Factors Impairing Repair
- Infection (most common)
- Diabetes (impaired angiogenesis, neutrophil function)
- Malnutrition (vitamin C deficiency impairs collagen synthesis and cross-linking; zinc deficiency)
- Glucocorticoids (inhibit TGF-β and fibroplasia)
- Poor perfusion / ischemia
- Foreign bodies
Pathologic Forms of Repair
- Keloid: exuberant scar formation beyond wound boundaries (genetic predisposition; more common in darker-skinned individuals)
- Hypertrophic scar: raised but confined to the wound margins
- Contracture: excessive contraction → functional impairment (e.g., burn scars)
- Organ fibrosis: chronic inflammation-driven collagen deposition in parenchymal organs (liver cirrhosis, pulmonary fibrosis, renal fibrosis)
Summary Table of Key Mediators
| Mediator | Source | Principal Actions |
|---|---|---|
| Histamine | Mast cells, basophils | Vasodilation, ↑ permeability |
| PGE₂, PGI₂ | Most cells (COX pathway) | Vasodilation, fever, pain |
| LTB₄ | Leukocytes (5-LOX) | Chemotaxis |
| LTC₄, D₄, E₄ | Mast cells, eosinophils | Bronchospasm, ↑ permeability |
| IL-1, TNF | Macrophages, other cells | Fever, acute phase response, leukocyte activation, endothelial activation |
| IL-6 | Macrophages, T cells | Acute phase protein synthesis |
| CXCL8 (IL-8) | Macrophages, endothelium | Neutrophil chemotaxis |
| C5a | Complement | Chemotaxis, mast cell activation |
| C3b | Complement | Opsonization |
| VEGF | Macrophages, other cells | Angiogenesis |
| TGF-β | Macrophages, platelets | Anti-inflammatory, fibrosis |
| NO | Macrophages, endothelium | Vasodilation, microbicidal |
Cellular response to injury and inflammation from Scott and brown textbook 10 mark question for ent resident
phases of wound healing inflammation proliferation remodeling
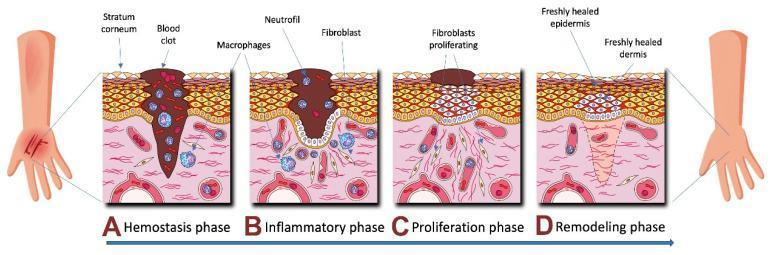
A medical pathophysiology diagram illustrating the four sequential phases of human skin wound healing: Hemostasis (A), Inflammation (B), Proliferation (C), and Remodeling (D). The cross-sectional views depict the stratum corneum, epidermis, and dermis. In the Hemostasis phase (A), a large blood clot fills the deep wound tissue with early macrophage presence. The Inflammatory phase (B) shows a persisting clot with an influx of neutrophils, macrophages, and early fibroblasts. The Proliferation phase (C) illustrates significant fibroblast activity and cellular multiplication beneath a shrinking scab as the epidermal gap begins to close. The final Remodeling phase (D) depicts a freshly healed epidermis and dermis with organized tissue structure and the absence of the initial clot and inflammatory cells. This illustration is an educational resource for understanding dermatological repair mechanisms and cellular recruitment during tissue injury.
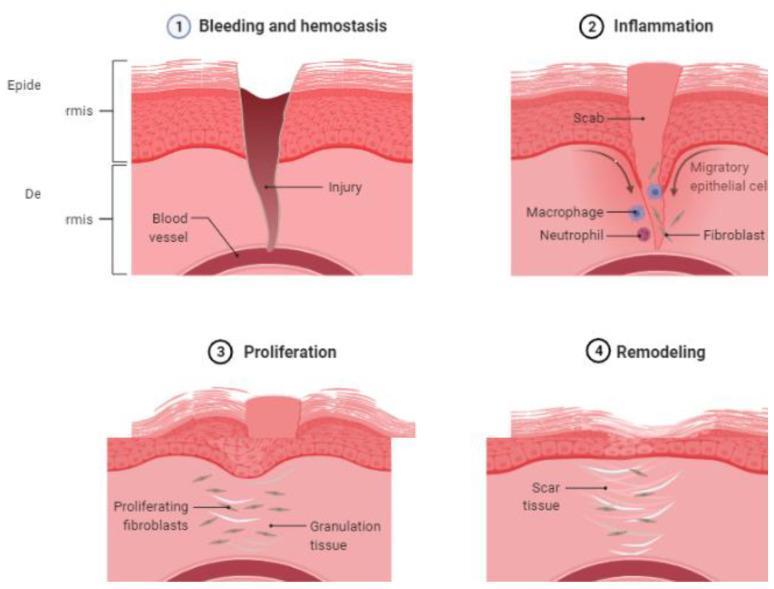
Anatomical diagram illustrating the four sequential phases of cutaneous wound healing: (1) Bleeding and Hemostasis, (2) Inflammation, (3) Proliferation, and (4) Remodeling. The cross-sectional illustrations represent the epidermis and dermis layers. Phase 1 shows a full-thickness injury penetrating through to the underlying blood vessel, depicting acute hemorrhage. Phase 2 (Inflammation) displays the formation of a surface scab, with arrows indicating the movement of migratory epithelial cells, alongside an infiltration of macrophages, neutrophils, and fibroblasts. Phase 3 (Proliferation) demonstrates the development of granulation tissue, characterized by proliferating fibroblasts and the reconstruction of the epidermal layer beneath the residual scab. Phase 4 (Remodeling) illustrates the final stage where the epidermis is fully restored, and the dermis contains organized scar tissue in place of the original injury site. This educational infographic provides a visual timeline of cellular responses and tissue structural changes during the natural course of human skin repair, useful for medical students and clinical practitioners studying pathophysiology.
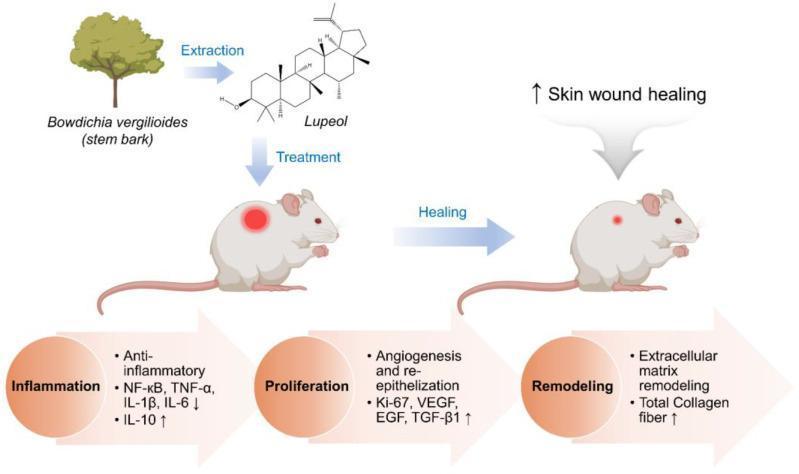
A medical infographic and pathophysiology diagram illustrating the therapeutic effect of Lupeol on the skin wound healing process. The diagram utilizes a rat model to visualize transition through three clinical phases: Inflammation, Proliferation, and Remodeling. Lupeol, shown as a chemical structure extracted from Bowdichia virgilioides, is applied as a treatment to a cutaneous wound. During the Inflammation phase, Lupeol modulates molecular pathways by decreasing pro-inflammatory markers (NF-κB, TNF-α, IL-1β, and IL-6) and increasing the anti-inflammatory cytokine IL-10. In the Proliferation phase, it promotes angiogenesis and re-epithelization through the upregulation of Ki-67, VEGF, EGF, and TGF-β1. The final Remodeling phase is characterized by increased total collagen fiber production and extracellular matrix remodeling, resulting in visible wound closure. The illustration demonstrates the multi-target mechanism of action of Lupeol in accelerating cutaneous repair by modulating growth factor expression and cytokine levels.
Cellular Response to Injury and Inflammation
Scott-Brown's Otorhinolaryngology, Head & Neck Surgery - 10 Mark Answer (ENT Residency)
Note: Scott-Brown's (8th ed., ISBN 9781138094642) in the library is a clinically focused ENT reference and does not contain a standalone basic science chapter on cellular injury/inflammation. The answer below is structured in the Scott-Brown's style and framing - with ENT-relevant examples throughout - drawing on its wound healing and reconstruction sections alongside the core pathology content from Robbins Basic Pathology, which Scott-Brown's itself references for basic science underpinning.
Introduction (1 mark)
- Acute inflammation (minutes to days)
- Chronic inflammation (weeks to months)
- Tissue repair and remodeling (weeks to years)
1. Recognition of Injury (1 mark)
- Pattern Recognition Receptors (PRRs), notably Toll-like receptors (TLRs), which detect:
- PAMPs (Pathogen-Associated Molecular Patterns) - e.g., bacterial LPS in acute otitis media or tonsillitis
- DAMPs (Damage-Associated Molecular Patterns) - e.g., ATP, HMGB1, uric acid released from necrotic cells after trauma or surgery
2. Vascular Response - Acute Inflammation (2 marks)
Vascular changes (sequence):
- Transient vasoconstriction (seconds) - neurogenic
- Vasodilation - arterioles then capillaries; driven by histamine, prostaglandins (PGE₂, PGI₂) and NO → heat and redness (calor, rubor)
- Increased vascular permeability - endothelial cell contraction causes intercellular gaps → protein-rich fluid (exudate) leaks into interstitium → swelling (tumor)
- Stasis - increased blood viscosity, leukocyte margination
Mechanisms of increased permeability:
| Mechanism | Agents | Onset |
|---|---|---|
| Endothelial contraction | Histamine, bradykinin, LTC₄/D₄ | Immediate (minutes) |
| Cytokine-mediated restructuring | TNF, IL-1 | Delayed (hours) |
| Direct injury | Burns, caustic ingestion | Immediate, sustained |
| VEGF-driven transcytosis | Hypoxia | Variable |
3. Cellular Response - Leukocyte Recruitment (2 marks)
Step 1: Margination and Rolling
- Selectin-mediated loose adhesion
- P-selectin and E-selectin (expressed on activated endothelium within 1-2 hours under TNF/IL-1) bind sialyl-Lewis X ligands on leukocytes
- Leukocytes roll slowly along the endothelial surface
Step 2: Firm Adhesion (Arrest)
- Chemokines (CXCL8/IL-8 presented on endothelial surface) trigger inside-out integrin activation on rolling leukocytes
- LFA-1 (αLβ2) and Mac-1 (αMβ2) on leukocytes bind ICAM-1 on endothelium → firm, irreversible adhesion
Step 3: Transmigration (Diapedesis)
- Leukocytes migrate between endothelial cells via PECAM-1 (CD31), JAM proteins
- Pierce basement membrane using matrix metalloproteinases (MMPs)
Step 4: Chemotaxis
- Bacterial peptides (fMLP)
- C5a (complement)
- LTB₄ (leukotriene B4)
- Chemokines: CXCL8 for neutrophils; CCL2 (MCP-1) for monocytes
4. Phagocytosis and Microbial Killing (1 mark)
Mechanism:
- Opsonization enhances recognition: IgG (Fc receptors) and C3b (complement receptors) coat microbes
- Engulfment: Pseudopod extension → phagosome → fusion with lysosome → phagolysosome
- Killing:
- NADPH oxidase → O₂⁻ (superoxide)
- Myeloperoxidase + H₂O₂ + Cl⁻ → HOCl (hypochlorous acid) - most potent bactericidal agent
- iNOS → NO (macrophages) → peroxynitrite
- Lysozyme, lactoferrin, defensins, acid hydrolases
5. Chemical Mediators of Inflammation (1 mark)
| Mediator | Source | Key Action |
|---|---|---|
| Histamine | Mast cells | ↑ permeability, vasodilation (early) |
| PGE₂/PGI₂ | COX pathway | Fever, vasodilation, pain sensitization |
| LTB₄ | 5-LOX pathway | Neutrophil chemotaxis |
| LTC₄/D₄/E₄ | Mast cells | Bronchospasm, ↑ permeability (key in allergic rhinitis) |
| IL-1, TNF | Macrophages | Fever, endothelial activation, acute phase response |
| IL-6 | Macrophages | Acute phase protein synthesis (CRP, fibrinogen) |
| CXCL8 (IL-8) | Macrophages, endothelium | Neutrophil chemotaxis |
| C3b / C5a | Complement | Opsonization / chemotaxis |
| VEGF | Macrophages (hypoxia) | Angiogenesis in repair |
| TGF-β | Macrophages, platelets | Fibrosis, anti-inflammatory |
- NSAIDs block COX → reduce PGE₂ (analgesia, anti-pyretic in tonsillitis)
- Leukotriene receptor antagonists (montelukast) block LTC₄/D₄ → allergic rhinitis management
- Glucocorticoids block phospholipase A₂ → reduce all arachidonic acid metabolites (nasal polyps, subglottic oedema)
6. Chronic Inflammation (1 mark)
- Persistent infections: Chronic rhinosinusitis (S. aureus biofilms), chronic otitis media
- Immune-mediated: Granulomatous diseases (Wegener's/GPA, sarcoidosis - both affecting ENT)
- Foreign body/crystals: Cholesteatoma matrix reaction
- Reflux laryngitis: Continuous chemical injury
Dominant cells:
- Macrophages (central orchestrators):
- M1 (classically activated by IFN-γ, TLR ligands) → produce ROS, NO, IL-1, TNF, IL-12 → kill microbes but also cause tissue damage
- M2 (alternatively activated by IL-4, IL-13) → produce IL-10, TGF-β → tissue repair and fibrosis
- Lymphocytes: CD4+ Th1 cells produce IFN-γ (activate M1 macrophages); Th2 cells promote eosinophil recruitment (nasal polyps, eosinophilic CRS)
- Plasma cells: Antibody production
- Eosinophils: Allergic/parasitic inflammation; central to eosinophilic CRS with nasal polyps
7. Tissue Repair and Wound Healing - ENT Relevance (2 marks)
Four phases of wound healing:
- Platelet plug, fibrin clot; platelets release PDGF and TGF-β → recruit fibroblasts
- Neutrophils (0-2 days): clear bacteria and debris
- Macrophages (2-4 days): phagocytose debris; secrete VEGF, TGF-β, FGF → orchestrate repair
- Re-epithelialization: Epithelial cells migrate from wound margins under fibrin clot
- Angiogenesis: VEGF (produced by hypoxic macrophages via HIF) drives endothelial sprouting → new capillary buds
- Granulation tissue: Fibroblasts (stimulated by TGF-β, PDGF) produce Type III collagen + new vessels = pink, soft, granular tissue
- Myofibroblast differentiation (TGF-β₁) → wound contraction (important in laryngotracheal healing - can cause stenosis)
- Type III collagen replaced by Type I (stronger, organized)
- MMPs and TIMPs balance collagen turnover
- Vascularity decreases → pale, avascular scar
- Tensile strength reaches 80% of normal at 3 months
Healing by First vs. Second Intention (Scott-Brown's principle):
| First Intention | Second Intention | |
|---|---|---|
| Wound edges | Apposed | Open/separated |
| Granulation tissue | Minimal | Abundant |
| Re-epithelialization | ~48 hours | Slower, from edges inward |
| Contraction | Minimal | Significant (myofibroblasts) |
| Scar | Small, linear | Broader |
| ENT example | Surgical incision after neck dissection | Wound breakdown after parotidectomy; tonsil fossa after tonsillectomy |
Factors impairing wound healing (ENT-specific):
- Prior radiotherapy - obliterates vasculature, impairs angiogenesis; major concern in post-RT salvage surgery and pharyngeal closure (fistula risk)
- Infection - biofilm on exposed plates/implants; wound dehiscence
- Malnutrition - poor protein and vitamin C → impaired collagen synthesis
- Diabetes mellitus - impaired neutrophil function, reduced angiogenesis
- Glucocorticoids - suppress TGF-β, inhibit fibroplasia
- Poor vascularity/ischemia - critical in post-laryngectomy pharyngeal closure
- Hypothyroidism - reduced collagen production
Pathological repair outcomes relevant to ENT:
- Laryngotracheal stenosis: Excessive myofibroblast-driven contraction and fibrosis after airway injury (prolonged intubation, tracheotomy, trauma). The inflammatory phase drives fibroblast proliferation, and TGF-β₁ overexpression → submucosal fibrosis → progressive luminal narrowing
- Keloid/hypertrophic scar: Exuberant collagen deposition; genetic predisposition; relevant in auricular and neck surgery
- Nasal polyposis: Chronic eosinophilic inflammation → TGF-β driven stromal oedema and remodeling
- Cholesteatoma: Chronic inflammatory matrix with destructive enzymatic activity (MMPs) → erosion of ossicles and bone
- Pharyngocutaneous fistula: Failure of first intention healing post-laryngectomy; driven by ischemia, RT, and infection
Summary
| Phase | Key Cells | Key Mediators | ENT Relevance |
|---|---|---|---|
| Recognition | Macrophages, mast cells | TLR signals, histamine | Acute otitis, tonsillitis onset |
| Vascular | Endothelium, mast cells | Histamine, PG, leukotrienes | Erythema, edema, obstruction |
| Cellular (acute) | Neutrophils → Macrophages | CXCL8, C5a, LTB₄ | Pus formation, abscess |
| Mediator release | All immune cells | TNF, IL-1, IL-6, complement | Fever, systemic response |
| Chronic | Macrophages, T cells | IFN-γ, TGF-β | CRS, granulomas, cholesteatoma |
| Repair | Fibroblasts, endothelium | VEGF, TGF-β, PDGF | Wound healing, stenosis risk |