
What will be seen in the ECG of third degree AV Block
complete heart block third-degree AV block ECG AV dissociation
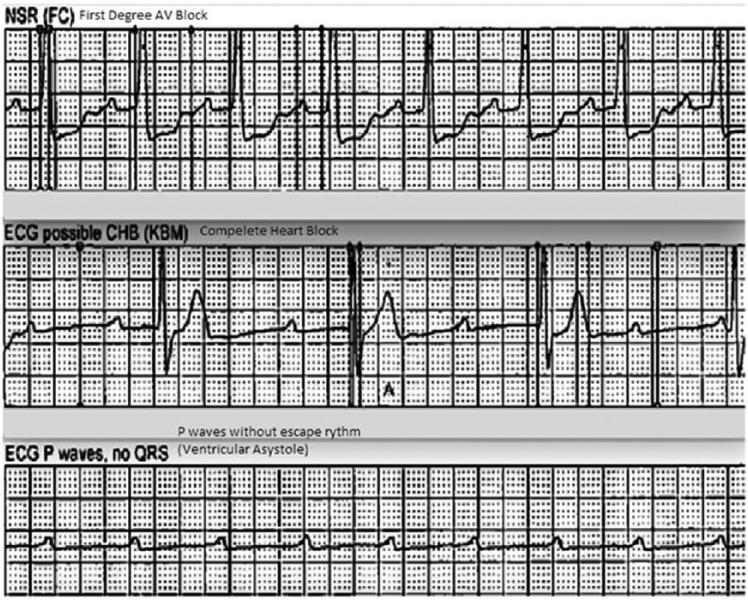
This diagnostic image displays a vertical comparison of three ECG rhythm strips demonstrating the progression and characteristics of different cardiac conduction abnormalities. The top strip, labeled 'NSR (FC) First Degree AV Block,' shows a sinus rhythm with a prolonged PR interval, indicating a delay in conduction between the atria and ventricles. The middle strip, labeled 'ECG possible CHB (KBM) Complete Heart Block,' illustrates third-degree atrioventricular (AV) block characterized by complete AV dissociation; P waves are present but occur independently of the slow, irregular QRS complexes (escape rhythm). The bottom strip, labeled 'ECG P waves, no QRS (Ventricular Asystole),' depicts a high-grade block where atrial activity (P waves) continues, but there is a total failure of ventricular conduction resulting in ventricular asystole. This sequence serves as an educational tool for identifying varying severity levels of heart blocks and the transition from conduction delay to lethal ventricular standstill.
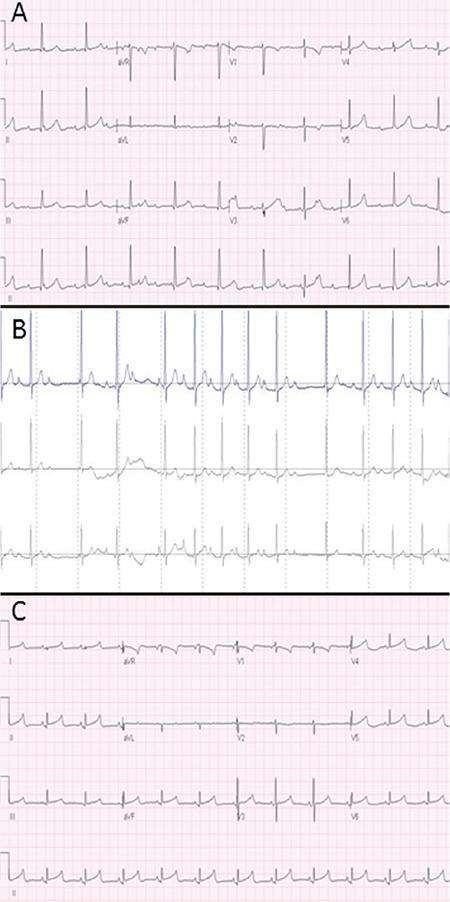
A comparison of three sequential electrocardiographic (ECG) tracings demonstrating the evolution and resolution of atrioventricular (AV) conduction abnormalities. Panel A displays a standard 12-lead ECG from Day 1 showing complete AV dissociation (Third-degree AV block). Key findings include a regular atrial rate (P waves) significantly faster than the regular ventricular rate (narrow QRS complexes), indicating no relationship between atrial and ventricular activity. Panel B presents a rhythm strip from a 24-hour Holter monitor on Day 15, illustrating a Mobitz Type I (Wenckebach) AV block. The tracing shows characteristic progressive prolongation of the PR interval followed by a non-conducted P wave (dropped QRS complex). Panel C shows a follow-up 12-lead ECG from sixteen months later, demonstrating a normal sinus rhythm with stable 1:1 AV conduction, consistent P wave morphology, and a normal PR interval. This visual progression is used to educate on the clinical spectrum of congenital heart block and its potential for recovery.
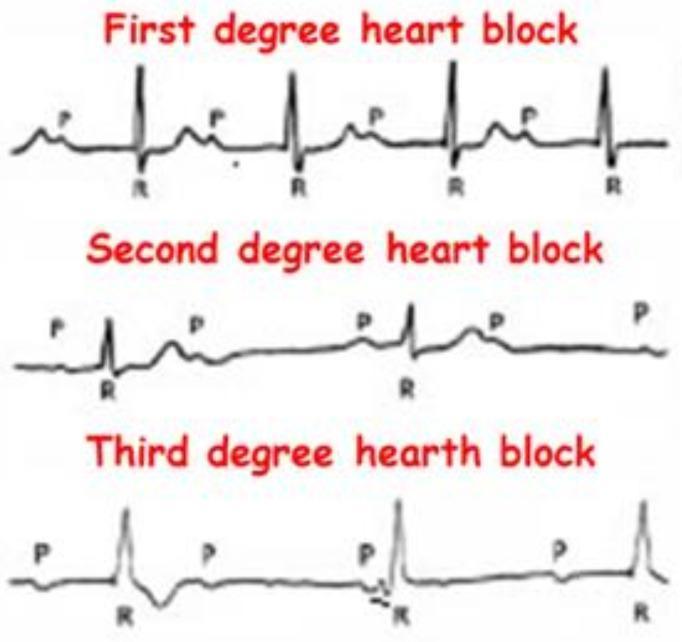
This Comparison Chart illustrates the electrocardiographic (ECG) characteristics of Atrioventricular (AV) blocks. It features three stacked rhythm strips categorized as First, Second, and Third-degree heart blocks, emphasizing the relationship between P waves (atrial depolarization) and QRS complexes (ventricular depolarization). The 'First degree heart block' panel demonstrates a consistent 1:1 P-to-QRS ratio with a fixed, prolonged PR interval. The 'Second degree heart block' panel shows intermittent conduction failure, where specific P waves are not followed by a QRS complex. The 'Third degree heart block' panel depicts complete AV dissociation, where P waves and QRS complexes occur independently and at different rates, indicating a total interruption of impulse transmission and the presence of a ventricular escape rhythm. This diagnostic illustration is designed for cardiovascular education to help students and clinicians distinguish between different stages of cardiac conduction system disease and their associated clinical significance.
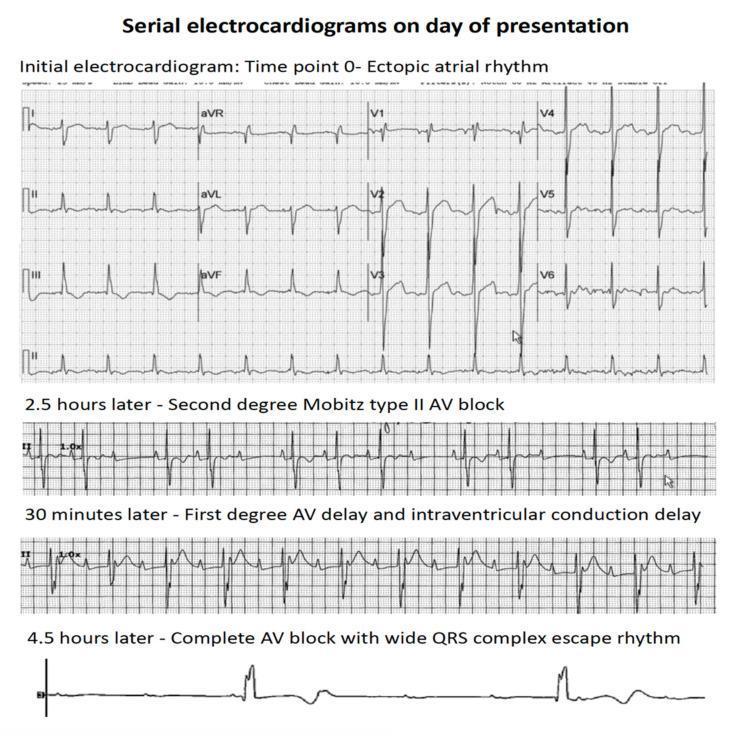
This diagnostic image consists of a series of four electrocardiogram (ECG) rhythm strips demonstrating the rapid clinical progression of atrioventricular (AV) conduction abnormalities over a period of 4.5 hours. The top panel, labeled 'Time point 0', shows an ectopic atrial rhythm with organized P-wave activity and narrow QRS complexes. The second strip, recorded 2.5 hours later, displays a second-degree Mobitz type II AV block, characterized by intermittently dropped QRS complexes without preceding PR interval lengthening. The third strip, 30 minutes later, indicates a first-degree AV delay (prolonged PR interval) and intraventricular conduction delay (widened QRS). The final rhythm strip at 4.5 hours shows third-degree (complete) AV block, characterized by complete AV dissociation and a slow, wide QRS complex ventricular escape rhythm. This progression illustrates acute cardiac conduction system failure, typically associated with myocardial infiltration or severe injury, as seen in patients with leukemic infiltration of the heart.
"atrioventricular block"[MeSH Terms]
- P waves: They are present and regular (regular P-P interval), at the normal sinus rate. They have no fixed relationship to the QRS complexes. Some fall on the T wave or QRS and distort them.
- QRS complexes: They are also regular (regular R-R interval), but at a slower rate than the P waves. The atrial rate is therefore faster than the ventricular rate.
- PR interval: It is completely variable because the P and QRS are unrelated. No PR interval is constant, and no P wave is conducted.
- Ventricular rate: It is slow, from an escape rhythm. The rate and QRS width depend on where the escape pacemaker sits:
- A junctional escape (block at the AV node) gives about 40 to 60 bpm with a narrow QRS. It is more reliable and often seen in congenital or inferior MI-related block.
- A ventricular escape (block below the His, in the His-Purkinje system) gives about 20 to 40 bpm with a wide QRS. It is less stable and can fail, causing asystole.
- High-grade (advanced) AV block: Two or more consecutive P waves fail to conduct, but some P waves still conduct. Complete block has no conducted beats at all. (Braunwald's Heart Disease, High-Grade AV Block.)
- Mobitz II: There are dropped QRS complexes with a fixed PR interval in the conducted beats. In complete block, no P waves conduct.
- Isorhythmic AV dissociation: The atrial and ventricular rates are similar, but the ventricular rate is not slower than the atrial rate. This differs from complete block, where the atrial rate is faster.
- Common causes are inferior MI, degenerative conduction disease, digoxin, beta-blockers, calcium channel blockers, Lyme disease, and congenital block.
- Patients may have syncope (Stokes-Adams attacks), dizziness, or heart failure.
- Management is a pacemaker if the block is permanent or symptomatic. Atropine or transcutaneous pacing is used for unstable patients.
How to calculate the Atrial rate?
calculating heart rate from ECG rhythm strip counting large boxes 300 150 100 75 60 50
| Large boxes between P waves | Atrial rate (bpm) |
|---|---|
| 1 | 300 |
| 2 | 150 |
| 3 | 100 |
| 4 | 75 |
| 5 | 60 |
| 6 | 50 |
- Count the P waves in a 6-second strip. Most ECG paper has markers every 3 seconds.
- Multiply by 10.
- Calculate the atrial rate from the P-P interval. It is regular and usually normal, about 60 to 100 bpm.
- Calculate the ventricular rate from the R-R interval. It is regular and slow, about 20 to 60 bpm.
- The atrial rate is faster than the ventricular rate, and the two are unrelated.
- Some P waves are buried in QRS complexes or T waves. To find the true P-P interval, look at the visible P waves and march out the regular P-P interval across the strip. Calipers help.
- Use the 6-second method if the atrial rhythm is irregular, for example in atrial fibrillation or flutter.
- Check the paper speed first. At 50 mm/sec the numbers double (one large box is 0.1 sec).