
MASH in NASH
MASH NASH nomenclature change MASLD 2023 criteria
MASH MASLD steatohepatitis nomenclature
MASLD MASH metabolic steatohepatitis
NASH MASH nonalcoholic steatohepatitis liver histology pathology
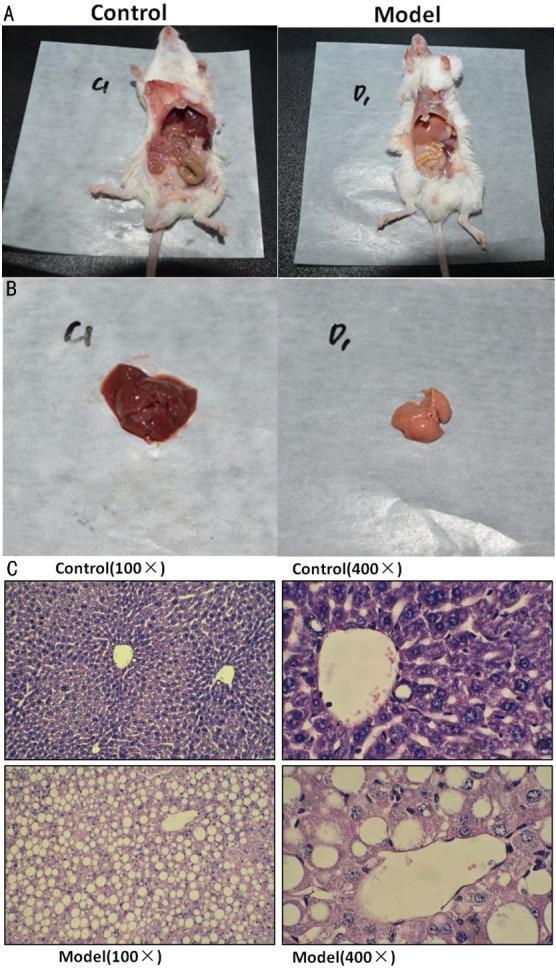
Educational panel illustrating the macroscopic and microscopic pathology of Nonalcoholic Steatohepatitis (NASH) in a mouse model. Panel A presents the gross anatomy of dissected control and model mice. Panel B provides a high-resolution clinical photograph comparing a healthy control liver (dark red/brown, smooth surface) with a NASH model liver (pale yellow-tan, suggestive of steatosis and atrophy). Panel C displays diagnostic histopathology using Hematoxylin and Eosin (H&E) staining at 100x and 400x magnifications. The control group micrographs show normal hepatocyte architecture with organized cords and clear sinusoidal spaces. In contrast, the NASH model micrographs demonstrate hallmark features of hepatic steatosis, including diffuse macrovesicular and microvesicular fat deposition, hepatocyte ballooning, and cellular disarray. The 400x magnification specifically highlights large, clear vacuoles within the cytoplasm of hepatocytes, which displace the nuclei to the periphery. This comparison serves as a diagnostic reference for metabolic liver disease research and pathological classification.
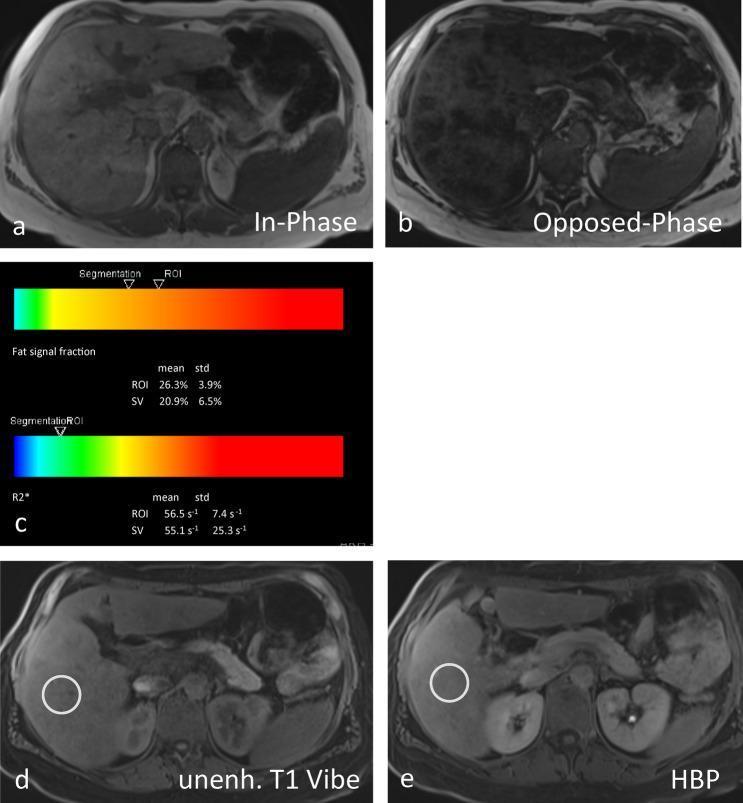
This composite of abdominal MRI scans and quantitative data illustrates advanced hepatic pathology, specifically nonalcoholic steatohepatitis (NASH). Panels (a) and (b) show T1-weighted In-Phase and Opposed-Phase images, demonstrating a significant drop in signal intensity across the liver parenchyma in the opposed-phase image, a hallmark of diffuse fatty infiltration (steatosis). Panel (c) provides quantitative 'LiverLab' analysis, indicating a proton density fat fraction (PDFF) of 26.3% (moderate-to-severe steatosis) and an effective R2* of 55.1 s⁻¹, ruling out significant iron overload. Panels (d) and (e) compare an unenhanced T1 Vibe sequence with a Hepatobiliary Phase (HBP) image following gadoxetic acid administration. The HBP image reveals a failure of the liver to enhance relative to the kidneys, signaling severely impaired hepatocyte uptake and advanced liver dysfunction consistent with fibrosis. This sequence of images serves as a clinical diagnostic tool for assessing chronic liver disease by combining morphologic fat quantification with functional hepatobiliary assessment.
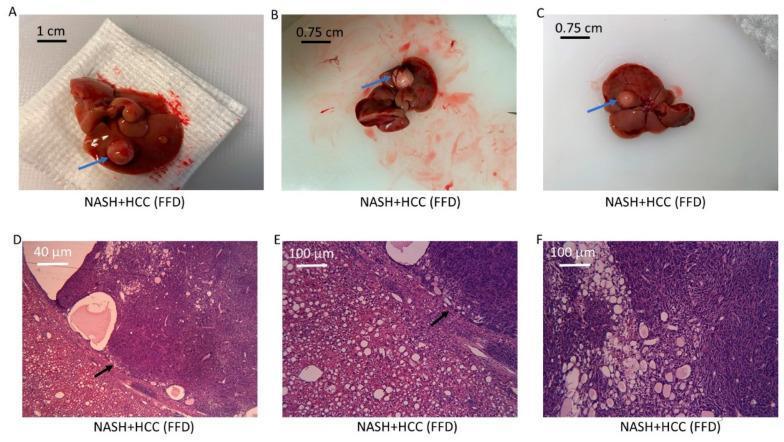
Educational visual showing the progression of Non-Alcoholic Steatohepatitis (NASH) to Hepatocellular Carcinoma (HCC) through gross and microscopic pathology. Panels A-C are clinical photographs of liver specimens from a research model, displaying distinct polyp-like, exophytic tumor growths (blue arrows) on a reddish-brown liver surface. Panel D-F show Hematoxylin and Eosin (H&E) stained sections at various magnifications (scale bars: 40 μm and 100 μm). The histology reveals a clear transition margin (black arrows) between noncancerous parenchyma and the malignant tumor. Key histopathological features include a trabecular growth pattern of atypical hepatocytes, significant macrovesicular steatosis (lipid vacuoles), inflammation, and clusters of hyperchromatic nuclei. This comparison illustrates the typical morphological changes and architectural distortion seen in NASH-associated liver cancer, highlighting the diagnostic criteria for differentiating steatotic liver tissue from neoplastic growth.
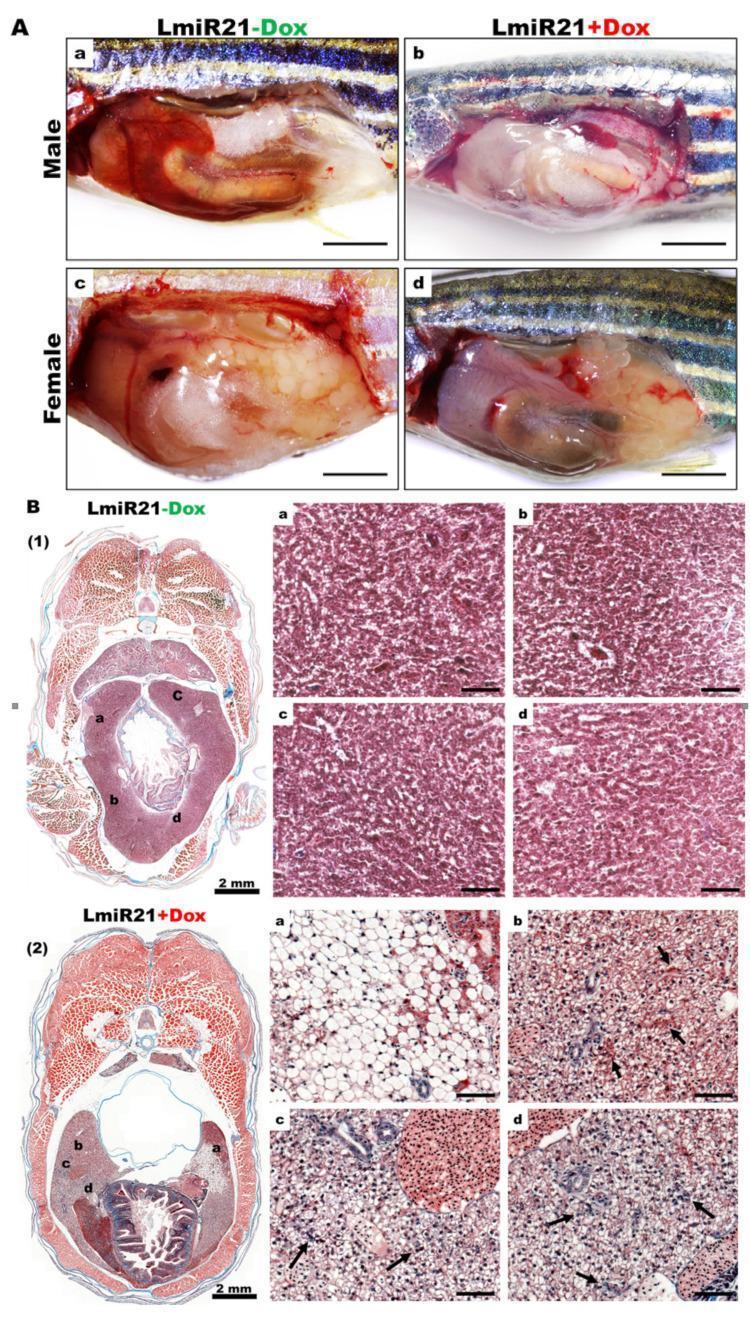
This composite image presents a preclinical study of nonalcoholic steatohepatitis (NASH) using a zebrafish model (LmiR21). Section A displays gross clinical photographs comparing livers from control (LmiR21-Dox) and experimental (LmiR21+Dox) groups at 6 months post-fertilization (mpf). In both males and females, the miR-21 induced livers (+Dox) appear enlarged, pale red, and greasy, consistent with hepatomegaly and steatosis. Section B provides histopathological analysis using Masson’s trichrome staining. The control liver (B1) shows normal hepatic architecture and cellularity. In contrast, the miR-21 overexpressing liver (B2) exhibits hallmark NASH phenotypes, including extensive hepatocyte ballooning (a), increased Mallory-Denk bodies (b, arrows), and significant lobular inflammation (c, d, arrows). These histopathological features demonstrate the progression from simple steatosis to steatohepatitis and early fibrosis, evidenced by blue-stained collagen deposition. This image serves as a translational model for understanding the role of microRNA-21 in hepatic lipid metabolism, inflammation, and fibrogenesis.
MASH in NASH: The 2023 Nomenclature Change and Full Clinical Overview
What Is MASH? (The Renamed NASH)
- "Non-alcoholic" is a negative, stigmatizing label that defines the disease by what it is not
- It fails to highlight metabolic dysfunction as the true driver of injury
New Nomenclature Framework
| Old Term | New Term | Acronym |
|---|---|---|
| Steatotic liver disease (overarching) | Steatotic Liver Disease | SLD |
| Nonalcoholic Fatty Liver Disease | Metabolic dysfunction-Associated Steatotic Liver Disease | MASLD |
| Nonalcoholic Steatohepatitis | Metabolic dysfunction-Associated Steatohepatitis | MASH |
| (New category) | Metabolic and Alcohol-associated Liver Disease | MetALD |
| Alcohol-associated liver disease | Alcohol-associated Liver Disease | ALD |
Diagnostic Criteria for MASLD/MASH
- Hepatic steatosis (by imaging or histology)
- Low alcohol intake: <20 g/day (women), <30 g/day (men)
- At least one cardiometabolic risk factor:
- Overweight/obesity
- Hypertension
- Dyslipidemia
- Insulin resistance or Type 2 Diabetes
Prevalence and Natural History
- 25-30% of the US adult population has MASLD
- 3-6% of those with MASLD have MASH
- MASH reaches ~14% prevalence in asymptomatic patients ≥50 years (e.g., at colonoscopy screening)
- MASLD is now a leading indication for liver transplantation in the US
- Clinically significant fibrosis (≥F2) has more than doubled in the past two decades
Healthy liver → MASL (steatosis only) → MASH (inflammation + ballooning) → Fibrosis → Cirrhosis → HCC
Pathophysiology
- Lipid accumulation - driven by insulin resistance, excess caloric intake, de novo lipogenesis, impaired beta-oxidation
- Lipotoxicity and oxidative stress - toxic lipid species (diacylglycerides, ceramides) injure hepatocytes
- Mitochondrial dysfunction - impaired beta-oxidation and increased ROS generation
- Gut microbiome dysbiosis - altered bile acid signaling, bacterial translocation, increased intestinal permeability
- Inflammatory cascade - TNF-alpha, IL-6, activation of Kupffer cells and hepatic stellate cells
- Fibrogenesis - activated stellate cells produce collagen → bridging fibrosis → cirrhosis
Clinical Features
- Incidentally found elevated ALT/AST or hepatic steatosis on imaging
- Vague right upper quadrant discomfort
- Hepatomegaly
- Features of metabolic syndrome (obesity present in 50-90%)
- Advanced disease: signs of portal hypertension (ascites, varices), jaundice (minority)
Diagnosis
- Imaging (ultrasound, MRI-PDFF, CT): detects steatosis; MRI-PDFF is most accurate for quantification
- Liver biopsy: gold standard for distinguishing MASH from simple steatosis and staging fibrosis - shows the hallmark triad: steatosis + lobular inflammation + hepatocyte ballooning (± fibrosis)
- Non-invasive fibrosis scores: FIB-4 index, NAFLD fibrosis score (NFS), elastography (FibroScan) - used to risk-stratify and avoid biopsy in low-risk patients
- Exclude other causes: medications (amiodarone, steroids, tamoxifen, methotrexate), Wilson disease, autoimmune hepatitis
Treatment
1. Lifestyle Modification (Foundation for ALL patients)
- Weight loss 3-5% improves steatosis
- Weight loss >10% improves MASH activity and fibrosis
- Mediterranean diet preferred (long-term adherence, cardiometabolic benefit)
- Avoid: excess saturated fat, refined carbohydrates, fructose, sugar-sweetened beverages
- Exercise: ≥150 min/week moderate activity (aerobic + resistance); dose-dependent benefit
- Coffee: ≥3 cups/day is associated with reduced fibrosis risk in epidemiologic studies
2. Pharmacologic Therapies (for at-risk MASH: ≥F2 fibrosis)
| Drug | Class | Status |
|---|---|---|
| Resmetirom (Rezdiffra) | Thyroid hormone receptor-beta agonist | FDA-approved March 2024 - first drug approved specifically for MASH |
| Semaglutide | GLP-1 receptor agonist | ESSENCE trial - significant MASH resolution |
| Tirzepatide | GLP-1/GIP dual agonist | SYNERGY-NASH trial - promising results |
| Obeticholic acid | FXR agonist | Did not receive FDA approval; trial showed fibrosis improvement but side effects |
| Pioglitazone | TZD/PPARγ agonist | Improves MASH histology; used off-label |
| Vitamin E | Antioxidant | Improves MASH in non-diabetic adults (PIVENS trial); not for diabetics/cirrhosis |
| Bariatric surgery | Metabolic surgery | Highly effective for weight loss and MASH resolution in eligible patients |
3. Advanced Disease
- MASH cirrhosis: manage portal hypertension, screen for HCC every 6 months, refer for liver transplant evaluation if decompensated
Why the Name Change Matters Clinically
- Reduces stigma - removes "fatty" and "alcoholic" from the diagnosis
- Highlights mechanism - makes metabolic risk factor management the obvious treatment focus
- Standardizes trials - global trial enrollment criteria now unified (ESSENCE, SYNERGY-NASH use MASH terminology)
- Cleaner coding - ICD-10: K76.0 (MASLD), K75.81 (MASH)
- New disease category - MetALD captures a previously unclassified patient group
Key Recent Evidence
- Steinberg et al., J Hepatol 2025 - Review of integrative metabolism in MASLD and MASH, emerging mechanisms (PMID 40032040)
- Do et al., Nat Rev Drug Discov 2025 - Comprehensive review of the therapeutic landscape of MASH (PMID 39609545)
- Targher et al., Gut 2024 - MASLD as a systemic metabolic disorder with cardiovascular and malignant complications (PMID 38228377)