
Biochemistry last MINUTE REVISION NOTES FMGE | NEET PG | INICET | All PYQs (2021-2026) 10-Page Comprehensive Notes • Image-Based Q Highlights
glycolysis metabolic pathway diagram biochemistry
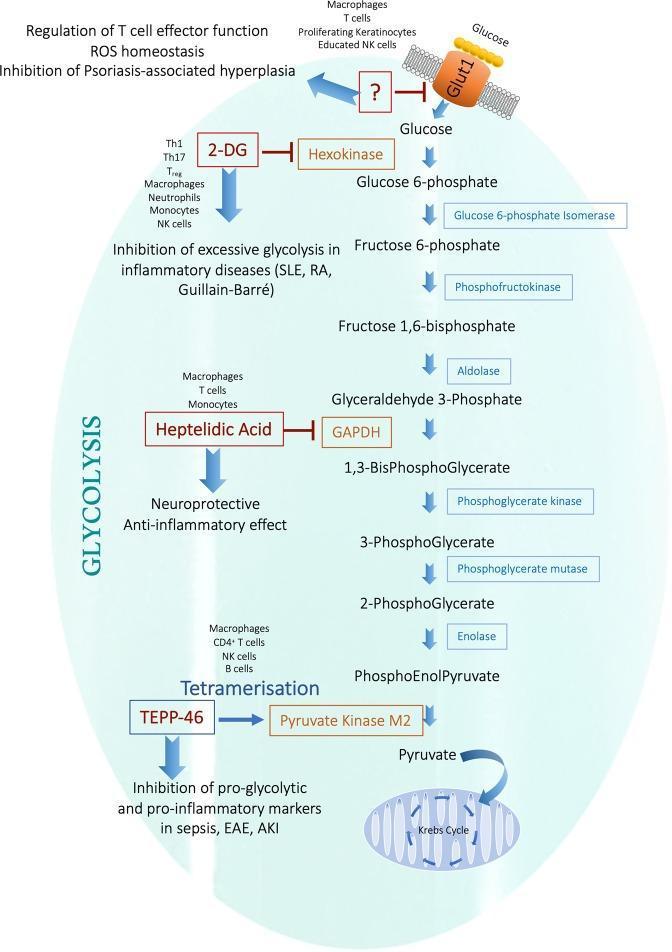
This pathophysiology diagram illustrates the glycolysis pathway as a therapeutic target for anti-inflammatory strategies. The metabolic flowchart depicts the sequence from glucose entry via the Glut1 transporter through various intermediates including glucose-6-phosphate, fructose-1,6-bisphosphate, and glyceraldehyde-3-phosphate, culminating in pyruvate entry into the Krebs cycle within the mitochondria. Key regulatory interventions are highlighted: 2-DG (2-deoxyglucose) inhibiting hexokinase to treat inflammatory diseases like SLE, RA, and Guillain-Barré; Heptelidic Acid inhibiting GAPDH for neuroprotective and anti-inflammatory effects; and TEPP-46 promoting the tetramerization of Pyruvate Kinase M2 to inhibit pro-inflammatory markers in sepsis, EAE, and AKI. The diagram identifies specific immune cell types affected by these interventions, such as Th1, Th17, macrophages, and NK cells. The educational focus is on how modulating metabolic enzymes can alter immune cell phenotype and manage systemic inflammatory conditions.
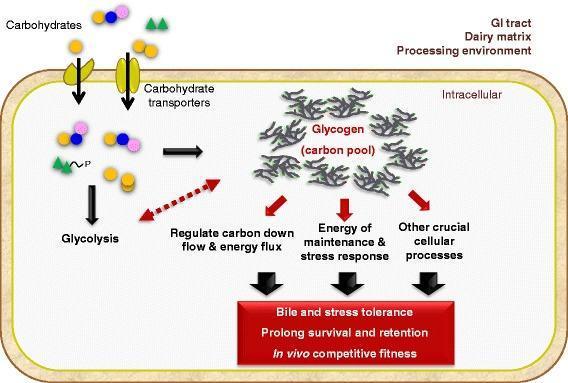
This pathophysiology diagram illustrates the metabolic mechanisms of the glycogen pathway in Lactobacillus acidophilus and its role in probiotic functionality. The diagram shows carbohydrate substrates being imported into the intracellular space through membrane-bound carbohydrate transporters. Once inside, these substrates follow two primary pathways: immediate metabolic processing via glycolysis or diversion to the glycogen biosynthetic pathway to form an intracellular 'carbon pool'. A bidirectional red arrow indicates a regulatory feedback loop between glycolysis and glycogen storage to modulate carbon downflow and energy flux. The glycogen pool is shown to serve three critical functions: regulation of metabolic flux, providing energy for maintenance and stress response, and supporting other crucial cellular processes. These physiological roles collectively contribute to the bacterium's clinical and probiotic attributes, including enhanced bile and stress tolerance, prolonged survival and retention in the GI tract, and improved in vivo competitive fitness within diverse environments such as the dairy matrix and processing facilities.
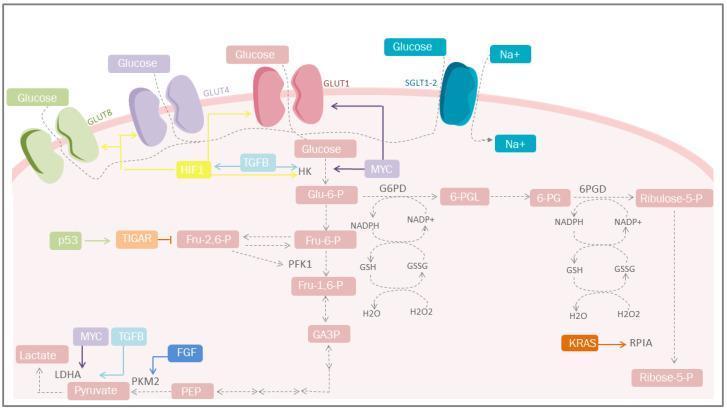
This pathophysiology diagram illustrates the metabolic reprogramming of a cell, specifically focusing on the Warburg effect and altered glucose metabolism common in cancer biology. The diagram depicts the plasma membrane featuring multiple glucose transporters, including SGLT1-2 (sodium-coupled), GLUT1, GLUT4, and GLUT8, which facilitate increased glucose uptake. The primary glycolytic pathway is shown progressing from Glucose to Glu-6-P (via HK), through Fru-6-P, Fru-1,6-P, GA3P, and PEP, ultimately leading to Pyruvate and Lactate (via LDHA). Parallel to glycolysis, the Pentose Phosphate Pathway (PPP) is detailed, converting G6P to Ribose-5-P while generating NADPH for redox homeostasis (GSH/GSSG balance) to mitigate ROS. Key regulatory mediators are highlighted: HIF-1 and MYC stimulate glucose transporters and glycolytic enzymes; TGFB and FGF influence PKM2 and LDHA activity; p53 regulates the process through TIGAR to inhibit Fru-2,6-P. The visual summarizes how oncogenic signaling (including KRAS) drives aerobic glycolysis and pentose production to support rapid cell proliferation and antioxidant defense.
heme synthesis porphyria pathway diagram
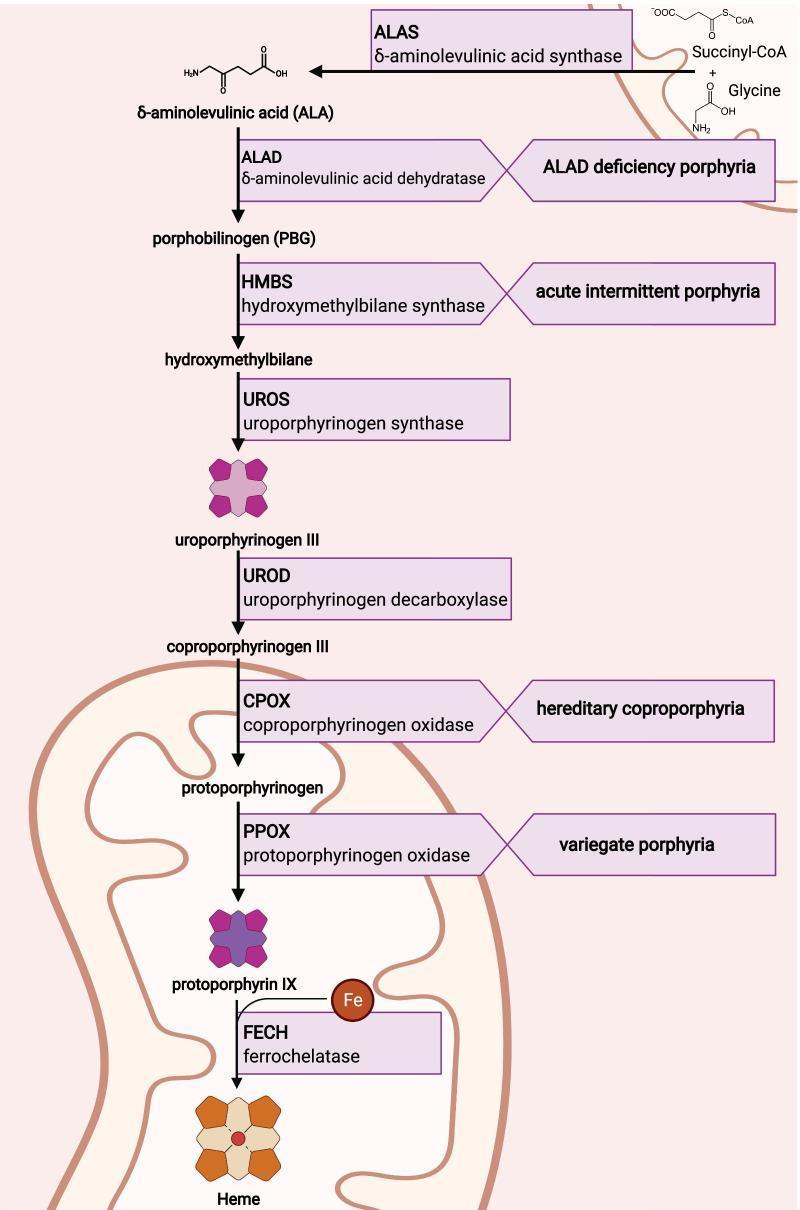
This medical pathophysiology diagram illustrates the heme biosynthesis pathway and its associated acute hepatic porphyrias. The flow is depicted across two cellular compartments: the mitochondria and the cytoplasm. The pathway begins in the mitochondria where Succinyl-CoA and Glycine are converted by ALAS (delta-aminolevulinic acid synthase) into delta-aminolevulinic acid (ALA). The process then moves to the cytoplasm, proceeding through intermediates: porphobilinogen (PBG), hydroxymethylbilane, uroporphyrinogen III, and coproporphyrinogen III, facilitated by enzymes ALAD, HMBS, UROS, and UROD respectively. The final stages return to the mitochondria, where coproporphyrinogen III is converted to protoporphyrinogen and then protoporphyrin IX via CPOX and PPOX. In the final step, ferrochelatase (FECH) incorporates iron (Fe) into protoporphyrin IX to form heme. The diagram explicitly links specific enzyme deficiencies to clinical conditions: ALAD deficiency porphyria (ADP), acute intermittent porphyria (AIP), hereditary coproporphyria (HCP), and variegate porphyria (VP). The visual uses chemical structures, enzyme labels, and mitochondrial representation to detail the metabolic sequence.
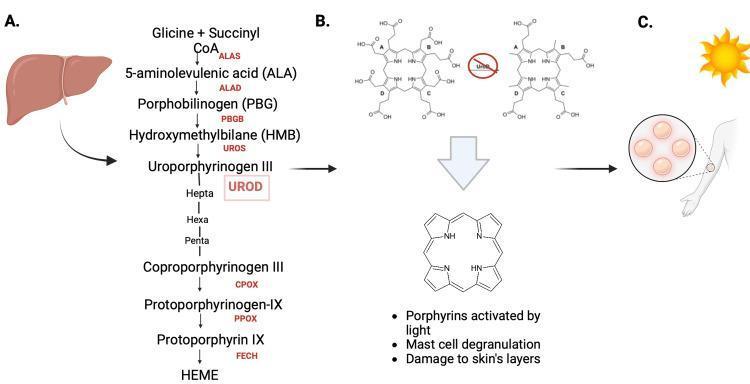
This composite educational infographic illustrates the pathophysiology of Porphyria Cutanea Tarda (PCT) through three integrated sections. Section A depicts the normal heme biosynthesis pathway in the liver, showing the enzymatic conversion starting from Glycine and Succinyl CoA, through intermediates like ALA, PBG, HMB, and Uroporphyrinogen III, catalyzed by enzymes including ALAS, ALAD, and UROD, culminating in HEME production. Section B focuses on the molecular pathogenesis of PCT, highlighting the inhibition of the enzyme Uroporphyrinogen Decarboxylase (UROD). This block leads to the accumulation of porphyrins, which is visually linked to a large chemical structure diagram. Section C demonstrates the clinical manifestation of this metabolic defect. It shows a human arm with a magnified view of cutaneous bullae (blisters) and a sun icon, illustrating how light-activated porphyrins cause mast cell degranulation and oxidative damage to skin layers. The diagram serves as an educational tool for understanding the link between hepatic enzymatic deficiencies and dermatological photosensitivity.
lipoprotein metabolism LDL HDL VLDL cholesterol
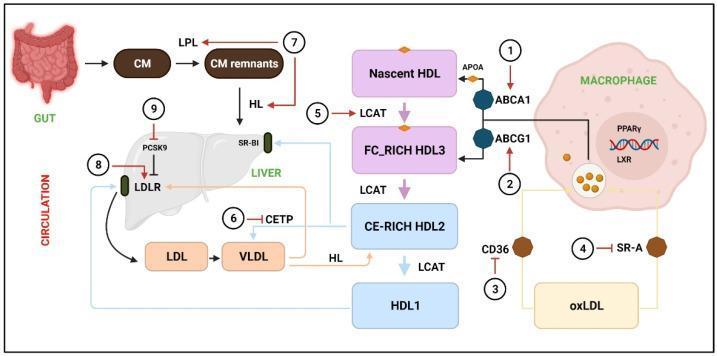
A pathophysiology diagram illustrating cholesterol metabolism, lipoprotein circulation, and Reverse Cholesterol Transport (RCT). The process is divided into exogenous, endogenous, and HDL pathways. In the exogenous pathway, the gut produces chylomicrons (CM), which are hydrolyzed by Lipoprotein Lipase (LPL) into CM remnants for hepatic uptake via SR-BI and Hepatic Lipase (HL) mediation. The endogenous pathway shows the liver secreting VLDL, which matures into LDL; LDL returns to the liver via the LDL receptor (LDLR), a process regulated by PCSK9 and CETP. The RCT/HDL pathway features Nascent HDL (APOA-associated) acquiring cholesterol from macrophages through ABCA1 and ABCG1 transporters. Maturation from FC-rich HDL3 to CE-rich HDL2 and HDL1 is catalyzed by LCAT. Specialized hepatic uptake occurs via SR-BI. On the right, a macrophage is shown accumulating oxidized LDL (oxLDL) via CD36 and SR-A receptors, leading to foam cell formation, regulated by PPARγ and LXR nuclear receptors. Numbered annotations (1-9) indicate potential therapeutic targets for phytochemicals to accelerate RCT and reduce atherosclerosis.
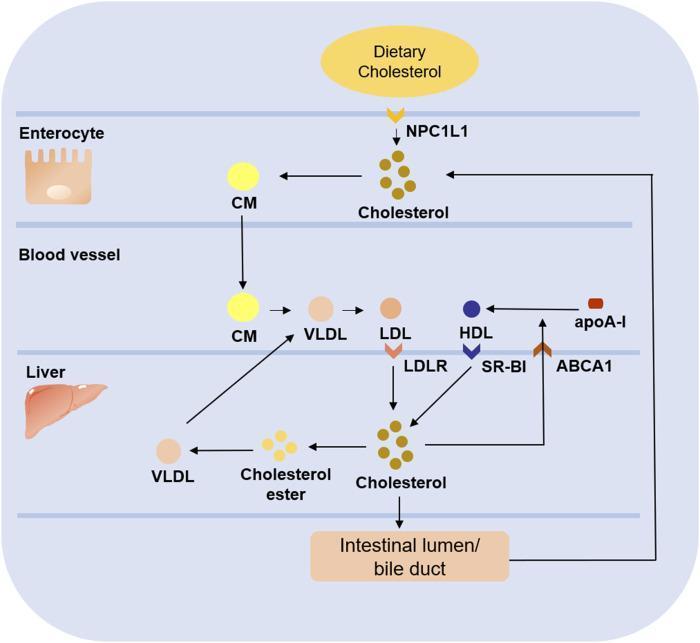
A pathophysiology diagram illustrating the pathways of cholesterol metabolism across four compartments: Enterocyte, Blood Vessel, Liver, and Intestinal Lumen/Bile Duct. Dietary cholesterol enters the enterocyte via the NPC1L1 transporter and is packaged into chylomicrons (CM). CMs enter the blood vessel and undergo conversion into very low-density lipoprotein (VLDL) and then low-density lipoprotein (LDL). LDL is taken up by the liver via the LDL receptor (LDLR). Within the liver, cholesterol can be converted into cholesterol esters to form nascent VLDL for secretion back into the blood vessel, or it can be excreted into the intestinal lumen/bile duct for potential reabsorption via NPC1L1. The diagram also shows reverse cholesterol transport: free liver cholesterol is transferred to the blood via ABCA1, where it combines with apoA-I to form high-density lipoprotein (HDL). HDL then returns cholesterol to the liver through the SR-BI receptor. This diagram highlights key lipoproteins (CM, VLDL, LDL, HDL) and regulatory proteins (NPC1L1, LDLR, ABCA1, SR-BI) involved in systemic lipid homeostasis.
DNA replication transcription translation central dogma
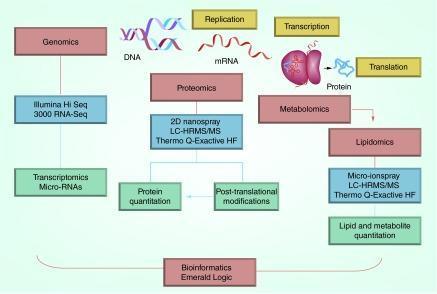
This systems biology infographic outlines a multi-omics approach to biomarker discovery and validation. The diagram is organized by biological flow, starting with molecular central dogma processes: replication (DNA), transcription (mRNA), and translation (protein). Four primary 'omics' fields are highlighted in red boxes: Genomics, Proteomics, Metabolomics, and Lipidomics. Each field is mapped to specific high-throughput analytical technologies in blue boxes. Genomics uses Illumina HiSeq 3000 RNA-Seq to analyze Transcriptomics and Micro-RNAs. Proteomics utilizes 2D nanospray LC-HRMS/MS (Thermo Q-Exactive HF) for protein quantitation and post-translational modification analysis. Lipidomics and Metabolomics employ micro-ionspray LC-HRMS/MS for lipid and metabolite quantitation. The flowchart illustrates how these diverse data streams converge into a centralized 'Bioinformatics Emerald Logic' node. This educational visual demonstrates the integration of genomic, proteomic, and metabolic data using sophisticated signal processing for comprehensive biomarker profiling in clinical research and drug development.
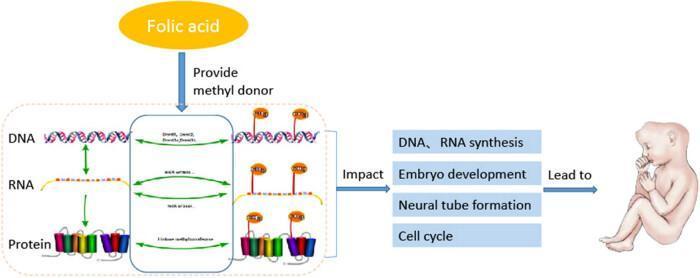
This pathophysiology diagram illustrates the role of folic acid in cellular methylation and its impact on human embryonic development. The flow begins with folic acid acting as a precursor to provide methyl donors (such as S-adenosylmethionine). A central dashed box highlights the epigenetic regulation of the central dogma: DNA, RNA, and proteins. Within this box, green arrows represent the transcription of DNA to RNA and the translation of RNA to protein. To the right, internal methylation reactions—catalyzed by methyltransferases—are shown adding methyl groups (indicated by 'Me' icons) to these macromolecules. The diagram outlines that these methylation processes directly impact critical biological functions, including DNA and RNA synthesis, embryo development, neural tube formation, and the cell cycle. The final pathway leads to an illustration of an infant with an open neural tube defect (anencephaly/encephalocele), visually demonstrating how disruptions in the folic acid-driven methylation cycle can lead to congenital malformations known as neural tube defects (NTDs).
🧬 BIOCHEMISTRY - LAST MINUTE REVISION NOTES
FMGE | NEET PG | INICET | All PYQs (2021-2026)
10-Page Comprehensive Notes • Image-Based Q Highlights
📄 PAGE 1 - ENZYMES & ENZYME KINETICS
Michaelis-Menten Kinetics (High-Yield)
| Parameter | Meaning | PYQ Trick |
|---|---|---|
| Km | [S] at half Vmax; affinity indicator | Low Km = High affinity |
| Vmax | Max velocity (enzyme-dependent) | Proportional to [E] |
| Kcat | Turnover number | Kcat/Km = catalytic efficiency |
Types of Enzyme Inhibition ⭐ FMGE/NEET PG Favourite
| Type | Vmax | Km | Lineweaver-Burk plot |
|---|---|---|---|
| Competitive | Unchanged | Increased | Lines intersect Y-axis (same Vmax) |
| Non-competitive | Decreased | Unchanged | Lines intersect X-axis (same Km) |
| Uncompetitive | Decreased | Decreased | Parallel lines |
| Irreversible | Decreased | Unchanged | Similar to non-competitive |
🔑 PYQ Mnemonic: "Competitive = Can be overcome (increase [S]); Km ↑, Vmax same"
Key Clinically Important Enzyme Inhibitors
| Drug | Enzyme Inhibited | Type |
|---|---|---|
| Methotrexate | Dihydrofolate reductase | Competitive |
| Aspirin | COX-1 & COX-2 | Irreversible |
| Omeprazole | H⁺/K⁺ ATPase | Irreversible |
| Allopurinol | Xanthine oxidase | Competitive (active form = irreversible) |
| Neostigmine | Acetylcholinesterase | Reversible competitive |
| Organophosphates | AChE | Irreversible |
Allosteric Enzymes
- Sigmoidal (not hyperbolic) curve
- Show cooperativity (Hill coefficient >1)
- Examples: ATCase, phosphofructokinase-1 (PFK-1), hemoglobin
- Homotropic effectors: substrate itself (e.g. O₂ on Hb)
- Heterotropic: different molecule (e.g. 2,3-BPG on Hb)
📄 PAGE 2 - CARBOHYDRATE METABOLISM I: GLYCOLYSIS & TCA
Glycolysis - The Big Picture
Occurs in cytosol; all cells; aerobic AND anaerobic
| Step | Enzyme | Regulator |
|---|---|---|
| Glucose → G6P | Hexokinase (tissues) / Glucokinase (liver) | HK: inhibited by G6P; GK: not inhibited |
| F6P → F1,6-BP | PFK-1 ⭐ rate-limiting step | (+) AMP, F2,6-BP; (-) ATP, citrate |
| PEP → Pyruvate | Pyruvate kinase | (-) ATP, alanine; (+) F1,6-BP |
🔑 Glucokinase vs Hexokinase: GK has HIGH Km (low affinity), not inhibited by product - acts as "glucose sensor" in β-cells
Pyruvate Fates
Pyruvate → Acetyl-CoA    (Pyruvate dehydrogenase; needs B1, B2, B3, B5, lipoic acid)
         → Oxaloacetate  (Pyruvate carboxylase; needs Biotin; gluconeogenesis)
         → Lactate       (LDH; anaerobic)
         → Alanine       (ALT/GPT; transamination)
         → Ethanol       (yeast; via acetaldehyde)
⭐ Pyruvate Dehydrogenase Complex cofactors: TPP (B1), FAD (B2), NAD (B3), CoA (B5), Lipoic acid Mnemonic: "Tender Loving Care For Nature" = TPP, Lipoate, CoA, FAD, NAD
TCA Cycle (Krebs Cycle)
Occurs in mitochondrial matrix
- 3 NADH + 1 FADH₂ + 1 GTP + 2 CO₂
- Total per glucose = 8 NADH + 2 FADH₂ + 2 GTP
| Enzyme | Reaction | Notes |
|---|---|---|
| Citrate synthase | OAA + AcCoA → Citrate | Inhibited by ATP, NADH |
| Isocitrate dehydrogenase | Isocitrate → α-KG | Rate-limiting; inhibited by ATP |
| α-KG dehydrogenase | α-KG → Succinyl-CoA | Needs B1,B2,B3,B5, lipoic acid (same as PDH!) |
| Succinate dehydrogenase | Succinate → Fumarate | Only TCA enzyme in inner mitochondrial membrane; linked to Complex II |
📄 PAGE 3 - CARBOHYDRATE METABOLISM II: HMP, GLUCONEOGENESIS, GLYCOGEN
HMP Shunt (Pentose Phosphate Pathway)
Location: Cytosol; especially active in RBCs, liver, adrenals, lactating mammary gland
- Oxidative: G6P → Ribulose-5P; generates 2 NADPH + 1 CO₂ per G6P
- Non-oxidative: Interconversion of sugars (transketolase = needs Thiamine/B1)
⭐ G6PD deficiency = most common enzyme deficiency globally; X-linked; Heinz bodies; triggered by oxidants (primaquine, dapsone, fava beans); RBCs lyse because NADPH depleted → can't regenerate GSH
- Glutathione reductase (RBC protection)
- Fatty acid synthesis (cytosol)
- Cholesterol synthesis
- CYP450 (microsomal hydroxylations)
- NADPH oxidase (respiratory burst in neutrophils)
Gluconeogenesis
Occurs in: Liver (main), Kidney (fasting), Intestine (minor) Uses: Lactate, Alanine, Glycerol, Odd-chain FAs (→ propionyl-CoA → succinyl-CoA)
| Glycolysis enzyme bypassed | GNG enzyme | Location | Cofactor |
|---|---|---|---|
| Pyruvate kinase | Pyruvate carboxylase | Mitochondria | Biotin |
| Pyruvate kinase | PEPCK | Mito/Cytosol | GTP |
| PFK-1 | Fructose-1,6-bisphosphatase | Cytosol | - |
| Hexokinase | Glucose-6-phosphatase | ER (liver/kidney only) | - |
⭐ Von Gierke disease: G6Pase deficiency → can't release glucose from liver; fasting hypoglycemia + hepatomegaly + lactic acidosis + hyperlipidemia
Glycogen Metabolism
| Process | Key Enzyme | Defect → Disease |
|---|---|---|
| Synthesis | Glycogen synthase (needs UDP-glucose) | - |
| Synthesis initiator | Glycogenin | - |
| Branching | Branching enzyme | Anderson disease (Type IV) |
| Breakdown | Glycogen phosphorylase | McArdle (muscle, Type V); Hers (liver, Type VI) |
| Debranching | Debranching enzyme | Cori disease (Type III) |
| Lysosomal | α-1,4-glucosidase (acid maltase) | Pompe disease (Type II) |
⭐ Pompe disease: Only glycogen storage disease with cardiomegaly; lysosomal enzyme deficiency; treated with recombinant enzyme replacement (alglucosidase alfa)
📄 PAGE 4 - LIPID METABOLISM
Fatty Acid Synthesis vs. β-Oxidation
| Feature | Synthesis | β-Oxidation |
|---|---|---|
| Location | Cytosol | Mitochondrial matrix |
| Carrier | Acyl Carrier Protein (ACP) | CoA |
| Reducing agent | NADPH | Produces NADH + FADH₂ |
| Key enzyme | ACC (rate-limiting; needs biotin) | Acyl CoA dehydrogenase |
| Transport into mito | Not applicable | Carnitine shuttle |
| Product | Palmitate (C16) | Acetyl-CoA |
⭐ Carnitine deficiency: Cannot transport long-chain FAs into mitochondria; muscle weakness, hypoketotic hypoglycemia; secondary to valproate use
- ACC activated by: Citrate, Insulin
- ACC inhibited by: Palmitoyl-CoA, Glucagon, Epinephrine
Ketone Bodies ⭐
Formed in: Liver mitochondria (from Acetyl-CoA during fasting/starvation/DKA) Used in: Brain (during prolonged fasting), Heart, Muscle, Kidney NOT used by liver (lacks succinyl-CoA transferase/thiophorase)
Lipoprotein Metabolism
| Lipoprotein | Made in | Main cargo | Key enzyme |
|---|---|---|---|
| Chylomicron | Intestine | Dietary TG | Lipoprotein lipase (LPL) |
| VLDL | Liver | Endogenous TG | LPL |
| IDL | From VLDL | Mixed | Hepatic lipase → LDL |
| LDL | From IDL | Cholesterol (60-70%) | LDL receptor (LDLR) |
| HDL | Liver + intestine | Reverse cholesterol transport | LCAT, CETP |
⭐ PYQ: Apo B-48 = chylomicrons; Apo B-100 = LDL/VLDL; Apo C-II = activates LPL; Apo E = hepatic remnant uptake; Apo A-I = HDL (activates LCAT)
⭐ Familial Hypercholesterolemia: LDL receptor defect; autosomal dominant; xanthomas, premature atherosclerosis; very high LDL
📄 PAGE 5 - AMINO ACID & PROTEIN METABOLISM
Transamination & Urea Cycle
- ALT (GPT): Alanine + α-KG → Pyruvate + Glutamate (liver specific marker)
- AST (GOT): Aspartate + α-KG → OAA + Glutamate
NH₄⁺ + CO₂ → Carbamoyl phosphate (CPS-I; mitochondria; needs N-acetylglutamate)
            → Citrulline (enters cytosol)
            → Argininosuccinate → Arginine → Urea + Ornithine
⭐ Hyperammonemia: Inhibits α-KG → TCA cycle disrupted → cerebral edema ⭐ Ornithine transcarbamylase (OTC) deficiency: Most common urea cycle disorder; X-linked; elevated orotic acid (key PYQ discriminator)
Inborn Errors of Amino Acid Metabolism ⭐⭐ HIGH YIELD TABLE
| Disease | Enzyme Defect | AA accumulated | Key Feature |
|---|---|---|---|
| PKU | Phenylalanine hydroxylase | Phenylalanine | Mouse urine smell, fair skin, intellectual disability, eczema |
| Tyrosinemia Type I | Fumarylacetoacetate hydrolase | Tyrosine metabolites | Liver failure, renal Fanconi |
| Alkaptonuria | Homogentisate oxidase | Homogentisic acid | Dark urine, ochronosis, arthritis |
| Maple Syrup Urine Disease | BCKDH complex | Leu, Ile, Val (BCAA) | Sweet urine, encephalopathy, needs B1 |
| Homocystinuria | CBS (B6-dependent) | Homocysteine | Marfanoid, lens dislocation DOWN, thrombosis, intellectual disability |
| Hartnup | Neutral AA transporter | Tryptophan↓ | Pellagra-like (Niacin deficiency), photosensitive rash |
| Cystinuria | Basic AA transporter | Cystine | Renal stones (hexagonal crystals); treat with D-penicillamine |
⭐ Marfan vs Homocystinuria: Marfan = lens UP; Homocystinuria = lens DOWN (classic PYQ distinction)
Key Amino Acid Functions
| AA | Special Role |
|---|---|
| Tryptophan | Serotonin, Melatonin, Niacin (B3) |
| Tyrosine | Dopamine, Epinephrine, Norepinephrine, T3/T4, Melanin |
| Glycine | Heme synthesis, Bile acids, Purine synthesis |
| Glutamine | Major nitrogen carrier in blood; fuel for enterocytes |
| Arginine | Urea cycle; NO synthesis (by NOS) |
| Methionine | SAM (methyl donor); starts protein synthesis |
📄 PAGE 6 - NUCLEOTIDE METABOLISM & MOLECULAR BIOLOGY
Purine vs Pyrimidine Synthesis
| Feature | Purine (A, G) | Pyrimidine (C, T, U) |
|---|---|---|
| Synthesis site | Built on ribose-5-P | Ring built first, then added to ribose |
| Rate-limiting enzyme | PRPP amidotransferase | CPS-II (cytosol) |
| Key precursors | Glycine, Aspartate, Glutamine, CO₂, Formate | Aspartate, Glutamine, CO₂ |
| Salvage enzyme | HGPRT | Thymidine kinase |
| Defect | Lesch-Nyhan (HGPRT deficiency) | Orotic aciduria (UMP synthase) |
⭐ Lesch-Nyhan: X-linked; self-mutilation, gout, intellectual disability, choreoathetosis; uric acid elevated
⭐ Orotic aciduria: Orotic acid in urine + megaloblastic anemia (does NOT respond to B12/folate); treat with uridine (bypasses block)
DNA Replication (Prokaryotic vs Eukaryotic)
| Feature | Prokaryote | Eukaryote |
|---|---|---|
| Origin | Single | Multiple (ARS) |
| Polymerase | DNA Pol III (main) | DNA Pol δ (lagging), DNA Pol ε (leading) |
| Primer made by | Primase | Primase |
| Removing primer | DNA Pol I (5'→3' exonuclease) | RNase H |
| Speed | ~1000 bp/sec | ~50 bp/sec |
⭐ DNA synthesis is always 5' → 3'; leading strand = continuous; lagging strand = Okazaki fragments
Mutations - DNA Repair
| Mutation Type | Description | Repair |
|---|---|---|
| Transition | Purine↔Purine or Pyrimidine↔Pyrimidine | Mismatch repair |
| Transversion | Purine↔Pyrimidine | Mismatch repair |
| Frameshift | Insertion/deletion of ≠3 nucleotides | Often lethal |
| Silent | Same amino acid | None needed |
| Missense | Different amino acid | Depends |
| Nonsense | Stop codon introduced | Truncated protein |
⭐ Xeroderma Pigmentosum: Nucleotide Excision Repair defect; UV-induced pyrimidine dimers not repaired; skin cancers in sun-exposed areas
Protein Synthesis (Translation)
| Site | Drug | Mechanism |
|---|---|---|
| 30S | Aminoglycosides (Streptomycin) | Misreading of mRNA |
| 30S | Tetracyclines | Block tRNA entry (A site) |
| 50S | Chloramphenicol | Inhibits peptidyl transferase |
| 50S | Macrolides (Erythromycin) | Block translocation |
| 50S | Linezolid | Inhibits 70S initiation complex |
⭐ Diphtheria toxin: Inactivates EF-2 (eukaryotic elongation factor) by ADP-ribosylation → halts protein synthesis
📄 PAGE 7 - HEME SYNTHESIS & HEMOGLOBIN
Heme Biosynthesis Pathway ⭐⭐ CRITICAL
- Succinyl-CoA + Glycine → δ-ALA (ALAS - rate-limiting; in mitochondria; needs B6/PLP)
- δ-ALA → PBG (ALAD - inhibited by Lead)
- PBG × 4 → Hydroxymethylbilane → Uroporphyrinogen III
- Uro III → Coproporphyrinogen III (UROD - inhibited by iron/alcohol → PCT)
- Copro III → Protoporphyrin IX
- Protoporphyrin IX + Fe²⁺ → Heme (Ferrochelatase - inhibited by Lead)
⭐ Lead poisoning blocks both ALAD and Ferrochelatase → ALA + protoporphyrin accumulate → anemia with basophilic stippling
Porphyrias Summary ⭐
| Disease | Deficient Enzyme | Key Features | Urine |
|---|---|---|---|
| AIP (Acute Intermittent Porphyria) | PBG deaminase (HMBS) | Abdominal pain, neuropsychiatric, NO skin lesions; triggered by drugs/alcohol/fasting | ↑ ALA, PBG |
| PCT (Porphyria Cutanea Tarda) | UROD | Most common; photosensitive blistering; associated with HCV, alcohol, iron | ↑ Uroporphyrin |
| ADP | ALAD | Very rare; similar to AIP | ↑ ALA |
| Erythropoietic Protoporphyria | Ferrochelatase | Photosensitivity (no blisters); liver disease | Normal urine |
⭐ AIP: "5 Ps" - Pain (abdominal), Polyneuropathy, Psychosis, Port-wine urine, Precipitated by drugs (barbiturates, sulfonamides, OCP)
Hemoglobin Structure & Variants
| Hb | Chains | Clinical Significance |
|---|---|---|
| HbA | α₂β₂ | Normal adult (95-97%) |
| HbA₂ | α₂δ₂ | Elevated in β-thalassemia trait (3-7%) |
| HbF | α₂γ₂ | Fetal; high O₂ affinity; ↑ in β-thalassemia |
| HbS | α₂β₂ᔆ (Glu→Val at β6) | Sickle cell disease |
| HbC | α₂β₂ᶜ (Glu→Lys at β6) | Mild hemolytic anemia |
| HbBarts | γ₄ | Hydrops fetalis (no α chains) |
- ↑ CO₂ (Bohr effect)
- ↑ Temperature
- ↑ 2,3-BPG
- ↓ pH (acidosis)
- Mnemonic: "CADET face right" = CO₂, Acid, 2,3-DPG, Exercise, Temperature
📄 PAGE 8 - VITAMINS (FAT-SOLUBLE & WATER-SOLUBLE)
Fat-Soluble Vitamins (A, D, E, K) ⭐
| Vitamin | Deficiency | Toxicity | Key Biochemistry |
|---|---|---|---|
| A (Retinol) | Night blindness, xerophthalmia, Bitot's spots, keratomalacia | Teratogenic, hepatotoxicity, pseudotumor cerebri | 11-cis-retinal in rhodopsin; retinoic acid → gene expression |
| D (Calciferol) | Rickets (children), Osteomalacia (adults), hypocalcemia | Hypercalcemia, nephrocalcinosis | D₃ (skin UV) → 25-OH-D₃ (liver) → 1,25-(OH)₂-D₃ Calcitriol (kidney, active form) |
| E (Tocopherol) | Hemolytic anemia, ataxia, posterior column degeneration | Rare; ↓ Vit K effect | Antioxidant; scavenges free radicals |
| K (Phylloquinone) | Bleeding (↑PT, normal BT); Neonatal hemorrhage | Hemolysis (excess K₃) | γ-carboxylation of factors II, VII, IX, X, Protein C, S (warfarin antagonizes) |
⭐ Vitamin D activation: 25-hydroxylation in LIVER; 1-hydroxylation in KIDNEY (by 1α-hydroxylase, stimulated by PTH, hypophosphatemia)
Water-Soluble Vitamins ⭐⭐ (Most PYQs)
| Vitamin | Coenzyme Form | Key Deficiency Syndrome |
|---|---|---|
| B1 (Thiamine) | TPP (Thiamine pyrophosphate) | Beri-beri (Wet = cardiac, Dry = neuro), Wernicke-Korsakoff (alcoholics) |
| B2 (Riboflavin) | FAD, FMN | Cheilosis, angular stomatitis, corneal vascularization, magenta tongue |
| B3 (Niacin) | NAD⁺, NADP⁺ | Pellagra: Diarrhea + Dermatitis + Dementia + Death ("4Ds") |
| B5 (Pantothenic acid) | CoA, ACP | Burning feet syndrome |
| B6 (Pyridoxine) | Pyridoxal phosphate (PLP) | Sideroblastic anemia, peripheral neuropathy, convulsions; deficiency with INH (treat with B6) |
| B7 (Biotin) | Carboxylation reactions | Dermatitis, alopecia, neurological; caused by raw egg white (avidin) |
| B9 (Folate) | THF (tetrahydrofolate) | Megaloblastic anemia; neural tube defects (NTD); ↑ homocysteine |
| B12 (Cobalamin) | Methylcobalamin, Adenosylcobalamin | Megaloblastic anemia + subacute combined degeneration of spinal cord; ↑ MMA + ↑ Homocysteine |
| C (Ascorbic acid) | - | Scurvy: perifollicular hemorrhages, corkscrew hairs, gum bleeding, impaired wound healing |
⭐ B12 vs Folate deficiency: Both → megaloblastic anemia + ↑ Homocysteine. ONLY B12 deficiency → ↑ Methylmalonic acid (MMA) + neurological symptoms
⭐ TPP-dependent enzymes: PDH, α-KGDH, Transketolase (HMP shunt), BCKDH (MSUD) - ALL need Thiamine!
⭐ Biotin-dependent carboxylases (mnemonic "Pyruvate Ate Acid Might Perish"):
- Pyruvate carboxylase
- Acetyl-CoA carboxylase
- Propionyl-CoA carboxylase
- Methylcrotonyl-CoA carboxylase
📄 PAGE 9 - CONNECTIVE TISSUE, LYSOSOMAL STORAGE & SIGNAL TRANSDUCTION
Collagen Synthesis ⭐
- Preprocollagen (endoplasmic reticulum, signal sequence cleaved)
- Procollagen (hydroxylation of Pro & Lys by prolyl/lysyl hydroxylase - needs Vitamin C + Fe²⁺)
- Triple helix formation in ER
- Glycosylation of hydroxylysine
- Secretion of procollagen
- Cleavage of terminal propeptides → Tropocollagen (by procollagen peptidase)
- Cross-linking by Lysyl oxidase (needs Cu²⁺) → forms collagen fibrils
⭐ Scurvy: Step 2 blocked (Vit C deficiency); proline/lysine cannot be hydroxylated; weakened collagen ⭐ Osteogenesis Imperfecta: Type I collagen gene (COL1A1/COL1A2) mutation; blue sclerae, brittle bones, hearing loss ⭐ Ehlers-Danlos: Lysyl hydroxylase or procollagen peptidase deficiency; hyperextensible skin/joints
Lysosomal Storage Diseases ⭐⭐
| Disease | Deficient Enzyme | Accumulated Substance | Key Feature |
|---|---|---|---|
| Gaucher | Glucocerebrosidase | Glucocerebroside | Most common LSD; Gaucher cells (crumpled tissue paper); bone pain, hepatosplenomegaly; Type I = no CNS |
| Niemann-Pick (A/B) | Sphingomyelinase | Sphingomyelin | Cherry-red spot (Type A); foam cells; fatal in infancy (Type A) |
| Tay-Sachs | Hexosaminidase A | GM2 ganglioside | Cherry-red spot; NO hepatosplenomegaly; Ashkenazi Jews; fatal |
| Fabry | α-Galactosidase A | Ceramide trihexoside | X-linked; angiokeratomas; renal failure; neuropathic pain |
| Krabbe | Galactocerebrosidase | Galactocerebroside | Globoid cells; peripheral neuropathy; infantile death |
| Metachromatic leukodystrophy | Arylsulfatase A | Sulfatide | Demyelination; peripheral neuropathy; metachromatic granules |
| Hurler/Hunter | α-L-Iduronidase / Iduronate-2-sulfatase | Heparan + Dermatan sulfate | Hurler = corneal clouding; Hunter = X-linked, NO corneal clouding |
| Pompe | α-1,4-Glucosidase | Glycogen | Cardiomegaly; only GSD that is also LSD |
🔑 Cherry-red spot diseases: Tay-Sachs, Niemann-Pick, GM1 Gangliosidosis, Sandhoff - (NOT Gaucher)
Signal Transduction ⭐
| Receptor Type | Second Messenger | Examples |
|---|---|---|
| Gs-coupled | ↑ cAMP (via Adenylyl cyclase) | β-adrenergic, Glucagon, TSH, ACTH, FSH, LH |
| Gi-coupled | ↓ cAMP | α₂-adrenergic, Somatostatin, Muscarinic M2 |
| Gq-coupled | ↑ IP₃ + DAG (PLC pathway) | α₁-adrenergic, M1/M3, GnRH, TRH, Oxytocin, ADH (V1) |
| Tyrosine kinase | Ras/MAP kinase | Insulin, IGF-1, EGF, PDGF, FGF |
| JAK-STAT | - | Cytokines (IL-2,6), EPO, GH, Prolactin |
| Guanylyl cyclase | ↑ cGMP | ANP, BNP, NO |
| Nuclear receptors | Direct gene expression | Steroid hormones, T3/T4, Vit D, Vit A |
⭐ Cholera toxin: ADP-ribosylates Gs → permanently activated → ↑↑ cAMP → massive Cl⁻/water secretion ⭐ Pertussis toxin: ADP-ribosylates Gi → cannot inhibit adenylyl cyclase → ↑ cAMP in airways
📄 PAGE 10 - NUCLEOTIDE COENZYMES, INTEGRATION & PYQ RAPID-FIRE
Key Coenzymes & Their B-Vitamin Origins
| Coenzyme | Vitamin Source | Reactions |
|---|---|---|
| NAD⁺/NADH | Niacin (B3) | Dehydrogenases in glycolysis, TCA, β-oxidation |
| FAD/FADH₂ | Riboflavin (B2) | Succinate DH (Complex II), fatty acyl-CoA DH |
| CoA | Pantothenic acid (B5) | Acetyl-CoA, Succinyl-CoA, Malonyl-CoA |
| TPP | Thiamine (B1) | PDH, α-KGDH, Transketolase, BCKDH |
| PLP | Pyridoxine (B6) | Transamination, decarboxylation, ALA synthase |
| THF | Folate (B9) | One-carbon transfers, dTMP synthesis |
| Biotin | Biotin (B7) | Carboxylation reactions |
| Lipoic acid | - (not a vitamin) | PDH, α-KGDH |
Rapid-Fire PYQs: "Most Common" / "Only" / "First"
| Fact | Answer |
|---|---|
| Most common lysosomal storage disease | Gaucher disease |
| Only LSD with cardiomegaly | Pompe disease |
| Most common urea cycle disorder | OTC deficiency (X-linked) |
| Most common enzyme deficiency worldwide | G6PD deficiency |
| Rate-limiting step of cholesterol synthesis | HMG-CoA reductase |
| Rate-limiting step of glycolysis | PFK-1 |
| Rate-limiting step of TCA cycle | Isocitrate dehydrogenase |
| Rate-limiting step of heme synthesis | ALAS (ALA synthase) |
| Rate-limiting step of purine synthesis | PRPP amidotransferase |
| Rate-limiting step of fatty acid synthesis | Acetyl-CoA carboxylase (ACC) |
| Rate-limiting step of gluconeogenesis | Fructose-1,6-bisphosphatase |
| Vitamin inhibited by raw egg white | Biotin (by avidin) |
| Vitamin given with INH to prevent neuropathy | B6 (Pyridoxine) |
| Vitamin causing teratogenicity in excess | Vitamin A |
| Cherry-red spot NOT in Gaucher | ALL other lipid storage diseases |
| Enzyme producing NO | NOS (needs Arginine, NADPH, O₂, BH4) |
| First enzyme in pyrimidine synthesis (cytosol) | CPS-II |
| First enzyme in purine synthesis (cytosol) | PRPP synthetase |
| DNA repair defect → skin cancer | Xeroderma pigmentosum (NER defect) |
Image-Based Q Highlights ⭐ (Frequently Tested Visuals)
| Visual Finding | Diagnosis |
|---|---|
| Basophilic stippling on peripheral smear | Lead poisoning (↑ALA, ↑protoporphyrin) |
| Heinz bodies (Brilliant cresyl blue) | G6PD deficiency |
| Gaucher cells (crumpled tissue paper macrophages) | Gaucher disease |
| Foam cells (Niemann-Pick) | Sphingomyelinase deficiency |
| Cherry-red spot on fundoscopy | Tay-Sachs, Niemann-Pick type A |
| Hexagonal crystals in urine | Cystinuria |
| Silver/blue urine on standing | Alkaptonuria (homogentisic acid oxidizes) |
| Port-wine colored urine | AIP (porphyria) |
| Pseudotumor cerebri on imaging | Vitamin A toxicity |
| Onion bulb appearance (nerve biopsy) | Krabbe / Charcot-Marie-Tooth |
HMP Shunt / Electron Transport Quick Numbers
| Chain Complex | Name | Inhibitor | Substrate |
|---|---|---|---|
| Complex I | NADH dehydrogenase | Rotenone, Amytal | NADH |
| Complex II | Succinate dehydrogenase | Malonate | FADH₂ |
| Complex III | Cytochrome bc1 | Antimycin A | Ubiquinol |
| Complex IV | Cytochrome oxidase | Cyanide, CO, Azide | O₂ (final acceptor) |
| ATP Synthase (V) | F₀F₁ ATPase | Oligomycin | ADP+Pi |
| Uncoupler | - | 2,4-DNP, Thermogenin | Dissipates gradient (↑O₂, ↑heat, ↓ATP) |
⭐ P:O ratio (ATP per O): NADH → 2.5 ATP; FADH₂ → 1.5 ATP ⭐ Total ATP per glucose (aerobic): ~30-32 ATP
🎯 FINAL 60-SECOND CHECKLIST BEFORE EXAM
Create a 10-question mock exam covering high-yield topics
Microbiology LAST MINUTE REVISION NOTES FMGE | NEET PG | INICET | All PYQs (2021-2026) 10 Page Comprehensive Notes • Image-Based Q and make a Comprehensive pdf
gram positive gram negative bacteria cell wall staining
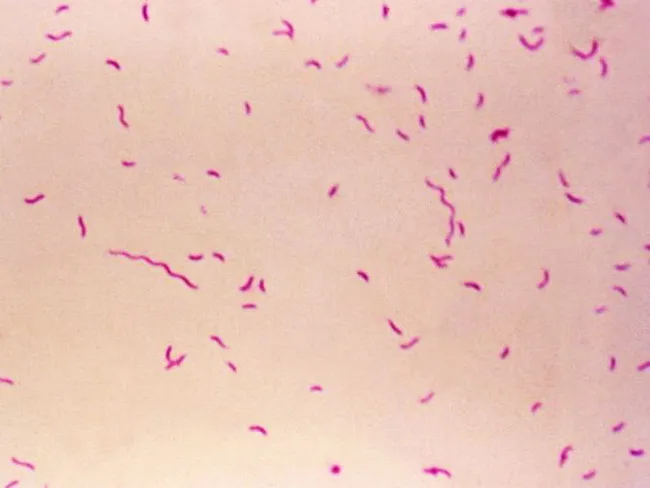
Bright-field light microscopy of a Gram-stained bacterial smear reveals numerous small, slender, curved Gram-negative rods with a characteristic gull-wing appearance consistent with Campylobacter species. The image captures bacteria oriented individually and in small clusters against a pale pink counterstain, illustrating Bacillary morphology typical of enteric pathogens. Gram staining shows purple/blue rods (crystal violet retained by cell wall) with a light pink background from the counterstain (safranin), enabling discrimination from Gram-positive organisms. The organisms appear slender and curved, with a single polar flagellum suggested by motility or alignment in the smear. Specimen type is a bacterial smear obtained from a gastrointestinal sample (feces or culture isolate), prepared for diagnostic microbiology. The imaging modality is bright-field microscopy at high magnification (approximately 1000x with oil immersion), following Gram staining to highlight bacterial cell wall structure. Clinically, detection of Campylobacter species supports infectious gastroenteritis; in the IPSID (immunoproliferative small intestinal disease) context, Campylobacter involvement has been proposed as a pathogenic trigger mirroring Helicobacter pylori's role in gastric MALT lymphoma. Differential diagnoses include Helicobacter, Vibrio, and other curved Gram-negative bacteria. This image serves educational and diagnostic utility for microbiology, clinical pathology, gastroenterology, and infectious disease research.
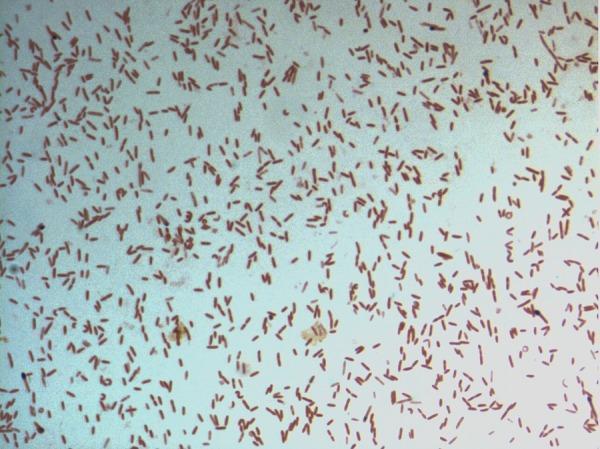
This diagnostic image shows a light microscopy view of a bacterial culture following Gram staining. The specimen displays numerous small, rod-shaped (bacilli) bacteria distributed across the field. The microorganisms exhibit a consistent pink-to-red hue, identifying them as Gram-negative. This staining characteristic indicates a cell wall structure with a thin peptidoglycan layer and an outer membrane that does not retain the crystal violet stain. The arrangement of the bacilli is predominantly individual or scattered, with occasional small clusters and pairs. Specifically identified as D. fastidiosa strain JC13T, this image serves as a primary microbiological reference for the morphological and staining properties of this novel genus within the family Erysipelotrichaceae. The visual demonstrates key diagnostic features including cell morphology, arrangement, and Gram reaction, which are essential for clinical microbiology classification and initial pathogen identification.
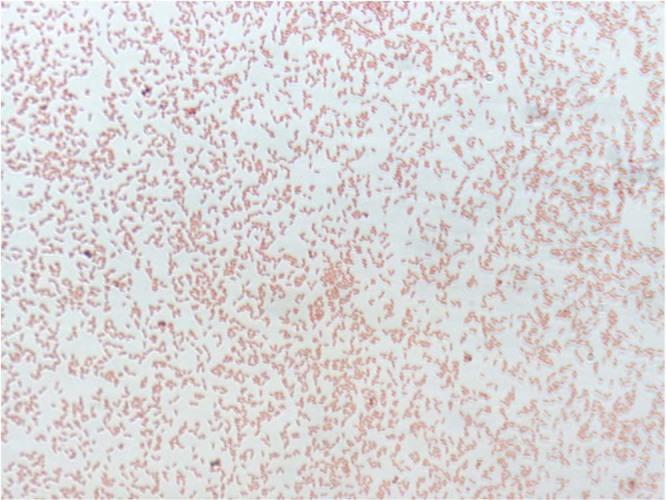
This diagnostic micrograph displays a Gram-stained smear of Pedobacter schmidteae strain EGT, a Gram-negative bacterium. The image shows a high density of pink/red stained bacterial cells, a color characteristic of Gram-negative organisms that do not retain crystal violet but take up the safranin counterstain. The morphology of the bacteria is consistently rod-shaped (bacilli). The cells are predominantly arranged individually or in loose, disorganized clusters, and are distributed across a relatively clear background with uniform staining intensity. This visual is representative of microbiology laboratory techniques used for the preliminary classification and morphological identification of bacterial isolates based on cell wall composition and shape.
tuberculosis Mycobacterium acid fast bacilli lung pathology
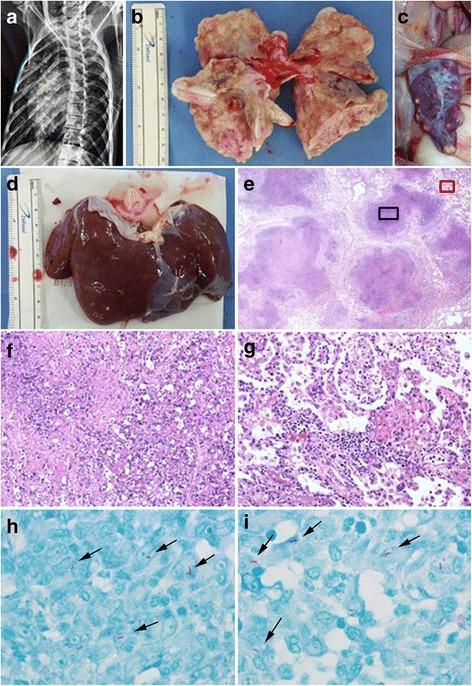
This composite figure illustrates the multi-organ manifestations of Mycobacterium tuberculosis in a primate model, showcasing diagnostic imaging, gross pathology, and histopathology. Panel (a) is a chest radiograph showing diffuse pulmonary infiltrates. Panels (b), (c), and (d) present gross pathology of the lungs, spleen, and liver respectively, highlighting numerous pale, nodular granulomatous lesions across the organ surfaces. Panels (e), (f), and (g) are Hematoxylin and Eosin (H&E) stained sections of lung tissue at varying magnifications (12.5x to 200x). They demonstrate classic granulomatous inflammation with central amorphous caseous necrosis and surrounding inflammatory cell infiltration. Panels (h) and (i) show high-magnification (1000x) Ziehl-Neelsen stains of the lung tissue, specifically identifying several acid-fast bacilli (AFB) visible as small, bright red-pink rods (indicated by arrows) against a blue methylene counterstain. This progression from clinical radiology to microscopic confirmation of AFB and caseating granulomas illustrates the typical diagnostic pathway for systemic tuberculosis.
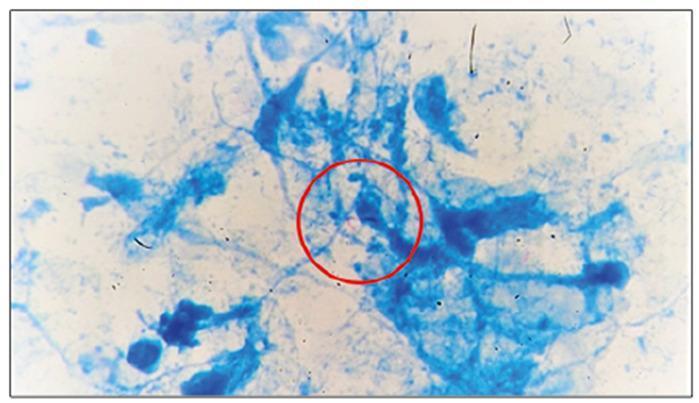
This diagnostic image is a high-power light microscopy field showing a histopathological sample stained with Ziehl-Neelsen or a similar acid-fast stain. The background consists of blue-stained cellular debris, fibrous tissue, and inflammatory infiltrates from a pericardial biopsy. Centrally highlighted within a red circular annotation are several bright red or pink, rod-shaped microorganisms. These characteristics are pathognomonic for acid-fast bacilli (AFB), specifically Mycobacterium tuberculosis. The visual demonstrates the diagnostic findings of tuberculous pericarditis, where the pathogen is directly visualized within the pericardial tissue despite a non-granulomatous histological appearance. This slide serves as an educational example of infectious pathology and the clinical utility of specialized staining in identifying extracellular pathogens in extrapulmonary tuberculosis.
fungal infection Candida Aspergillus hyphae microscopy
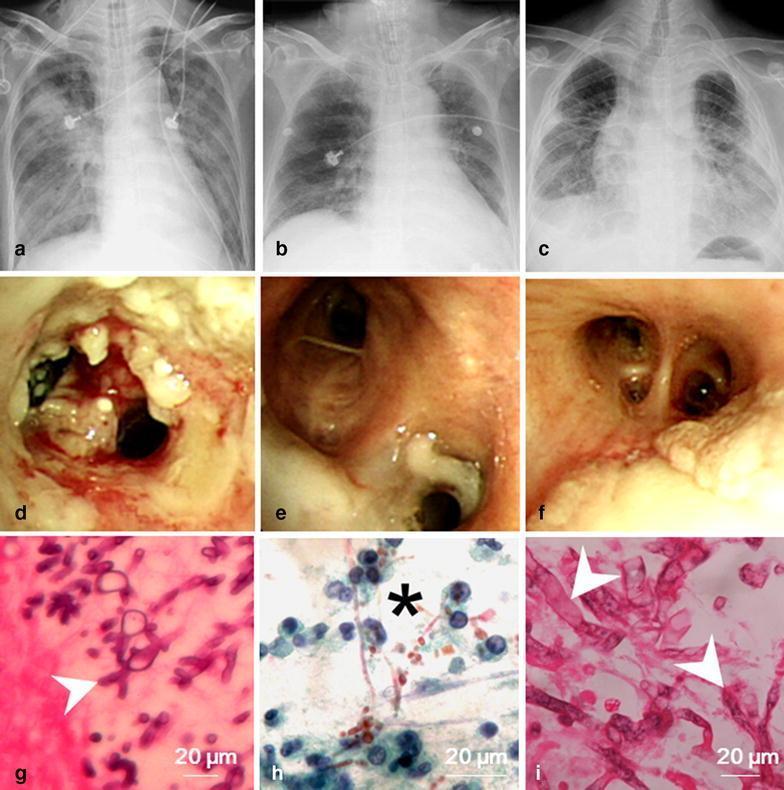
A multi-modal comparison of invasive fungal tracheobronchitis (IFT) caused by Aspergillus, Candida, and Mucorales. The composite consists of nine panels (a-i) organized by diagnostic modality. Panels a-c: Chest radiographs showing diffuse, bilateral pulmonary infiltrates and consolidations common across different fungal etiologies. Panels d-f: Bronchoscopic views demonstrating various endobronchial manifestations: (d) extensive pseudomembranous and ulcerative lesions with irregular surfaces (Aspergillus), (e) smooth whitish pseudomembranes (Candida), and (f) focal whitish plaques with associated airway inflammation (Mucorales). Panels g-i: Histopathological microscopy (400x magnification, 20 µm scale bars) highlighting diagnostic morphology: (g) septate hyphae with characteristic 45-degree acute-angle branching (Aspergillus), (h) yeast cells and elongated pseudohyphae (Candida), and (i) a mixed infection showing broad, thin-walled, non-septate hyphae (Mucormycete) alongside septate Aspergillus hyphae. This comparison illustrates that while radiographic and bronchoscopic findings may overlap, histopathology is critical for differentiating the specific fungal species in immunocompromised or critically ill patients.
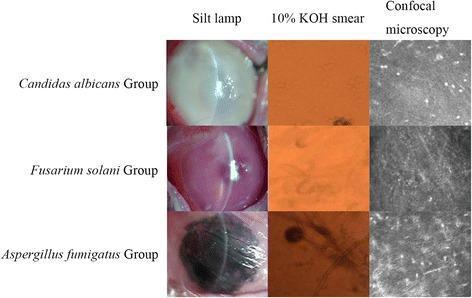
A comparative medical display illustrating fungal keratitis findings across three different pathogenic fungi: Candida albicans, Fusarium solani, and Aspergillus fumigatus. The visual content is organized in a matrix format showcasing three diagnostic modalities: slit-lamp biomicroscopy, 10% KOH smear, and confocal microscopy. Slit-lamp images demonstrate distinct corneal macroscopic variations: Candida shows a dense, white, opaque infiltrate; Fusarium presents with a reddish-pink corneal hue and a focal light reflex; and Aspergillus exhibits dark, pigmented necrotic areas with surface irregularity. The 10% KOH smears reveal microscopic fungal morphology, highlighting branching hyphae in Fusarium and spherical structures with radiating filaments in Aspergillus against an orange-stained background. Confocal microscopy panels provide high-resolution cellular views, showing bright punctate spots for Candida and dense, interconnected filamentous networks for Fusarium and Aspergillus. This resource serves as an educational guide for differentiating fungal etiologies in infectious keratitis through clinical and microbiological correlation.
virus structure HIV retrovirus replication cycle
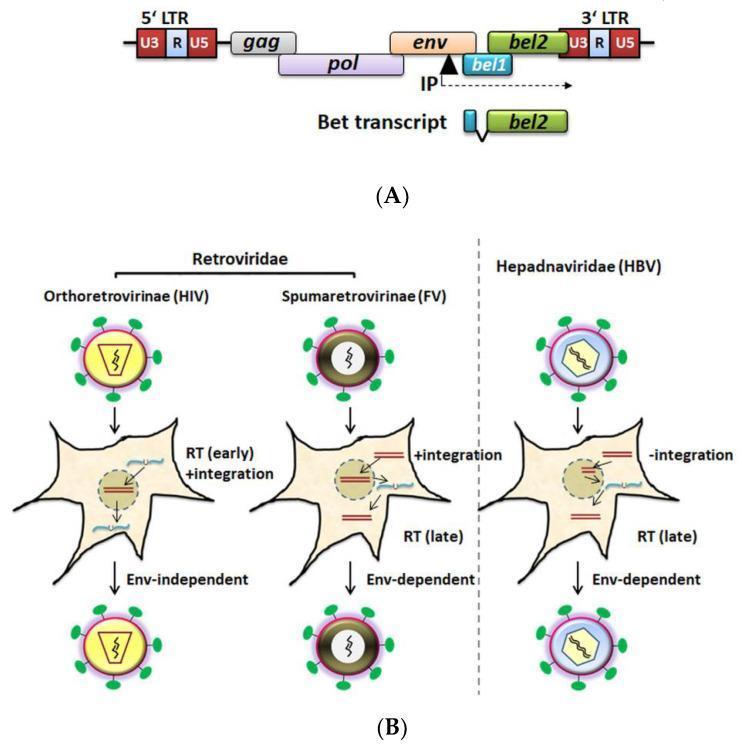
Educational diagram illustrating the genome organization of Foamy Virus (FV) and comparing replication strategies among reverse-transcribing viruses. Panel (A) depicts the FV genome structure, showing the 5' and 3' long terminal repeats (LTRs) flanking the structural genes (gag, pol, env) and the accessory genes (bel1 and bel2). A unique internal promoter (IP) is located within the env gene, driving the transcription of the Bet protein, a spliced product composed of bel1 and bel2 sequences. Panel (B) presents a comparative pathophysiology flowchart for three virus groups: Orthoretrovirinae (HIV), Spumaretrovirinae (FV), and Hepadnaviridae (HBV). The comparison highlights three key divergent mechanical features: 1. Reverse Transcription (RT) Timing: HIV performs early RT, whereas FV and HBV perform late RT. 2. Genomic Integration: Retroviridae (HIV and FV) undergo chromosomal integration, while HBV does not. 3. Budding Mechanism: HIV budding is envelope (Env)-independent, whereas FV and HBV require specific Env-glycoprotein interactions for viral release. The diagram uses standard notation where blue lines represent RNA and brown lines represent DNA molecules.
![This medical illustration depicts the genome structure and replication cycle of a flavivirus, such as Dengue or Zika virus. Panel A shows the positive-sense single-stranded RNA genome, featuring a 5' cap, 5' UTR, and 3' UTR flanking a single large open reading frame. This ORF encodes three structural proteins (Capsid [C], pre-Membrane [prM], and Envelope [E]) followed by seven non-structural proteins (NS1, NS2A, NS2B, NS3, NS4A, NS4B, and NS5). Panel B illustrates the viral life cycle within a host cell. Key stages shown include: 1) Binding to surface receptors; 2) Clathrin-mediated endocytosis; 3) pH-dependent uncoating and RNA release; 4) Translation and RNA replication at the endoplasmic reticulum (ER); 5) Viral assembly within the ER; 6) Transport and maturation through the trans-Golgi network; and 7) Release of mature virions via exocytosis. The diagram serves as an educational tool for understanding virology, infectious diseases, and potential targets for antiviral therapy.](https://cdn.orris.care/cdss_images/pmc_clinical_VQA_c80650e90103b75a02caace91d818897b875a6e330e888870d4cc7655f2d8fbe.jpg)
This medical illustration depicts the genome structure and replication cycle of a flavivirus, such as Dengue or Zika virus. Panel A shows the positive-sense single-stranded RNA genome, featuring a 5' cap, 5' UTR, and 3' UTR flanking a single large open reading frame. This ORF encodes three structural proteins (Capsid [C], pre-Membrane [prM], and Envelope [E]) followed by seven non-structural proteins (NS1, NS2A, NS2B, NS3, NS4A, NS4B, and NS5). Panel B illustrates the viral life cycle within a host cell. Key stages shown include: 1) Binding to surface receptors; 2) Clathrin-mediated endocytosis; 3) pH-dependent uncoating and RNA release; 4) Translation and RNA replication at the endoplasmic reticulum (ER); 5) Viral assembly within the ER; 6) Transport and maturation through the trans-Golgi network; and 7) Release of mature virions via exocytosis. The diagram serves as an educational tool for understanding virology, infectious diseases, and potential targets for antiviral therapy.
bacterial toxin mechanism Staphylococcus Clostridium pathogenesis
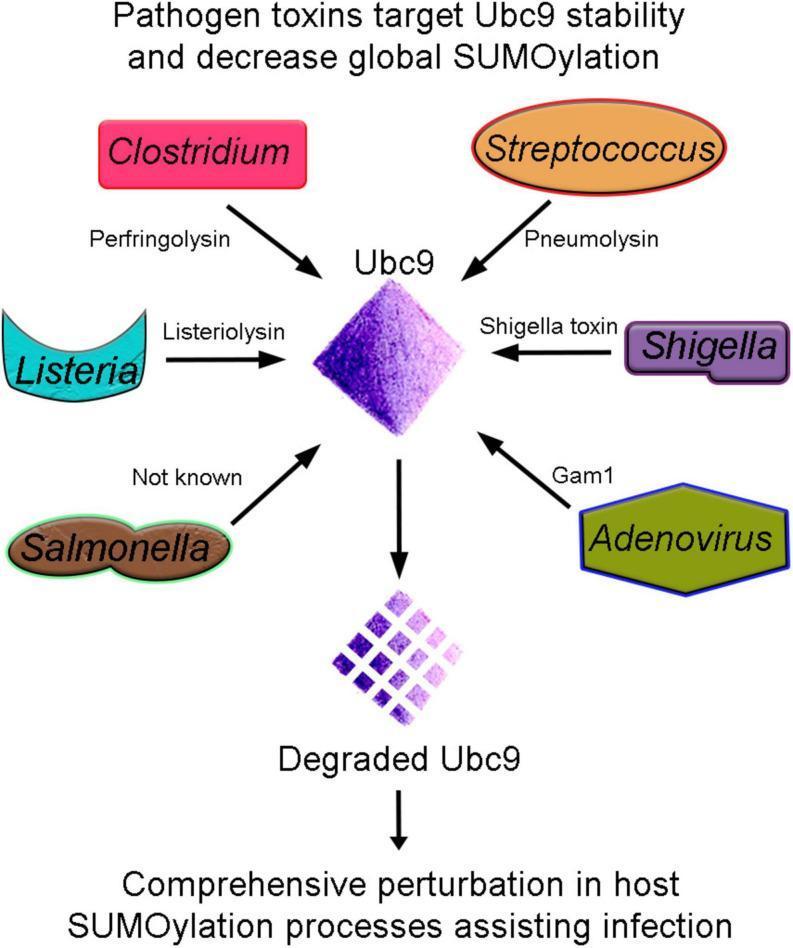
A pathophysiology diagram illustrating how various bacterial and viral pathogens target host Ubc9 stability to facilitate infection. Centrally, a purple diamond represents Ubc9, the essential E2 conjugating enzyme of the SUMOylation pathway. Surrounding Ubc9 are five bacterial genera (Clostridium, Streptococcus, Listeria, Shigella, and Salmonella) and one virus (Adenovirus), each connected by arrows indicating the secretion of specific toxins or proteins: Perfringolysin, Pneumolysin, Listeriolysin, Shigella toxin, and Gam1, respectively. A vertical downward arrow shows the transition from intact Ubc9 to a fragmented 'Degraded Ubc9' representation. The diagram concludes with a final stage labeled 'Comprehensive perturbation in host SUMOylation processes assisting infection,' demonstrating the clinical significance of Ubc9 degradation. This visual summary emphasizes the mechanism by which pathogens destabilize the host's cellular defense and signaling by compromising the unique E2 enzyme required for protein SUMOylation, thereby suppressing innate immune responses and promoting pathogenesis.
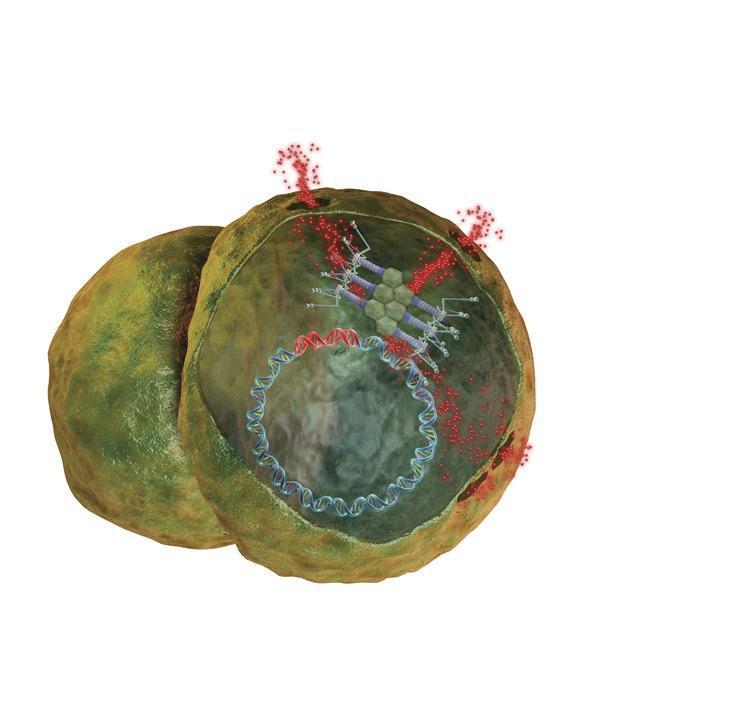
A pathophysiology diagram illustrating the mechanism of bacteriophage infection of Staphylococcus bacteria. The visual depicts two greenish-yellow, spherical cocci with irregular, textured surfaces. The rightmost bacterium is shown in a cross-sectional view, revealing its internal cavity and genetic material, represented as a circular double-helix DNA plasmid in blue and red. At the bacterial cell wall, a bacteriophage (virus) is shown as a complex, geometric structure with a polygonal head and leg-like appendages docked onto the surface. The diagram highlights the injection process, with red particles (viral genetic material) flowing from the phage into the bacterial cytoplasm and accumulating near the point of attachment. This image serves as an educational model for microbiology and infectious disease, specifically demonstrating viral transduction and the potential therapeutic use of phages against biofilms formed on medical devices like needleless intravenous connectors.
ls -la /tmp/workspace/ 2>/dev/null || mkdir -p /tmp/workspace && ls -la /tmp/workspace/
mkdir -p /tmp/workspace/med-revision && python3 -c "from reportlab.lib import colors; print('reportlab OK')"
Give me
What would you like me to give you?
hepatitis B serology markers HBsAg anti-HBs window period
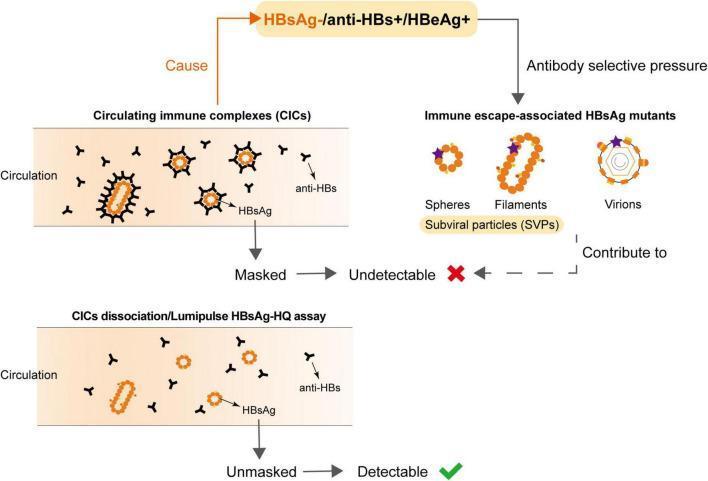
This pathophysiology diagram illustrates the mechanisms underlying undetectable Hepatitis B surface antigen (HBsAg) in patients who are HBeAg-positive and anti-HBs-positive. The diagram is divided into two primary pathways: the formation of Circulating Immune Complexes (CICs) and the emergence of HBsAg mutants. In the CIC pathway, HBsAg particles are shown in circulation bound by Y-shaped anti-HBs antibodies; this 'masking' of epitopes renders the antigen undetectable by standard assays. A lower panel demonstrates that chemical dissociation or specialized assays (e.g., Lumipulse HBsAg-HQ) can unmask these antigens, making them detectable. The second pathway shows 'Immune escape-associated HBsAg mutants' arising from antibody selective pressure. These are depicted as spheres, filaments (together termed subviral particles or SVPs), and complete virions with altered surface epitopes (marked by purple stars). Both CIC formation and mutant emergence contribute to the diagnostic challenge of occult Hepatitis B infection (OBI). This diagram is intended for intermediate to advanced medical education regarding HBV serology, diagnostic pitfalls, and immune escape mechanisms.
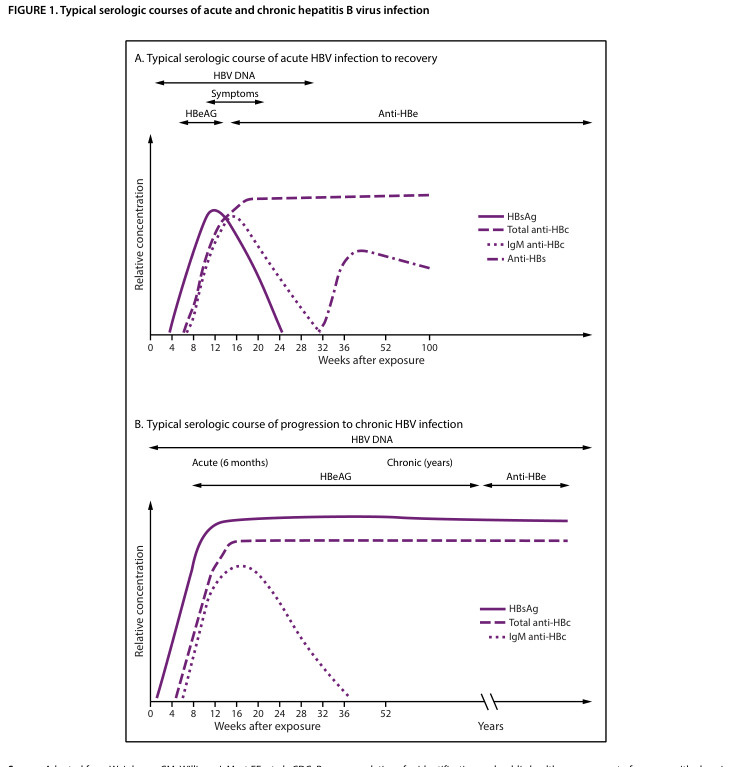
Summary : This figure presents two line plots showing the typical serologic courses of acute and chronic hepatitis B virus (HBV) infection, comparing the progression and recovery of serologic markers over time. line plot: # Panel A: Typical serologic course of acute HBV infection to recovery ## Title & Axes : • Title: "A. Typical serologic course of acute HBV infection to recovery" • X-axis: "Weeks after exposure" (tick labels: 0, 4, 8, 12, 16, 20, 24, 28, 32, 36, 52, 100) • Y-axis: "Relative concentration" (no explicit tick labels) • Additional timeline annotations: "HBV DNA", "Symptoms", "HBeAG", "Anti-HBe" (horizontal arrows above plot) ## Data Points : • HBsAg (solid line): Rises sharply after exposure, peaks around 8–12 weeks, then declines and disappears by ~24–28 weeks. • Total anti-HBc (dashed line): Rises after exposure, peaks around 16–20 weeks, remains elevated beyond 100 weeks. • IgM anti-HBc (dotted line): Rises after exposure, peaks around 12–16 weeks, declines and disappears by ~28–32 weeks. • Anti-HBs (long dashed line): Appears after ~24–28 weeks, rises and remains elevated beyond 100 weeks. ## Design Encodings : • HBsAg: solid purple line • Total anti-HBc: dashed purple line • IgM anti-HBc: dotted purple line • Anti-HBs: long dashed purple line • All lines plotted against the same axes; no log scale or error bars. ## Distribution & Trends : • HBsAg and IgM anti-HBc both show transient peaks and then decline. • Total anti-HBc and anti-HBs persist long-term after recovery. # Panel B: Typical serologic course of progression to chronic HBV infection ## Title & Axes : • Title: "B. Typical serologic course of progression to chronic HBV infection" • X-axis: "Weeks after exposure" (tick labels: 0, 4, 8, 12, 16, 20, 24, 28, 32, 36, 52), then "Years" (break in axis) • Y-axis: "Relative concentration" (no explicit tick labels) • Additional timeline annotations: "HBV DNA", "Acute (6 months)", "Chronic (years)", "HBeAG", "Anti-HBe" (horizontal arrows above plot) ## Data Points : • HBsAg (solid line): Rises after exposure, remains persistently elevated for years. • Total anti-HBc (dashed line): Rises after exposure, remains persistently elevated for years. • IgM anti-HBc (dotted line): Rises after exposure, peaks around 12–16 weeks, declines and disappears by ~28–32 weeks. ## Design Encodings : • HBsAg: solid purple line • Total anti-HBc: dashed purple line • IgM anti-HBc: dotted purple line • All lines plotted against the same axes; no log scale or error bars. ## Distribution & Trends : • HBsAg and total anti-HBc remain persistently elevated in chronic infection. • IgM anti-HBc is transient and disappears after the acute phase. # Analysis : • In acute HBV infection (Panel A), HBsAg and IgM anti-HBc are transient, while total anti-HBc and anti-HBs persist after recovery, indicating resolution and immunity. • In chronic HBV infection (Panel B), HBsAg and total anti-HBc remain persistently elevated for years, while IgM anti-HBc is only present during the acute phase, indicating ongoing infection without resolution. • The presence and duration of serologic markers distinguish acute recovery from progression to chronic infection.
malaria Plasmodium life cycle mosquito red blood cell
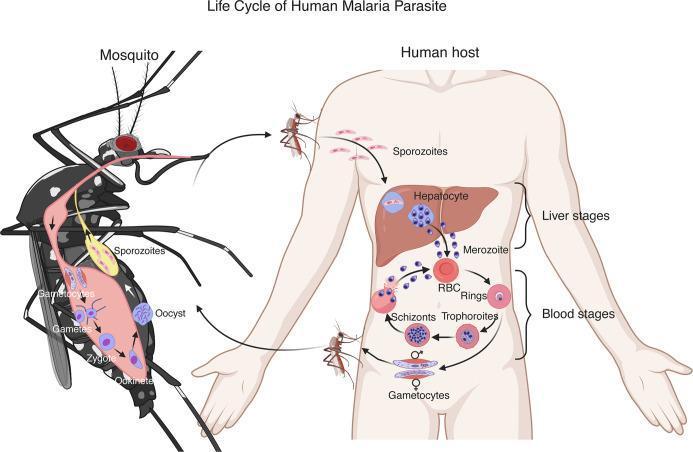
A pathophysiology diagram illustrating the complex life cycle of the Plasmodium parasite, responsible for malaria, between a female Anopheles mosquito and a human host. The cycle is divided into two primary environments. Within the human host, the parasite undergoes liver stages, where sporozoites infect hepatocytes and multiply into merozoites. This is followed by the blood stages, an asexual intraerythrocytic cycle where merozoites infect red blood cells (RBCs) and progress through ring, trophozoite, and schizont stages before rupturing to infect new RBCs. Sexual differentiation occurs when some merozoites develop into male and female gametocytes. The mosquito stages begin when a mosquito ingests these gametocytes during a blood meal. Within the mosquito's midgut and salivary glands, the parasite undergoes sexual reproduction and development, progressing from gametes to zygote, ookinete, and oocyst. The mature oocyst releases sporozoites that migrate to the mosquito's salivary glands for transmission back to a human host, completing the cycle. This educational diagram is essential for understanding parasitology, infectious disease transmission, and the biological targets for malaria treatment and prevention.
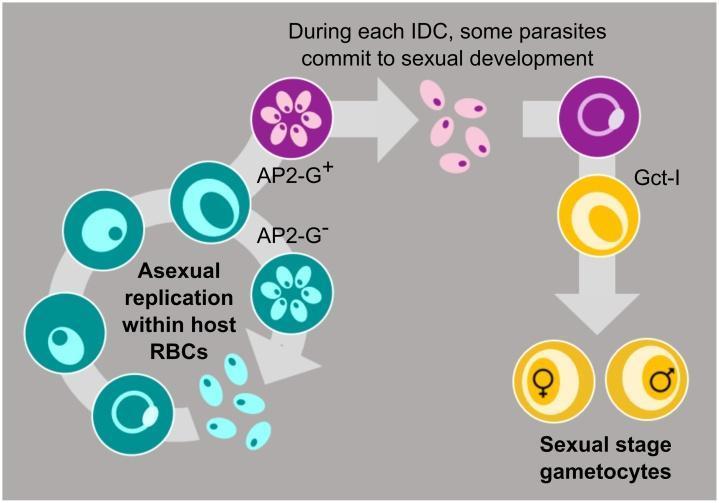
A medical educational diagram illustrating the Intra-erythrocytic Development Cycle (IDC) of the malaria parasite (Plasmodium spp.). The flowchart depicts two divergent pathways within a host red blood cell (RBC). The primary loop shows the asexual replication cycle, where parasites (teal circles) undergo maturation from a single parasite body into schizonts with multiple internal bodies, eventually bursting to release merozoites for further RBC infection. A secondary pathway illustrates sexual commitment, marked by the expression of the transcription factor AP2-G (represented by purple circles). Following this commitment, the parasites differentiate into sexual stages called gametocytes (yellow circles). The final stage of this differentiation demonstrates the formation of distinct male and female gametocytes, identified by gender symbols. The diagram highlights the biological decision-making process between continued asexual multiplication for within-host survival and the production of gametocytes for transmission to the mosquito vector, a key concept in malaria pathophysiology and lifecycle research.
antibiotic mechanism of action cell wall inhibition protein synthesis
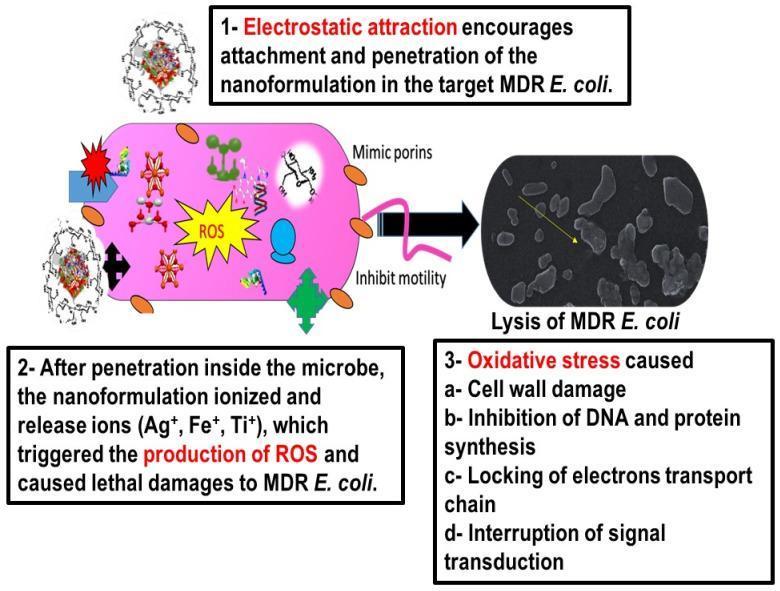
This infographic and diagnostic image set illustrates the antibacterial mechanism of a CIP-Ag/TiO2/Fe2O3/CS nanoformulation against multi-drug resistant (MDR) E. coli. The left side features a pathophysiology diagram depicting a bacterial cell undergoing the following stages: 1) Electrostatic attraction between the positively charged nanoformulation and the negatively charged cell wall leading to attachment and penetration; 2) Ionization and release of Ag+, Fe+, and Ti+ ions intracellularly, triggering Reactive Oxygen Species (ROS) production. Annotated mechanisms include porin mimicry, motility inhibition, and lethal damage to intracellular components. The right side contains an electron microscopy (FESEM) image labeled 'Lysis of MDR E. coli,' showing lysed, deflated, and irregularly shaped bacterial cells with disrupted membrane integrity. A corresponding text box summarizes oxidative stress outcomes: cell wall damage, inhibition of DNA and protein synthesis, blocking of the electron transport chain, and interruption of signal transduction. This educational content demonstrates targeted drug delivery and bactericidal activity relevant to treating antibiotic-resistant infections like bovine or human mastitis.
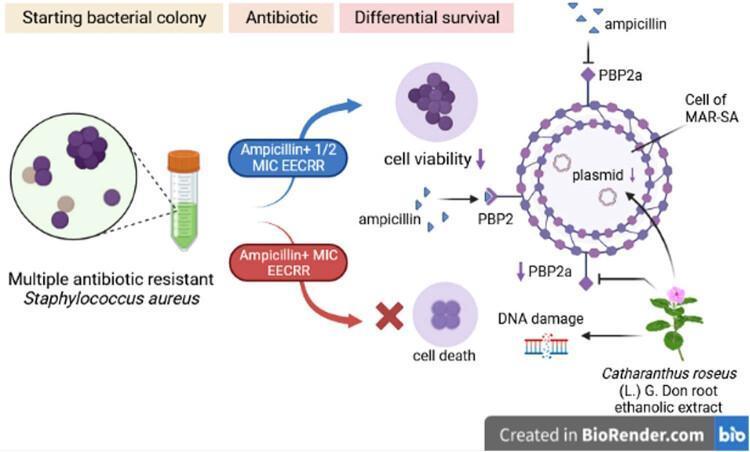
A medical pathophysiology diagram illustrating the mechanism of action of Catharanthus roseus root ethanolic extract (EECRR) in sensitizing multiple antibiotic-resistant Staphylococcus aureus (MAR-SA) to ampicillin. The flowchart transitions from left to right, starting with a bacterial colony of MAR-SA and a test tube representing the extract. It branches into two treatment pathways: 'Ampicillin + 1/2 MIC EECRR', which results in decreased cell viability, and 'Ampicillin + MIC EECRR', which leads to cell death (indicated by a red cross). The right side of the diagram provides a molecular level illustration of a MAR-SA cell. It demonstrates that the EECRR treatment inhibits penicillin-binding protein 2a (PBP2a), which normally blocks ampicillin. By suppressing PBP2a expression and causing plasmid DNA damage, the extract allows ampicillin to bind to PBP2, disrupting the bacterial cell wall integrity. Key labels include PBP2a, PBP2, ampicillin, plasmid, and DNA damage. This visual summarizes an antimicrobial research study on overcoming antibiotic resistance using botanical extracts.
HIV AIDS opportunistic infection CD4 count spectrum
![<table><thead><tr><th>Opportunistic Infection</th><th>Preferred Therapy</th><th>Alternative Therapy</th><th>Other Comments</th></tr></thead><tbody><tr><td>Bacterial Enteric Infections</td><td>Empiric Therapy Pending Definitive Diagnosis</td><td>For People With HIV and CD4 Count >500 Cells/mm³, 1–2 Days of Loose Stool Without Fever or Blood in Stool<br><br>• Oral hydration, no further workup, and no antibiotics<br><br>For People With HIV and CD4 Count 200–500 Cells/mm³ With Diarrhea Severe Enough to Compromise Quality of Life or the Ability to Work<br><br>• Azithromycin 500 mg PO daily for 5 days (BIII), or<br><br>• Ciprofloxacin 500–750 mg PO every 12 hours for 5 days (BIII)<br><br>For People With HIV and Severe Disease (e.g., CD4 Count <200 Cells/mm³ or Concomitant AIDS-Defining Illness and With Clinically Severe Diarrhea [≥6 Liquid Stools Per Day or Bloody Stool and/or Accompanying Fever or Chills])<br><br>• Hospitalization for diagnostic evaluation and IV antibiotics<br><br>• Ceftriaxone IV 1–2 g every 24 hours (BIII)<br><br>Note: If Campylobacter or Shigella bacteremia is suspected, a carbapenem is preferred (BIII).<br><br>Therapy and duration should be adjusted based on microbiology and antibiotic sensitivity results.<br><br>If no pathogen is identified and the patient recovers quickly, 5 days of therapy is recommended.</td><td></td><td>Diagnostic fecal specimens should be obtained before initiation of empiric antimicrobial therapy.<br><br>If a pathogen is identified, antibiotic susceptibilities should be performed to confirm and inform antibiotic choices, given increased reports of antibiotic resistance.<br><br>Oral or IV rehydration (if indicated) should be given to patients with diarrhea (AIII).<br><br>Antimotility agents should be avoided if there is concern about inflammatory diarrhea, including CDI (BIII).<br><br>Risk of bacteremia increases with decreasing CD4 count.<br><br>If no clinical response is observed after 3–4 days, consider a follow-up stool culture with antibiotic susceptibility testing or alternative diagnostic tests (e.g., toxin assays, molecular testing) to evaluate alternative diagnoses, antibiotic resistance, or drug–drug interaction (BIII).<br><br>MSM may be at increased risk for antibiotic resistant enteric infections.</td></tr></tbody></table>](https://cdn.orris.care/cdss_images/GLGCA_1986236_1763357080413_d11ec201-325e-4718-b8d7-2bbcd266f6c1.png)
<table><thead><tr><th>Opportunistic Infection</th><th>Preferred Therapy</th><th>Alternative Therapy</th><th>Other Comments</th></tr></thead><tbody><tr><td>Bacterial Enteric Infections</td><td>Empiric Therapy Pending Definitive Diagnosis</td><td>For People With HIV and CD4 Count >500 Cells/mm³, 1–2 Days of Loose Stool Without Fever or Blood in Stool<br><br>• Oral hydration, no further workup, and no antibiotics<br><br>For People With HIV and CD4 Count 200–500 Cells/mm³ With Diarrhea Severe Enough to Compromise Quality of Life or the Ability to Work<br><br>• Azithromycin 500 mg PO daily for 5 days (BIII), or<br><br>• Ciprofloxacin 500–750 mg PO every 12 hours for 5 days (BIII)<br><br>For People With HIV and Severe Disease (e.g., CD4 Count <200 Cells/mm³ or Concomitant AIDS-Defining Illness and With Clinically Severe Diarrhea [≥6 Liquid Stools Per Day or Bloody Stool and/or Accompanying Fever or Chills])<br><br>• Hospitalization for diagnostic evaluation and IV antibiotics<br><br>• Ceftriaxone IV 1–2 g every 24 hours (BIII)<br><br>Note: If Campylobacter or Shigella bacteremia is suspected, a carbapenem is preferred (BIII).<br><br>Therapy and duration should be adjusted based on microbiology and antibiotic sensitivity results.<br><br>If no pathogen is identified and the patient recovers quickly, 5 days of therapy is recommended.</td><td></td><td>Diagnostic fecal specimens should be obtained before initiation of empiric antimicrobial therapy.<br><br>If a pathogen is identified, antibiotic susceptibilities should be performed to confirm and inform antibiotic choices, given increased reports of antibiotic resistance.<br><br>Oral or IV rehydration (if indicated) should be given to patients with diarrhea (AIII).<br><br>Antimotility agents should be avoided if there is concern about inflammatory diarrhea, including CDI (BIII).<br><br>Risk of bacteremia increases with decreasing CD4 count.<br><br>If no clinical response is observed after 3–4 days, consider a follow-up stool culture with antibiotic susceptibility testing or alternative diagnostic tests (e.g., toxin assays, molecular testing) to evaluate alternative diagnoses, antibiotic resistance, or drug–drug interaction (BIII).<br><br>MSM may be at increased risk for antibiotic resistant enteric infections.</td></tr></tbody></table>
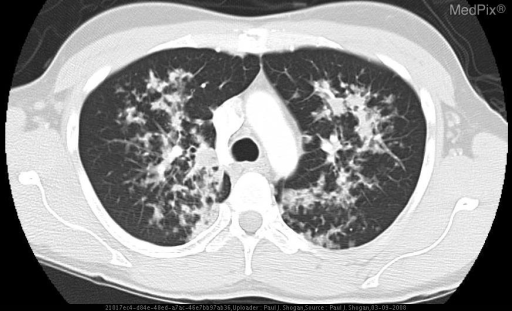
**Imaging Modality:** Contrast-enhanced axial Computed Tomography (CT) of the chest, displayed in lung window settings. **Anatomical Region:** Upper thoracic cavity at the level of the aortic arch and tracheal bifurcation. **Observed Pathology:** The image demonstrates bilateral, symmetric, and patchy-to-confluent air space opacities. The distribution is predominantly central and perihilar within the upper lung lobes. These findings are characterized by ground-glass attenuation and consolidation with ill-defined borders. **Characteristic Visual Features:** - **Air Bronchograms:** Visible within the areas of confluent consolidation. - **Distribution:** Central/perihilar "bat-wing" pattern with relative sparing of the extreme peripheral/subpleural lung parenchyma. - **Associated Features:** There is an absence of significant pleural effusions or overt mediastinal lymphadenopathy at this level. **Clinical Context:** In the setting of severe immunocompromise (HIV/AIDS with low CD4 count), these radiologic findings are highly suggestive of opportunistic infection, most notably *Pneumocystis jirovecii* pneumonia (PCP). **Differentiating Features:** The central upper lobe predominance and lack of pleural fluid help distinguish this pattern from typical bacterial pneumonia or cardiogenic pulmonary edema.
🦠 MICROBIOLOGY — LAST MINUTE REVISION NOTES
FMGE | NEET PG | INICET | All PYQs (2021-2026)
10-Page Comprehensive Notes • Image-Based Q Highlights
📄 PAGE 1 - BACTERIOLOGY BASICS: CELL WALL, STAINS & CLASSIFICATION
Gram Stain - The Foundation ⭐⭐
| Feature | Gram-Positive | Gram-Negative |
|---|---|---|
| Cell wall | Thick peptidoglycan (20-80nm) | Thin peptidoglycan + outer membrane (LPS) |
| Color after stain | Purple/Violet (crystal violet retained) | Pink/Red (safranin counterstain) |
| Outer membrane | Absent | Present (contains LPS = endotoxin) |
| Teichoic acids | Present | Absent |
| Periplasmic space | Absent | Present |
- Crystal violet (primary stain)
- Gram's iodine (mordant - fixes dye)
- Acetone-alcohol (decolorizer) - Gram-negative lose the stain
- Safranin (counterstain - stains Gram-negative pink)
Special Staining Methods ⭐ HIGH-YIELD TABLE
| Stain | Organism | Color seen |
|---|---|---|
| Ziehl-Neelsen (ZN) / Acid-Fast | Mycobacterium (TB, Leprosy), Nocardia, Cryptosporidium | Red bacilli on blue background |
| Modified ZN | Cryptosporidium, Isospora, Cyclospora | Red oocysts on green background |
| Albert's stain | Corynebacterium diphtheriae (metachromatic granules) | Black/dark blue granules on green |
| India Ink | Cryptococcus neoformans | Clear halo (capsule) against black background |
| Giemsa | Malaria, Leishmania, Rickettsia, Borrelia, Trypanosoma | |
| Silver stain (Grocott/GMS) | Fungi (Aspergillus, PCP) | Black fungal elements on green |
| PAS (Periodic Acid-Schiff) | Fungi, Whipple's (Tropheryma), Glycogen | Magenta/pink |
| Wayson's stain | Yersinia pestis (plague) | Safety pin appearance |
| McFadyean's stain | Anthrax (Bacillus anthracis) | Blue bacilli in pink capsule |
Cell Wall-Deficient Organisms (PYQ Trap) ⭐
| Organism | Feature |
|---|---|
| Mycoplasma | No cell wall; resistant to penicillin; smallest free-living organism |
| L-forms (L-phase variants) | Induced by beta-lactams; can revert |
| Protoplast | Gram-positive + lysozyme = complete removal of cell wall |
| Spheroplast | Gram-negative + lysozyme = partial cell wall removal |
⭐ Mycoplasma pneumoniae: Atypical pneumonia; cold agglutinins (IgM vs RBCs, I antigen); "walking pneumonia"; treat with macrolides (NOT beta-lactams)
📄 PAGE 2 - GRAM-POSITIVE COCCI: STAPHYLOCOCCUS & STREPTOCOCCUS
Staphylococcus Species - Key Differentials ⭐⭐
| Feature | S. aureus | S. epidermidis | S. saprophyticus |
|---|---|---|---|
| Coagulase | Positive | Negative | Negative |
| Novobiocin | Sensitive | Sensitive | Resistant |
| Mannitol fermentation | Yes | No | No |
| Clinical relevance | Boils, MRSA, food poisoning, TSS | Prosthetic valve IE, catheter infections | UTI in young women |
Staphylococcus aureus Virulence Factors ⭐ TOP PYQ TOPIC
| Toxin/Factor | Mechanism | Disease |
|---|---|---|
| Protein A | Binds Fc of IgG (anti-opsonin) | Immune evasion |
| Coagulase | Fibrinogen → fibrin clot | Abscess formation |
| TSST-1 (Toxic shock syndrome toxin) | Superantigen → massive cytokine release | Toxic Shock Syndrome |
| Exfoliatin (ETs A & B) | Serine protease; cleaves desmoglein-1 | Scalded Skin Syndrome (SSSS) |
| Enterotoxin (A-E, G) | Superantigen; heat-stable | Food poisoning (preformed toxin) |
| Alpha toxin | Pore-forming toxin in RBCs | Hemolysis, necrosis |
| Leucocidin (PVL) | Pore-forming; destroys PMNs | Necrotizing pneumonia, furuncles |
⭐ MRSA: Resistant to all beta-lactams due to altered PBP2a (encoded by mecA gene); treat with Vancomycin or Linezolid or Daptomycin ⭐ VRSA: Vancomycin-resistant S. aureus - vanA gene from Enterococcus
Streptococcus Classification ⭐
| Group | Species | Hemolysis | Key disease |
|---|---|---|---|
| Group A (Lancefield) | S. pyogenes | β-hemolytic | Pharyngitis, Rheumatic fever, PSGN, impetigo, scarlet fever |
| Group B | S. agalactiae | β-hemolytic | Neonatal meningitis & sepsis, postpartum endometritis |
| Group D | Enterococcus, S. bovis | Variable | UTI, IE (E. faecalis); colon cancer marker (S. bovis/gallolyticus) |
| Viridans | S. mutans, S. mitis, S. sanguis | α-hemolytic | Dental caries, Subacute IE |
| Pneumococcus | S. pneumoniae | α-hemolytic | Pneumonia, meningitis, otitis media, sinusitis |
S. pyogenes Virulence ⭐
| Factor | Function |
|---|---|
| M protein | Anti-phagocytic; type-specific immunity; molecular mimicry → RF |
| Streptolysin O (SLO) | Oxygen-labile; antigenic → ASO titre ↑ in RF |
| Streptolysin S (SLS) | Oxygen-stable; NOT antigenic; causes β-hemolysis on plates |
| Streptokinase | Lyses fibrin; spreads infection |
| Hyaluronidase | "Spreading factor"; degrades CT matrix |
| Erythrogenic toxin (SPE) | Superantigen; causes scarlet fever rash |
| DNAase B | ADB rises in PSGN (not in RF) - used diagnostically |
⭐ Rheumatic Fever: Only GROUP A Strep (NOT Group B/C/G); ASO titre elevated; only PHARYNGEAL infection (NOT skin) ⭐ PSGN: Both pharyngeal AND skin infection; anti-DNAase B rises; low complement (C3)
📄 PAGE 3 - GRAM-POSITIVE RODS & ANAEROBES
Spore-Forming Gram-Positive Rods ⭐⭐
| Organism | Spore | Toxin | Disease | Key Feature |
|---|---|---|---|---|
| B. anthracis | Central; no exosporium in body | Anthrax toxin (PA + EF + LF) | Cutaneous (eschar), Pulmonary (Woolsorter's), GI anthrax | Non-motile; capsule of D-glutamate (anti-phagocytic) |
| B. cereus | - | Emetic (heat-stable) / Diarrheal (heat-labile) | Food poisoning; Fried rice (emetic); meats, vegetables (diarrheal) | |
| C. tetani | Drumstick (terminal) | Tetanospasmin (blocks inhibitory NT - glycine/GABA) | Tetanus: spastic paralysis, trismus (lockjaw), risus sardonicus | Blocks inhibitory interneurons |
| C. botulinum | Subterminal | Botulinum toxin (blocks ACh release at NMJ) | Flaccid paralysis; infant botulism (honey) | Most potent toxin known |
| C. perfringens | Subterminal | Alpha toxin (lecithinase/phospholipase C) | Gas gangrene, food poisoning, necrotizing enteritis | Double zone of hemolysis on blood agar |
| C. difficile | - | Toxin A (enterotoxin) + Toxin B (cytotoxin) | Pseudomembranous colitis (after antibiotics) | Treat: Oral Vancomycin or Fidaxomicin |
⭐ Tetanospasmin = SPASTIC paralysis (blocks INHIBITORY neurons) ⭐ Botulinum toxin = FLACCID paralysis (blocks EXCITATORY ACh release) ⭐ Nagler's reaction: C. perfringens produces alpha toxin → opalescence on egg yolk agar
Non-Sporing Gram-Positive Rods
| Organism | Key Feature | Disease |
|---|---|---|
| Corynebacterium diphtheriae | Albert's stain → metachromatic granules; Chinese letter arrangement; Tellurite medium | Diphtheria; pseudomembrane; exotoxin (inhibits EF-2 via ADP-ribosylation) |
| Listeria monocytogenes | Tumbling motility; cold enrichment; CAMP test +ve; actin rockets | Meningitis in neonates/immunocompromised; foodborne (unpasteurized cheese) |
| Actinomyces israelii | Gram-positive; sulfur granules; anaerobic | Cervicofacial actinomycosis (lumpy jaw) |
| Nocardia | Weakly acid-fast; aerobic | Pulmonary/brain abscess in immunocompromised; treat with Sulfonamides |
⭐ Diphtheria toxin: Single polypeptide (B binds, A fragment = active); fragment A ADP-ribosylates EF-2 → halts protein synthesis in ALL eukaryotic cells ⭐ Listeria: Only gram-positive organism with endotoxin-like LTA; grows at 4°C (cold enrichment used)
📄 PAGE 4 - GRAM-NEGATIVE BACTERIA
Gram-Negative Cocci ⭐
| Organism | Key Tests | Disease | Treatment |
|---|---|---|---|
| Neisseria gonorrhoeae | Oxidase +ve; DNASE -ve; no polysaccharide capsule; Thayer-Martin medium | Urethritis, cervicitis, PID, ophthalmia neonatorum, DGI | Ceftriaxone + Azithromycin |
| Neisseria meningitidis | Oxidase +ve; capsule (groups A,B,C,Y,W135); ferments maltose + glucose | Meningitis, Waterhouse-Friderichsen syndrome | Penicillin G; prophylaxis: Rifampicin or Ciprofloxacin |
⭐ Gonococcus vs Meningococcus: Both ferment glucose; ONLY meningococcus ferments maltose (mnemonic: "Meningococcus = Maltose") ⭐ Waterhouse-Friderichsen syndrome: Bilateral adrenal hemorrhage, DIC, purpuric rash = N. meningitidis
Enterobacteriaceae (Gram-Negative Rods) ⭐⭐
| Organism | IMViC | Special Feature | Disease |
|---|---|---|---|
| E. coli | ++-- | Commonest cause UTI; ETEC = traveler's diarrhea; EHEC (O157:H7) = HUS | UTI, meningitis (neonates), traveler's diarrhea, HUS |
| Klebsiella | -+++ | Mucoid colonies; "brick dust" appearance; Friedländer's pneumonia | Pneumonia (upper lobe, alcoholics), UTI, nosocomial |
| Proteus | -++- | Urease +ve; swarming; struvite stones | UTI, renal stones |
| Salmonella typhi | - | Vi antigen; Widal test; Typhoid rose spots; intracellular | Typhoid fever |
| Shigella | - | No H antigen; non-motile; no gas; dysentery; Shiga toxin | Bacillary dysentery; SMALLEST infective dose |
| Yersinia pestis | - | Wayson's stain (safety pin); flea vector (Xenopsylla cheopis) | Plague: Bubonic, Pneumonic, Septicemic |
| Vibrio cholerae | - | Comma-shaped; string test +ve; Rice water stools | Cholera: CT toxin (↑↑ cAMP → Cl⁻/H₂O secretion) |
⭐ IMViC = Indole, Methyl Red, Voges-Proskauer, Citrate ⭐ E. coli IMViC: + + - - ; Klebsiella IMViC: - - + +
Gram-Negative Non-Fermenters
| Organism | Key Feature | Disease |
|---|---|---|
| Pseudomonas aeruginosa | Oxidase +ve; blue-green pigment (pyocyanin + pyoverdin); fruity grape odor; grows at 42°C | Burns, CF (mucoid), HAP, otitis externa ("swimmer's ear"), UTI |
| Acinetobacter | Oxidase -ve; coccobacillus; MRAB | HAP/VAP; nosocomial |
| Burkholderia pseudomallei | Bipolar staining (safety pin); Whitmore's disease | Melioidosis (SE Asia) |
⭐ Pseudomonas: INTRINSICALLY resistant to many antibiotics; treated with Pip-Taz, Carbapenems, Ceftazidime + Aminoglycoside
📄 PAGE 5 - MYCOBACTERIOLOGY & SPIROCHETES
Mycobacterium tuberculosis ⭐⭐ (Most tested in PG exams)
- Acid-fast bacillus (AFB): Mycolic acid in cell wall binds carbol fuchsin; resists decolorization by acid
- Slow grower (16-20 hr doubling time); culture takes 6-8 weeks
- Lowenstein-Jensen (LJ) medium: Buff/cream colored "Rough, Tough, Buff" colonies
- Obligate aerobe; grows best at 37°C
- Niacin test: Only MTB among mycobacteria is niacin +ve ⭐
- Type IV hypersensitivity (DTH); read at 48-72 hours
- Induration ≥10mm = positive (general population); ≥5mm (HIV, immunocompromised, close contact)
- False negative: miliary TB, severe malnutrition, measles, immunosuppression
| Drug | Mechanism | Key Side Effect |
|---|---|---|
| Isoniazid (H) | Inhibits mycolic acid synthesis (InhA) | Hepatotoxicity, peripheral neuropathy (↑ with B6 deficiency), SLE-like |
| Rifampicin (R) | Inhibits DNA-dependent RNA polymerase | Hepatotoxicity, orange body fluids, enzyme inducer (↓ OCP efficacy) |
| Pyrazinamide (Z) | Disrupts membrane potential (acidic pH) | Hepatotoxicity, hyperuricemia, arthralgia |
| Ethambutol (E) | Inhibits arabinosyl transferase (arabinogalactan) | Optic neuritis (red-green color blindness) - RETROBULBAR neuritis |
| Streptomycin (S) | Aminoglycoside; 30S ribosome | Ototoxicity (vestibular > cochlear), nephrotoxicity; NOT in pregnancy |
⭐ 2HRZE / 4HR = Standard ATT regimen (2 months intensive + 4 months continuation) ⭐ Rifampicin = Strongest sterilizing drug (kills dormant bacilli in macrophages) ⭐ Drug most commonly causing hepatotoxicity: Pyrazinamide > Isoniazid > Rifampicin
Leprosy (Hansen's Disease) ⭐
| Feature | Tuberculoid (TT) | Lepromatous (LL) |
|---|---|---|
| Immunity | High (cell-mediated) | Low (Th2 predominant) |
| Bacilli (bacterial index) | Very few (paucibacillary) | Many (multibacillary) |
| Lepromin test | Positive | Negative |
| Nerve damage | Asymmetric; severe | Symmetric; glove & stocking |
| Skin lesions | Few, well-defined, hypoesthetic | Numerous, diffuse, leonine facies |
| Nasal smear | Negative | Positive (gold standard for LL) |
⭐ M. leprae: Grows at 30°C (cooler extremities); cannot be cultured in vitro; grows in armadillo footpads ⭐ ENL (Erythema Nodosum Leprosum) = Type II lepra reaction; in LL/BL; treat with Thalidomide ⭐ Reversal reaction (Type I) = Type IV HSR; in BT/BL; treat with Steroids
Spirochetes ⭐
| Organism | Disease | Key Test | Treatment |
|---|---|---|---|
| Treponema pallidum | Syphilis | Dark field microscopy; VDRL (non-specific); FTA-ABS (specific) | Penicillin G |
| Borrelia burgdorferi | Lyme disease (tick Ixodes) | Bull's-eye rash (ECM); Giemsa stain | Doxycycline |
| Borrelia recurrentis | Relapsing fever (louse-borne) | Giemsa/Wright stain; antigenic variation | Tetracycline |
| Leptospira | Weil's disease (jaundice + renal failure) | Dark field; MSAT test | Penicillin/Doxycycline |
📄 PAGE 6 - VIROLOGY: CLASSIFICATION & HIGH-YIELD VIRUSES
Virus Classification Basics ⭐
| Family | Envelope | Symmetry | Example |
|---|---|---|---|
| Herpesviridae | Yes | Icosahedral | HSV 1&2, VZV, EBV, CMV, HHV-6,7,8 |
| Poxviridae | Yes | Complex | Smallpox, Molluscum, Monkeypox |
| Parvoviridae | No (naked) | Icosahedral | Parvovirus B19 |
| Adenoviridae | No (naked) | Icosahedral | Adenovirus |
| Hepadnaviridae | Yes | Icosahedral | HBV |
| Papillomaviridae | No | Icosahedral | HPV |
| Polyomaviridae | No | Icosahedral | JC virus (PML), BK virus |
| Family | Strand | Envelope | Example |
|---|---|---|---|
| Orthomyxoviridae | -ve ssRNA | Yes | Influenza A, B |
| Paramyxoviridae | -ve ssRNA | Yes | Measles, Mumps, RSV, Parainfluenza |
| Rhabdoviridae | -ve ssRNA | Yes | Rabies |
| Filoviridae | -ve ssRNA | Yes | Ebola, Marburg |
| Retroviridae | +ve ssRNA (diploid) | Yes | HIV-1, HIV-2, HTLV |
| Picornaviridae | +ve ssRNA | No | Polio, HAV, Rhinovirus, Coxsackie |
| Flaviviridae | +ve ssRNA | Yes | HCV, Dengue, Zika, West Nile, Yellow fever |
| Togaviridae | +ve ssRNA | Yes | Rubella, Chikungunya |
| Reoviridae | dsRNA | No | Rotavirus (most common viral diarrhea in children) |
| Caliciviridae | +ve ssRNA | No | Norovirus (most common viral diarrhea in adults) |
| Coronaviridae | +ve ssRNA | Yes | SARS-CoV-2, MERS, HCoV |
⭐ Naked (non-enveloped) viruses: PARVO, PAPOVA, ADENO, PICORNA, ROTA, CALICI, HEPADNA (partially) ⭐ Only dsRNA virus of humans: Rotavirus (Reoviridae) ⭐ Smallest virus: Parvovirus B19; Largest virus: Poxvirus (can be seen by light microscopy)
Herpesviruses ⭐⭐ HIGH YIELD
| Virus | Latency site | Disease | Key Feature |
|---|---|---|---|
| HSV-1 | Trigeminal ganglion | Oral herpes, herpes encephalitis (temporal lobe) | Cowdry type A inclusions; treat with Acyclovir |
| HSV-2 | Sacral ganglion | Genital herpes, neonatal herpes | |
| VZV | Dorsal root ganglion | Chickenpox (primary), Zoster (reactivation) | Dew drops on rose petal |
| EBV | B lymphocytes | Infectious mononucleosis; Burkitt lymphoma; NPC; Hodgkin's | Downey cells; Paul-Bunnell (heterophile) test +ve |
| CMV | WBCs, epithelial cells | Congenital CMV (most common congenital infection); retinitis in AIDS | "Owl eye" inclusions; Ganciclovir |
| HHV-6 | T lymphocytes | Roseola infantum (6th disease; Exanthem subitum) | High fever → rash as fever breaks |
| HHV-8 | - | Kaposi's sarcoma (AIDS-defining); Castleman's | Latent in KS cells |
⭐ Herpes simplex encephalitis: Most common cause of sporadic viral encephalitis; temporal lobe; treat with IV Acyclovir ⭐ Infectious mono triad: Fever + Pharyngitis + Lymphadenopathy (posterior cervical most characteristic)
📄 PAGE 7 - HIV & HEPATITIS VIRUSES
HIV Virology ⭐⭐
- Attachment: gp120 binds CD4 + CCR5/CXCR4 (Maraviroc blocks CCR5)
- Fusion: gp41 mediates membrane fusion (Enfuvirtide/T-20 blocks)
- Reverse transcription: RNA → DNA (NRTIs, NNRTIs block)
- Integration: DNA integrates into host genome (Integrase inhibitors block = raltegravir/dolutegravir)
- Transcription & translation
- Protease cleavage (Protease inhibitors block = ritonavir, lopinavir)
- Budding
| CD4 Count | Opportunistic Infection |
|---|---|
| <500 | Oral candidiasis, Kaposi's sarcoma, Herpes zoster |
| <200 | PCP (Pneumocystis pneumonia), Cryptococcal meningitis, Toxoplasma encephalitis |
| <100 | CMV retinitis, Disseminated MAC, Cryptosporidiosis |
| <50 | Disseminated CMV, CNS lymphoma |
⭐ PCP prophylaxis: TMP-SMX when CD4 <200 ⭐ Most common cause of meningitis in AIDS: Cryptococcus neoformans ⭐ Most common CNS mass lesion in AIDS: Toxoplasma gondii (ring-enhancing lesions)
Hepatitis Viruses ⭐⭐ CRITICAL TABLE
| Virus | Family | Genome | Transmission | Chronic? | Key |
|---|---|---|---|---|---|
| HAV | Picornavirus | +ssRNA | Feco-oral | No | Self-limiting; vaccine available |
| HBV | Hepadnavirus | Partly dsDNA | Blood/sexual/vertical | Yes (10%) | HBsAg, HBeAg, anti-HBc; Dane particle = complete virion |
| HCV | Flavivirus | +ssRNA | Blood | Yes (70-80%) | Most common cause of post-transfusion hepatitis; Cirrhosis/HCC |
| HDV | Deltavirus | -ssRNA | Blood (only with HBV) | Yes (superinfection) | Needs HBsAg to assemble (satellite virus) |
| HEV | Hepevirus | +ssRNA | Feco-oral | No | High mortality in pregnancy (20-25%) |
Hepatitis B Serology - The Most Tested Concept ⭐⭐
| Marker | Meaning |
|---|---|
| HBsAg | Active infection (acute or chronic) |
| Anti-HBs | Immunity (vaccination or resolved infection) |
| HBeAg | Active viral replication; high infectivity |
| Anti-HBe | Reduced infectivity; seroconversion |
| IgM anti-HBc | ACUTE infection ⭐ (including window period) |
| IgG anti-HBc | Past or chronic infection |
| HBV DNA | Most sensitive marker of active replication |
⭐ Window period: HBsAg negative, Anti-HBs negative → ONLY IgM anti-HBc is positive - the key diagnostic marker ⭐ Vaccination: Only anti-HBs positive (NO anti-HBc, since no core protein exposure)
📄 PAGE 8 - RESPIRATORY & OTHER HIGH-YIELD VIRUSES
Influenza Virus ⭐⭐
- Orthomyxovirus; -ve ssRNA; segmented genome (8 segments)
- Envelope proteins: Hemagglutinin (HA) - attachment; Neuraminidase (NA) - release
- Antigenic drift: Minor changes in HA/NA; causes epidemics; point mutations
- Antigenic shift: Major change; reassortment of gene segments; causes pandemics
- Replicates in nucleus (unique among RNA viruses!)
- Treatment: Oseltamivir/Zanamivir (NA inhibitors); Amantadine (M2 channel - only Influenza A)
Measles (Rubeola) vs Rubella ⭐
| Feature | Measles (Rubeola) | Rubella |
|---|---|---|
| Virus | Paramyxovirus | Togavirus |
| Rash | Starts on face/hairline → spreads downward; maculopapular | Milder; same direction; gone in 3 days |
| Enanthem | Koplik spots (pathognomonic; inner cheek) | Forchheimer spots (soft palate) |
| Complications | Encephalitis, SSPE, pneumonia, giant cell pneumonia (Hecht's) | Congenital rubella syndrome (cataracts, PDA, deafness) |
| Cells | Warthin-Finkeldey giant cells | - |
⭐ SSPE (Subacute Sclerosing Panencephalitis): Late complication of measles (7-10 years later); defective measles virus; treat with Isoprinosine; EEG: burst suppression pattern
Rabies Virus ⭐
- Rhabdovirus (-ve ssRNA; bullet-shaped)
- Travels retrograde along peripheral nerves to brain
- Incubation: 1-3 months (variable based on site)
- Negri bodies = pathognomonic (eosinophilic cytoplasmic inclusions in Purkinje cells of cerebellum & hippocampal neurons)
- Street virus (wild) vs Fixed virus (lab-adapted; used in vaccine)
- Treatment: Wound wash (soap+water) + Rabies IG (passive) + Rabies vaccine (active) = Post-exposure prophylaxis
Dengue Fever ⭐
- Flavivirus; Aedes aegypti mosquito; 4 serotypes (DENV 1-4)
- DHF/DSS: Antibody-dependent enhancement (ADE) during secondary infection with different serotype
- Lab: Thrombocytopenia + Leukopenia + Elevated hematocrit
- NS1 antigen: detectable days 1-5 (early diagnosis)
- Tourniquet test (Rumpel-Leede): ≥20 petechiae in 1-inch square = positive
📄 PAGE 9 - MYCOLOGY & PARASITOLOGY
Medically Important Fungi ⭐
| Organism | Morphology | Stain | Disease | Key Feature |
|---|---|---|---|---|
| Candida albicans | Yeast + pseudohyphae; forms germ tubes at 37°C | Gram stain (Gram-positive) | Oral thrush, Vaginitis, Esophagitis, Invasive candidiasis | Most common fungal infection; treat with Fluconazole |
| Cryptococcus neoformans | Encapsulated yeast; narrow-based buds | India ink (capsule halo) | Meningitis (AIDS); pigeon droppings | Urease +ve; latex agglutination test; Treat with Amphotericin B + 5-FC |
| Aspergillus fumigatus | Septate hyphae; 45° acute angle branching | GMS silver stain | Allergic bronchopulmonary aspergillosis (ABPA), Invasive aspergillosis, Aspergilloma | "Fungal ball" in old TB cavity; treat with Voriconazole |
| Mucor/Rhizopus | Non-septate (aseptate) hyphae; wide-angle (90°) branching | GMS | Mucormycosis: Rhinocerebral (diabetics), Pulmonary, GI | "Ribbon-like" hyphae; treat with Amphotericin B; surgery |
| Histoplasma | Yeast in macrophages | PAS/GMS | Histoplasmosis; "cave disease" (bat droppings) | Dimorphic: mold at 25°C, yeast at 37°C |
| Blastomyces | Yeast with broad-based buds | PAS/GMS | Blastomycosis; skin + lung + bone | Double refractile cell wall |
| Coccidioides | Spherules (not yeast/hyphae) | PAS/GMS | Valley fever; desert regions (SW USA) | Endospores inside spherules |
| Sporothrix schenckii | "Cigar-shaped" yeast | PAS | Sporotrichosis; rose thorn prick; lymphocutaneous | "Asteroid bodies" in tissue |
| PCP (Pneumocystis jirovecii) | Cysts with intracystic bodies | Silver stain / DIF | Pneumocystis pneumonia (AIDS, CD4 <200) | Diffuse bilateral ground-glass infiltrates; treat with TMP-SMX |
⭐ Dimorphic fungi (mold in cold, yeast in heat): Histoplasma, Blastomyces, Coccidioides, Sporothrix, Paracoccidioides ⭐ Mucor vs Aspergillus: Mucor = NON-septate + wide angle; Aspergillus = SEPTATE + 45°
Antifungal Drug Mechanisms ⭐
| Drug | Mechanism | Spectrum |
|---|---|---|
| Amphotericin B | Binds ergosterol → pores in membrane | Broad: Candida, Aspergillus, Mucor, Crypto, Histo |
| Azoles (Fluconazole, Voriconazole, Itraconazole) | Inhibit ergosterol synthesis (14α-demethylase) | Candida (Fluconazole); Aspergillus (Voriconazole) |
| Echinocandins (Caspofungin, Micafungin) | Inhibit β-1,3-glucan synthase (cell wall) | Candida, Aspergillus (NOT Mucor, Cryptococcus) |
| 5-Fluorocytosine (Flucytosine) | Inhibits DNA/RNA synthesis | Cryptococcus (combined with Ampho B) |
| Griseofulvin | Disrupts microtubule polymerization | Dermatophytes only (oral) |
| Terbinafine | Inhibits squalene epoxidase | Dermatophytes |
Malaria - High-Yield Parasitology ⭐⭐
| Species | Fever Cycle | RBC changes | Relapse? | Key Feature |
|---|---|---|---|---|
| P. vivax | Tertian (48h) | Enlarged, Schüffner's dots | Yes (hypnozoites in liver) | Most common worldwide |
| P. ovale | Tertian (48h) | Enlarged, fimbriated | Yes (hypnozoites) | Treat with Primaquine for relapse |
| P. malariae | Quartan (72h) | Normal/smaller, Ziemann's stippling | No | Nephrotic syndrome |
| P. falciparum | Irregular (24-48h) | Multiple rings/cell, no enlargement | No | Most dangerous; cerebral malaria; Knob-like protrusions |
⭐ Anti-malarials: Chloroquine (blood schizonticide); Primaquine (kills hypnozoites + gametocytes; G6PD screen before use); Artemisinins (all stages); Atovaquone-Proguanil (prophylaxis) ⭐ Blackwater fever: Massive intravascular hemolysis, hemoglobinuria = P. falciparum + quinine use
📄 PAGE 10 - ANTIMICROBIALS, STERILIZATION & PYQ RAPID-FIRE
Antibiotic Classification by Mechanism ⭐⭐
- Beta-lactams (Penicillins, Cephalosporins, Carbapenems, Monobactams): Bind PBPs → inhibit transpeptidation of peptidoglycan
- Vancomycin: Binds D-Ala-D-Ala terminus → inhibits transglycosylation
- Bacitracin: Inhibits C55-PP dephosphorylation
| Drug | Ribosome | Mechanism | Spectrum |
|---|---|---|---|
| Aminoglycosides | 30S | Misreading; bactericidal | Gram-negative; aerobic only |
| Tetracyclines | 30S | Block tRNA binding (A-site) | Broad; intracellular; NOT in pregnancy/children |
| Chloramphenicol | 50S | Inhibit peptidyl transferase | Broad; Grey baby syndrome; aplastic anemia |
| Macrolides | 50S | Inhibit translocation | Gram-positive + atypicals; azithromycin (5-day course) |
| Clindamycin | 50S | Blocks translocation | Anaerobes; S. aureus; pseudomembranous colitis risk |
| Linezolid | 50S | Prevents 70S initiation complex | MRSA, VRE; bacteriostatic |
- Fluoroquinolones: DNA gyrase (Gram-negative); Topoisomerase IV (Gram-positive)
- Rifampicin: β-subunit of DNA-dependent RNA polymerase
- Metronidazole: Free radical generation → DNA strand breaks; anaerobes + parasites
- Polymyxins (Colistin): Disrupts outer membrane of Gram-negatives; last-resort MDR
- Daptomycin: Depolarizes Gram-positive membrane; NOT for lung (inactivated by surfactant)
Antibiotic Resistance Mechanisms ⭐
| Mechanism | Example |
|---|---|
| Enzymatic inactivation | Beta-lactamases (ESBL, carbapenemases); Aminoglycoside-modifying enzymes |
| Target modification | MRSA (PBP2a, mecA gene); VRE (D-Ala-D-Lac, vanA gene); fluoroquinolone (gyrA mutation) |
| Reduced permeability | Loss of OmpF porin (Pseudomonas) |
| Efflux pumps | Pseudomonas, MRSA |
| Bypass pathway | Sulfonamide resistance (acquire external folate) |
Sterilization & Disinfection ⭐
| Method | Temperature/Details | Kills Spores? | Use |
|---|---|---|---|
| Autoclaving | 121°C, 15 psi, 15 min | Yes | Most reliable for heat-stable items |
| Dry heat (Hot air oven) | 160°C × 1h or 170°C × 45 min | Yes | Glassware, sharp instruments |
| Pasteurization (HTST) | 72°C × 15 sec | No | Milk |
| Incineration | >800°C | Yes | Biohazard waste |
| Ethylene oxide | Low temp; gas | Yes | Heat-sensitive items (endoscopes, plastics) |
| Glutaraldehyde 2% | Chemical; 3-10 hours | Yes (high-level disinfection) | Endoscopes |
| UV radiation | 260nm (DNA damage) | No | Air/surface disinfection |
| Ionizing radiation | γ-rays | Yes | Disposable items (syringes) |
⭐ Prions: Resistant to ALL standard methods; require autoclaving at 134°C × 18 min OR 1N NaOH × 1 hr
Rapid-Fire PYQs: Microbiology 2021-2026
| Question Type | Answer |
|---|---|
| Most common cause of CAP | S. pneumoniae |
| Most common cause of HAP | Pseudomonas aeruginosa (or S. aureus in some settings) |
| Most common cause of meningitis in neonates (<1 month) | Group B Strep + E. coli + Listeria |
| Most common cause of meningitis in adults | S. pneumoniae |
| Most common cause of meningitis in AIDS | Cryptococcus neoformans |
| Smallest bacteria | Mycoplasma (0.2 μm) |
| Largest bacteria | Thiomargarita namibiensis |
| Obligate intracellular bacteria | Rickettsia, Chlamydia, Coxiella, Mycobacterium leprae |
| Bacteria with no cell wall | Mycoplasma |
| Bacteria seen in dark-field microscopy | Treponema pallidum, Leptospira |
| Only Gram-positive bacteria causing food poisoning by PREFORMED toxin | S. aureus and B. cereus (emetic type) |
| Virus causing 3rd disease (rubella = German measles) | Togavirus |
| Virus causing 5th disease (Erythema infectiosum) | Parvovirus B19 |
| Virus causing 6th disease | HHV-6 (Roseola infantum) |
| Commonest cause of viral diarrhea in children | Rotavirus |
| Commonest cause of viral diarrhea in adults | Norovirus |
| Most common cause of post-transfusion hepatitis | HCV |
| Virus with highest mortality in pregnancy | HEV (20-25%) |
| Window period marker for HBV | IgM anti-HBc |
| TSST-1 mechanism | Superantigen; non-specifically activates T cells (Vβ region) |
| Cholera toxin mechanism | ADP-ribosylates Gsα → ↑↑cAMP → Cl⁻/H₂O secretion |
| Bordetella pertussis toxin | ADP-ribosylates Gi → ↑cAMP in airways |
| Diphtheria toxin target | EF-2 ADP-ribosylation → inhibits protein synthesis |
| Gold standard for TB diagnosis | Culture on LJ medium |
| Drug causing orange/red urine | Rifampicin |
| Drug causing color vision loss | Ethambutol (red-green color blindness) |
| Drug causing peripheral neuropathy in ATT | Isoniazid (prevent with B6) |
🎯 IMAGE-BASED Q SUMMARY (Visual Buzzwords)
| Visual Finding | Diagnosis |
|---|---|
| "Owl eye" inclusions in cells | CMV |
| Negri bodies (hippocampal neurons) | Rabies |
| Cowdry type A inclusions | HSV / VZV |
| Koplik spots (buccal mucosa) | Measles |
| Warthin-Finkeldey giant cells | Measles |
| Downey cells on PBS | Infectious mononucleosis (EBV) |
| Safety pin appearance (Wayson) | Yersinia pestis (plague) |
| Drumstick spore | C. tetani |
| Chinese letter arrangement | C. diphtheriae |
| Sulfur granules in pus | Actinomyces israelii |
| India ink with capsule halo | Cryptococcus neoformans |
| 45° branching septate hyphae | Aspergillus |
| Non-septate broad ribbon hyphae (90°) | Mucor / Rhizopus |
| Maltese cross (birefringent) on blood smear | Babesia (NOT Malaria!) |
| Schüffner's dots on enlarged RBC | P. vivax / P. ovale |
| Multiple ring forms in one RBC | P. falciparum |
| Bull's-eye rash | Lyme disease (B. burgdorferi) |
| Stellate abscess on LN biopsy | Cat-scratch disease (Bartonella), LGV (Chlamydia) |