

Give me the answer of all the questions in detail and systematic manner with cycle and digrams
lac operon diagram regulation induction repression
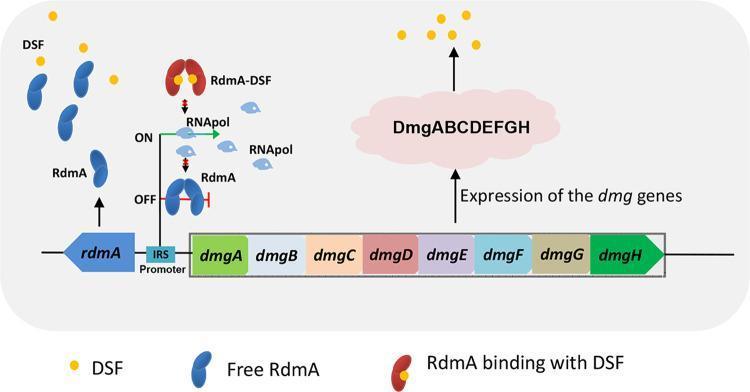
This pathophysiology diagram illustrates the regulatory mechanism of the dmg gene cluster via the Diffusible Signaling Factor (DSF) positive feedback mechanism in bacterial cell signaling. The diagram depicts a genetic locus containing the 'rdmA' gene upstream of an 'IRS Promoter', followed by a downstream operon containing 'dmgA-H' genes. The visual logic demonstrates two states of transcriptional regulation: an 'OFF' state where free RdmA dimers (blue bean-shaped structures) bind to the IRS promoter to repress transcription, and an 'ON' state triggered by the quorum-sensing signal DSF (yellow dots). In the presence of DSF, RdmA binds to the signaling molecules to form a 'RdmA-DSF' complex (two-lobed reddish structure), which prevents the regulator from binding to the promoter. This dissociation allows RNA polymerase (RNApol) to initiate the expression of the dmg genes (dmgA through dmgH), leading to the production of the DmgABCDEFGH enzyme complex responsible for DSF degradation. This model highlights a transcriptional repression-induction system essential for bacterial quorum quenching and metabolic signaling.
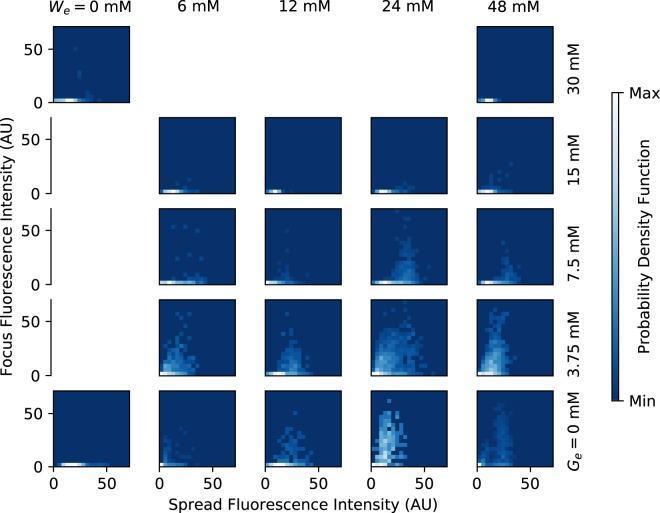
A medical research graphic presenting a grid of 2D probability density function (PDF) plots that illustrate the expression of the tna operon in Escherichia coli. The plots compare single-cell fluorescence patterns across varying environmental conditions: tryptophan concentration (We: 0 to 48 mM) along the horizontal axis and glucose concentration (Ge: 0 to 30 mM) along the vertical axis. Each individual plot displays 'Spread Fluorescence Intensity' (dispersed TnaA enzymes) on the x-axis and 'Focus Fluorescence Intensity' (inactive TnaA foci) on the y-axis, both measured in arbitrary units (0-50 AU). The probability density is represented by a blue-to-white color gradient, with lighter shades indicating higher density. The visualization demonstrates that higher tryptophan levels induce increased fluorescence (gene expression) and shifts in protein localization between dispersed and foci states, while increasing glucose concentrations suppress this induction via catabolite repression. This educational diagram is used to analyze post-translational regulation and phenotypic heterogeneity in bacterial populations.
types hypersensitivity reactions Gell Coombs classification diagram
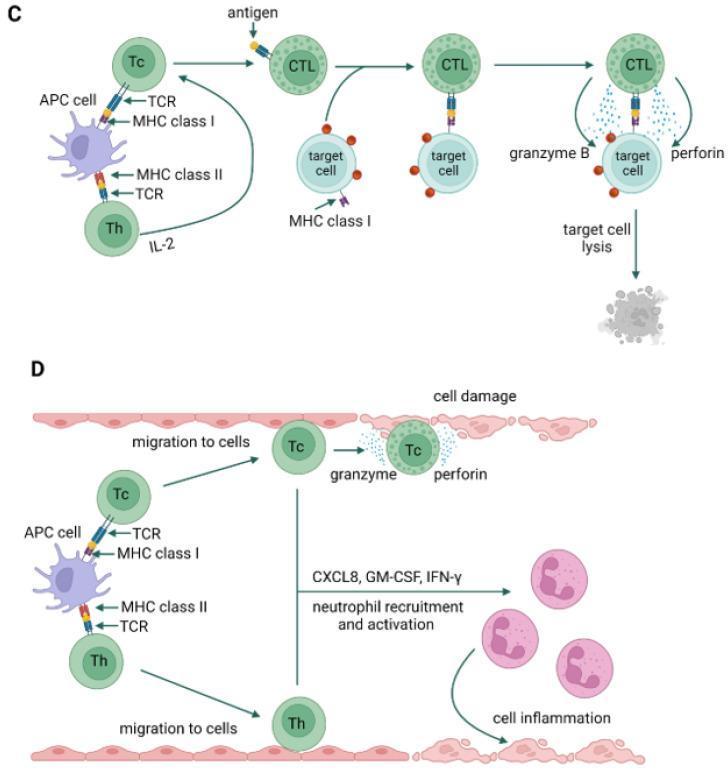
This pathophysiology diagram illustrates the cellular mechanisms of Type IVc and Type IVd hypersensitivity reactions. Panel C (Type IVc) depicts a cytotoxic T-cell-mediated pathway. It shows an antigen-presenting cell (APC) interacting with a cytotoxic T cell (Tc) via MHC class I and a helper T cell (Th) via MHC class II. Stimulated by IL-2, the Tc cell differentiates into a cytotoxic T lymphocyte (CTL). The CTL recognizes antigens on a target cell's MHC class I molecule, triggering the release of granzyme B and perforin, which culminates in target cell lysis. Panel D (Type IVd) illustrates a neutrophil-mediated delayed-type hypersensitivity reaction. Similar to Type IVc, an APC activates Tc and Th cells. These cells migrate to the site of cell damage. The Tc cells release granzyme and perforin, while the T lymphocytes (Tc and Th) secrete chemokines and cytokines including CXCL8 (IL-8), GM-CSF, and IFN-gamma. This signaling promotes neutrophil recruitment and activation, leading to tissue inflammation. These diagrams serve as educational resources for understanding the molecular immunology and T-cell-mediated mechanisms of delayed hypersensitivity disorders.
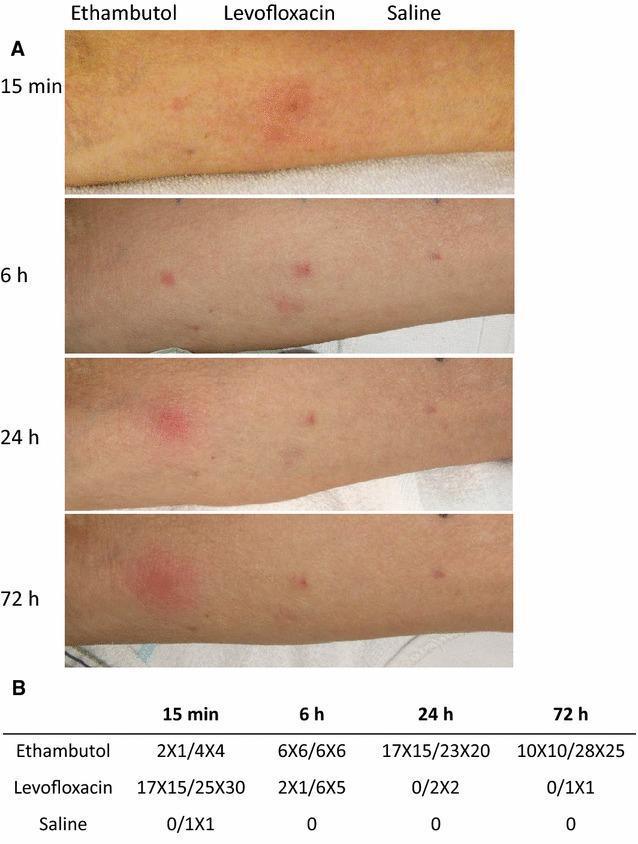
Educational clinical image and data table illustrating types of drug hypersensitivity reactions. Part A displays four sequential clinical photographs of a patient's forearm following intradermal skin testing with Ethambutol, Levofloxacin, and Saline (negative control) over a 72-hour period. At 15 minutes, Levofloxacin shows a significant erythematous wheal and flare reaction, characteristic of Type I IgE-mediated immediate hypersensitivity, which diminishes by 6 hours. In contrast, Ethambutol demonstrates a late-phase reaction (LPR), with minimal initial changes progressing to significant indurative erythema and edema that peaks at 24 hours and persists through 72 hours. Part B provides a quantitative data table measuring the diameters (in mm) of the wheal and induration/erythema at each time point (15 min, 6 h, 24 h, and 72 h), correlating clinical visuals with objective diagnostic measurements. This material is used to teach the temporal differences between immediate hypersensitivity and late-phase or delayed-type hypersensitivity reactions in clinical allergy and immunology.
glucagon epinephrine cAMP second messenger pathway diagram
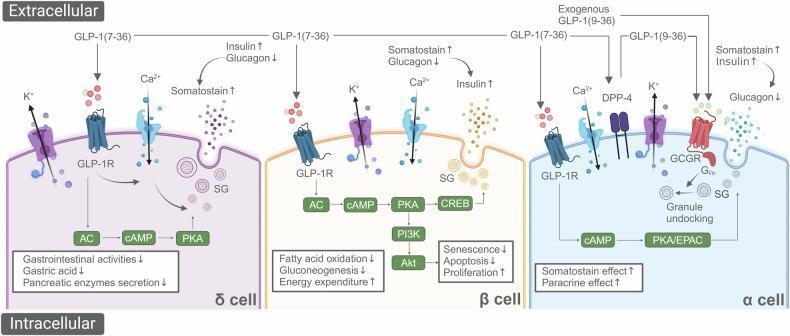
A pathophysiology diagram illustrating the intracellular signaling pathways and endocrine mechanisms of blood glucose reduction by Glucagon-Like Peptide-1 (GLP-1) in pancreatic δ, β, and α cells. The diagram is divided into three sections: 1) The δ cell (purple) shows GLP-1(7-36) activating GLP-1R, increasing cAMP and PKA to promote somatostatin secretion, which inhibits gastrointestinal activities. 2) The β cell (yellow) depicts GLP-1R activation leading to the AC-cAMP-PKA-CREB pathway and the PI3K-Akt cascade, which enhances insulin secretion, suppresses glucagon, and promotes cell survival and proliferation. 3) The α cell (blue) illustrates GLP-1(7-36) and its degradation product GLP-1(9-36) inhibiting glucagon release. Mechanisms include PKA/EPAC signaling and inhibitory G protein (Gi/o) activation via GCGR, leading to secretory granule (SG) undocking. Common elements across all cells include voltage-gated Ca2+ and K+ channels. The diagram highlights the paracrine crosstalk where insulin from β cells and somatostatin from δ cells both contribute to the suppression of glucagon from α cells, collectively maintaining glucose homeostasis.
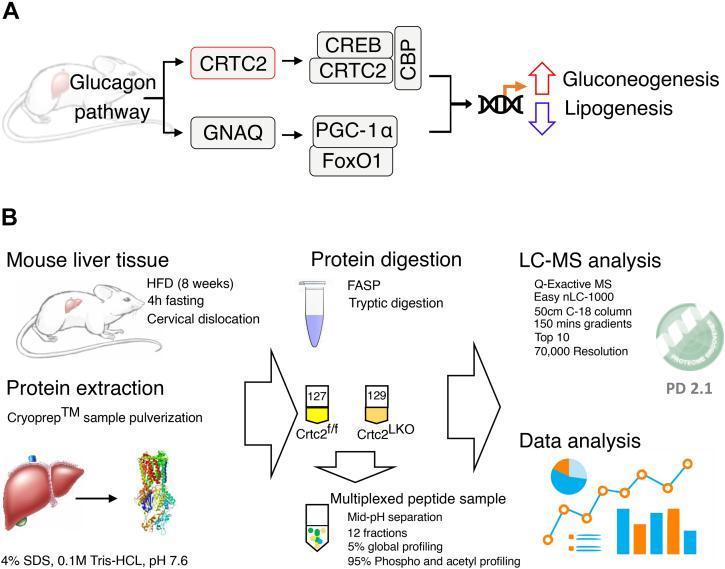
This educational graphic is divided into two sections outlining the pathophysiology of the glucagon pathway (A) and a proteomics experimental workflow (B). Section A: A pathophysiology diagram illustrating the glucagon signaling pathway in liver tissue. Upon activation, the pathway bifurcates into two regulatory routes: one involving CRTC2 forming a complex with CREB and CBP, and a second route involving GNAQ and the FoxO1/PGC-1α complex. Both converge on transcriptional regulation, leading to upregulated gluconeogenesis and downregulated lipogenesis. Section B: An infographic outlining a quantitative proteomics workflow. The process begins with mouse liver tissue (following high-fat diet and fasting protocols), moving to protein extraction via sample pulverization and SDS/Tris-HCl buffer. This is followed by tryptic digestion (FASP method) and multiplexing of peptides from control (Crtc2f/f) and liver-specific knockout (Crtc2LKO) samples. The workflow concludes with mid-pH separation, LC-MS analysis using a Q-Exactive mass spectrometer, and bioinformatic data analysis using Proteome Discoverer (PD 2.1) to quantify protein, phospho-, and acetyl-profiles.
renal tubular acidosis bicarbonate buffering acid base balance diagram
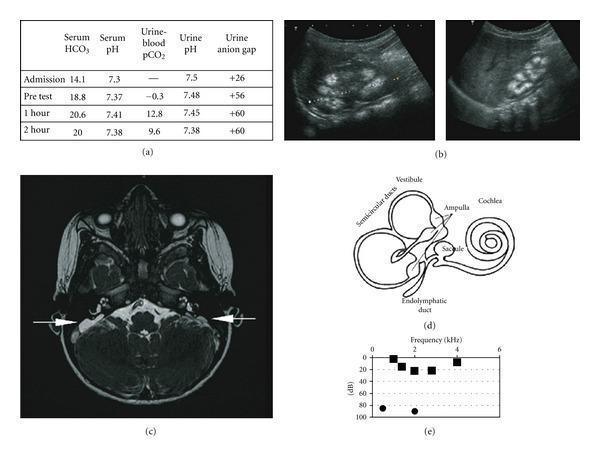
This composite educational image illustrates the clinical and diagnostic features of distal renal tubular acidosis (dRTA) associated with sensorineural hearing loss. (a) Data table showing results of a bicarbonate loading test, characterized by low urine-to-blood pCO2 gradient and positive urinary anion gap. (b) Renal ultrasound images of the left and right kidneys demonstrating medullary nephrocalcinosis, visualized as multiple hyperechoic foci within the renal pyramids. (c) Axial FIESTA (Fast Imaging Employing Steady-state Acquisition) cerebral MRI scan showing bilateral enlargement of the endolymphatic sacs (indicated by white arrows), a common finding in Pendred syndrome or dRTA with hearing loss. (d) Anatomical schematic of the inner ear, labeling the cochlea, vestibule, semicircular ducts, and endolymphatic duct. (e) Audiogram plot showing frequency (kHz) versus decibels (dB), depicting significant hearing impairment. The collection integrates metabolic laboratory data, diagnostic radiology (ultrasound and MRI), and functional audiological testing to present a comprehensive case of a hereditary renal-otological syndrome.
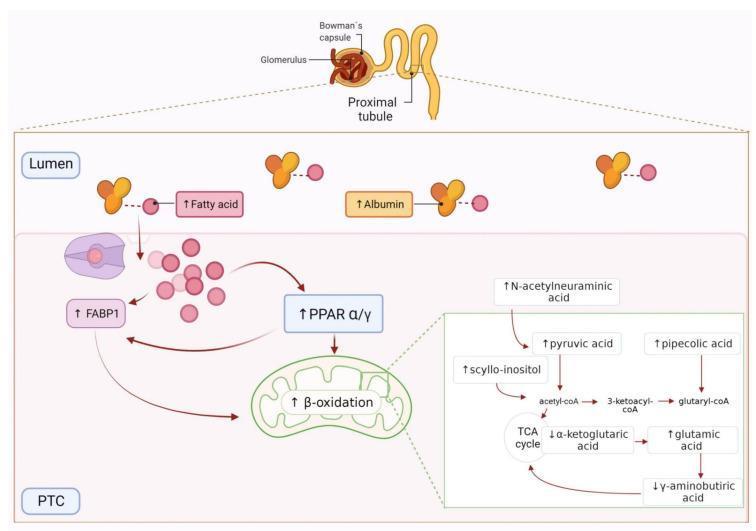
This medical illustration depicts the pathophysiology of fatty acid oxidation (FAO) in renal proximal tubular cells (PTCs). The top panel shows a nephron diagram highlighting the glomerulus, Bowman’s capsule, and proximal tubule. The main panel illustrates the transition from the tubular lumen to the PTC. In the lumen, increased albumin-bound fatty acids are shown entering the PTC via FABP1 (Fatty Acid Binding Protein 1). Intracellularly, there is an upregulation of PPAR ̑/̳, leading to increased mitochondrial ̒-oxidation. A detailed metabolic map within the mitochondrial compartment shows altered metabolite abundance associated with early renal damage. Specifically, it displays increased levels of N-acetylneuraminic acid, scyllo-inositol, pyruvic acid, pipecolic acid, and glutamic acid. Conversely, it shows decreased levels of ̑-ketoglutaric acid and ̳-aminobutyric acid (GABA). These changes are linked to the TCA cycle and acetyl-CoA production. This diagram serves as an educational tool for understanding metabolic reprogramming and cardiorenal risk in the context of normoalbuminuric hypertension.
mucosal block iron absorption intestinal cell ferritin apoferritin
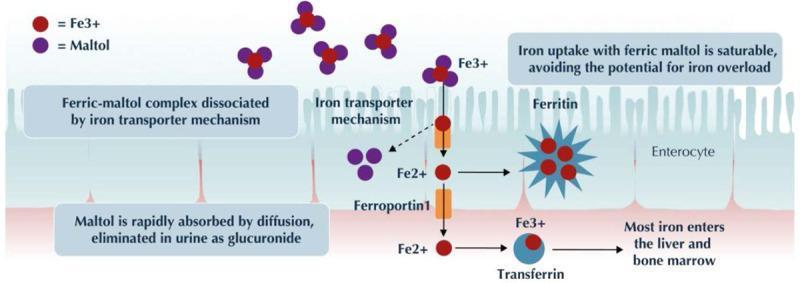
This pathophysiology diagram illustrates the mechanism of action for ferric maltol, an oral iron-replacement therapy. The visual depicts the intestinal lumen containing ferric maltol complexes, shown as clusters of one red ferric iron (Fe3+) sphere bound to three purple maltol spheres. The diagram outlines the transport process across an enterocyte, characterized by its brush border. At the apical membrane, the 'iron transporter mechanism' dissociates the complex, allowing Fe3+ to enter the cell while maltol is released. Once inside the enterocyte, iron is either stored in a star-shaped ferritin complex or exported via ferroportin 1 into the basolateral space. In the systemic circulation, iron (depicted as Fe2+) binds to transferrin for transport to the liver and bone marrow. Key annotations emphasize that the uptake is saturable, which helps avoid iron overload, and that the maltol component is eliminated via the kidneys. This educational illustration is designed for medical students and clinicians to understand iron pharmacokinetics and gastrointestinal absorption pathways.
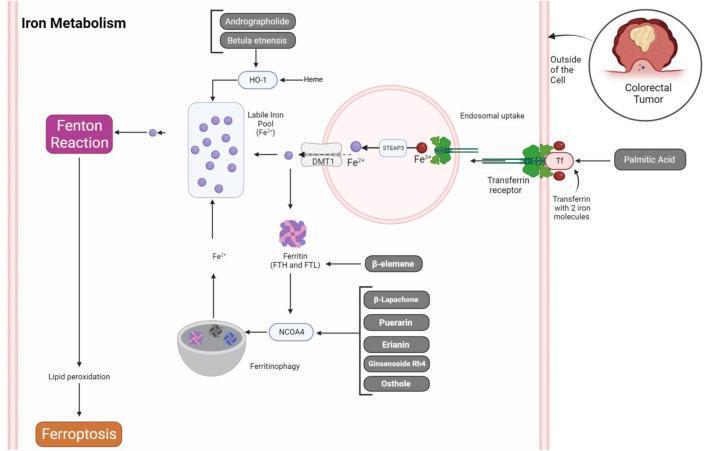
This pathophysiology diagram illustrates the intracellular mechanisms of iron metabolism and its role in inducing ferroptosis within a colorectal tumor cell. The process begins with the binding of iron-loaded transferrin (Tf) to the transferrin receptor on the cell membrane, influenced by palmitic acid. Following endosomal uptake, ferric iron (Fe3+) is converted to ferrous iron (Fe2+) by the metalloreductase STEAP3 and exported into the cytosol via the divalent metal transporter 1 (DMT1). The resulting labile iron pool (Fe2+) can either be sequestered in ferritin (comprised of FTH and FTL subunits) or utilized in the Fenton reaction. The diagram details ferritinophagy, a process mediated by NCOA4 that degrades ferritin to release free iron back into the labile pool. Various natural products are shown modulating these pathways: andrographolide and Betula etnensis target HO-1 mediated heme degradation; beta-elemene influences ferritin; and compounds like beta-lapachone, puerarin, and erianin regulate NCOA4. Ultimately, excess labile iron drives the Fenton reaction and lipid peroxidation, culminating in ferroptotic cell death.
proto-oncogene oncogene tumour suppressor gene cancer cell cycle
<table><tr><td>syndrome</td><td></td></tr><tr><td>p53 gene</td><td>A tumour suppressor gene. Abnormalities of this gene leading to dysfunctional p53 protein have been demonstrated in cancers of many different types, including keratinocyte cancer</td></tr><tr><td>Patched 1 gene</td><td>A tumour suppressor gene, mutations of which are associated with nevoid basal cell carcinoma syndrome</td></tr><tr><td>Perineural invasion (also known as perineural spread)</td><td>Invasion of a tumour in the perineural compartment of a peripheral nerve fibre, exhibited by some of the more aggressive keratinocyte cancers (also known as perineural spread)</td></tr><tr><td>Photodynamic therapy</td><td>The use of light to activate a photosensitiser that is localised in diseased tissues, resulting in the formation of cytotoxic reactive oxygen species</td></tr><tr><td>Poorly differentiated tumours</td><td>Tumours in which products of differentiation (e.g. keratin or desmosomal attachments) or adnexal differentiation are poorly expressed. Immunohistochemistry techniques for keratin subsets are often used to identify such tumours.</td></tr><tr><td>Radiotherapy</td><td>The use of ionising radiation to treat cancer and related disease</td></tr><tr><td>Rombo syndrome</td><td>A hereditary syndrome that causes early-onset basal cell carcinoma</td></tr><tr><td>Sclerosing</td><td>Scar-like (morphoeic) – a term used to describe one of the clinical variants of basal cell carcinoma</td></tr><tr><td>Skin flap (surgical technique)</td><td>A surgical technique in which an area of healthy skin is partly detached and moved to cover a nearby wound (e.g. after removal of a large skin cancer). The skin flap may fat or muscle as well as skin. The flap usually stays attached to its original site at one end so that it remains connected to a blood vessel.</td></tr><tr><td>Skin graft</td><td>A surgical technique in which an area of healthy skin is removed and transplanted onto a new place on the body (e.g. to replace skin lost when surgically removing a large skin cancer).</td></tr><tr><td>Smoothened, frizzled class receptor</td><td>A protein encoded by the SMO gene, which is a component of the hedgehog signalling pathway</td></tr><tr><td>Solar keratosis</td><td>See actinic keratosis.</td></tr><tr><td>Specialist</td><td>Medical practitioners who through training, experience and peer opinion specialise in the management of keratinocyte cancers.</td></tr><tr><td>Squamous cell carcinoma in situ</td><td>See Bowen's disease.</td></tr><tr><td>Sun protection factor</td><td>Laboratory-derived rating system for sunscreens active in the ultraviolet B (UVB) range. The SPF number indicates the multiple by which a dose of ultraviolet radiation which causes minimal erythema in human skin needs to be increased to cause minimal erythema in the same person when the tested sunscreen has been applied to their skin prior to exposure.</td></tr><tr><td>Superficial radiotherapy</td><td>Radiotherapy that is absorbed within the first few millimetres of skin and does not penetrate to the deeper tissues. Usually means external beam radiotherapy in which a certain machine is used that is not a linear accelerator and shielding requirements are not as complex or time consuming.</td></tr><tr><td>TNM classification</td><td>A classification system for cancers based on assessment of the tumour, lymph nodes, and metastases. Unless stated otherwise, tumour stage is according to the American Joint</td></tr></table>
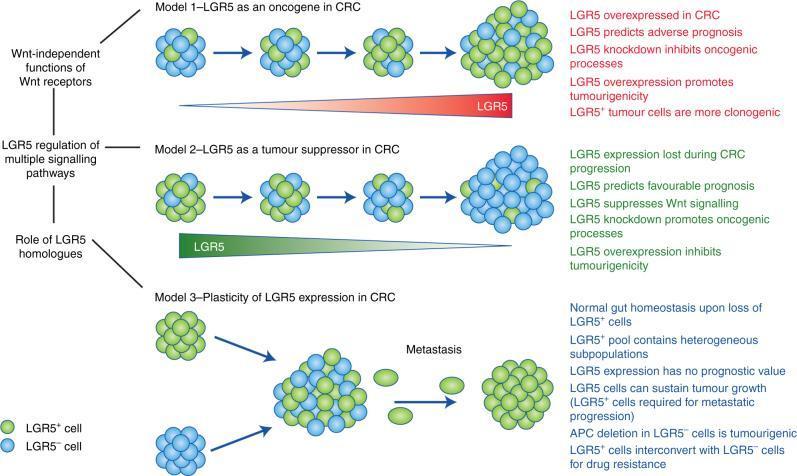
This pathophysiology diagram illustrates three contrasting models of LGR5 function in colorectal cancer (CRC). The visual is organized into three horizontal panels. LGR5+ cells are represented as green spheres and LGR5− cells as blue spheres. Model 1 (Oncogene) shows a progression where LGR5 expression increases (red gradient bar), leading to tumor expansion with high clonogenicity and adverse prognosis. Model 2 (Tumour Suppressor) depicts CRC progression associated with the loss of LGR5 expression (green gradient bar), where LGR5 serves to suppress Wnt signaling and predicts a favorable prognosis. Model 3 (Plasticity) demonstrates the interconversion between LGR5+ and LGR5− populations, highlighting cellular heterogeneity and the specific role of LGR5+ cells in driving metastasis and drug resistance. To the left, confounding factors such as Wnt-independent receptor functions, signaling pathway regulation, and LGR5 homologues are listed. The diagram effectively contrasts oncogenic, tumor-suppressive, and stochastic/plasticity-based theories of CRC stem cell dynamics.
liver function tests bilirubin ALT AST ALP jaundice obstructive hepatocellular
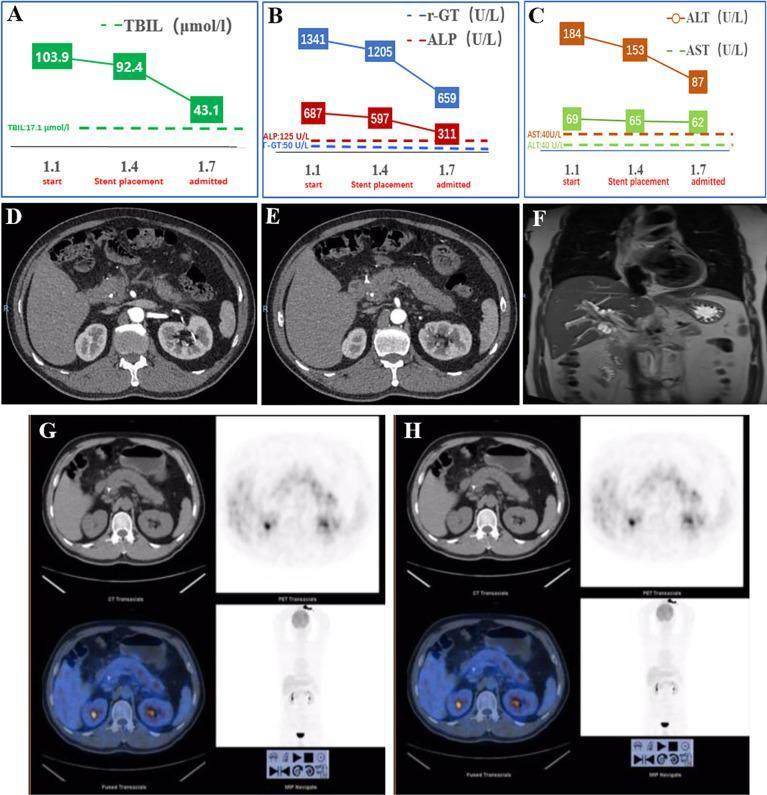
A multi-panel figure illustrating diagnostic findings and clinical progression for a biliary obstruction and pancreatitis case. (A-C) Line graphs track liver function tests, showing a downward trend in total bilirubin (TBIL), gamma-glutamyl transpeptidase (γ-GT), alkaline phosphatase (ALP), alanine aminotransferase (ALT), and aspartate aminotransferase (AST) from initial presentation through biliary stent placement to admission. (D, E) Axial contrast-enhanced CT scans of the abdomen show a hyperdense biliary stent within the common bile duct, accompanied by a plump pancreatic parenchyma and peripancreatic fat stranding (cloudy adipose tissue) indicative of secondary pancreatitis. (F) Coronal Magnetic Resonance Cholangiopancreatography (MRCP) reveals the biliary anatomy and site of ductal stenosis. (G, H) PET-CT transaxial, PET, and fused images demonstrate the metabolic activity in the upper abdomen, used here to screen for malignancy. This composite clinical visual serves as an educational tool for integrating biochemical trends with multimodality imaging (CT, MRCP, PET-CT) in the workup of hepatobiliary diseases and pancreatic complications.
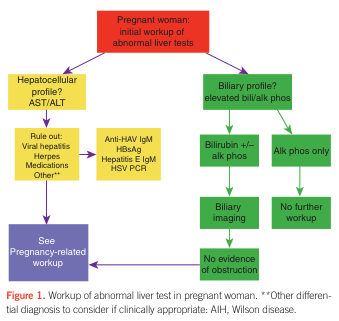
Summary : This flowchart outlines the diagnostic workup for abnormal liver tests in pregnant women, distinguishing between hepatocellular and biliary profiles, and guiding further testing and management based on initial findings. flowchart: # Nodes : • Start: "Pregnant woman: initial workup of abnormal liver tests" (red rectangle) • Decision: "Hepatocellular profile? AST/ALT" (yellow rectangle) • Decision: "Biliary profile? elevated bili/alk phos" (green rectangle) • Process: "Rule out: Viral hepatitis, Herpes, Medications, Other**" (yellow rectangle) • Process: "Anti-HAV IgM, HBsAg, Hepatitis E IgM, HSV PCR" (yellow rectangle) • Process: "See Pregnancy-related workup" (purple rectangle) • Decision: "Bilirubin +/- alk phos" (green rectangle) • Decision: "Alk phos only" (green rectangle) • Process: "Biliary imaging" (green rectangle) • Process: "No further workup" (green rectangle) • Decision: "No evidence of obstruction" (green rectangle) • Process: "See Pregnancy-related workup" (purple rectangle) # Connectors : • The initial node splits into two branches: hepatocellular profile (left) and biliary profile (right). • Hepatocellular profile branch: – "Hepatocellular profile? AST/ALT" → "Rule out: Viral hepatitis, Herpes, Medications, Other**" – "Rule out: ..." → "Anti-HAV IgM, HBsAg, Hepatitis E IgM, HSV PCR" – "Anti-HAV IgM, ..." → "See Pregnancy-related workup" • Biliary profile branch: – "Biliary profile? elevated bili/alk phos" → two branches: • "Bilirubin +/- alk phos" → "Biliary imaging" → "No evidence of obstruction" → "See Pregnancy-related workup" • "Alk phos only" → "No further workup" # Layout : • The flowchart is organized as a top-down decision tree with two main branches (hepatocellular and biliary) diverging from the initial node. • The hepatocellular branch is on the left, the biliary branch is on the right. • The biliary branch further splits into two sub-branches based on the presence of bilirubin and/or alkaline phosphatase. # Analysis : • The flowchart provides a clear, stepwise approach for evaluating abnormal liver tests in pregnant women, emphasizing the importance of distinguishing between hepatocellular and biliary patterns. • It ensures that relevant infectious and non-infectious causes are considered and that unnecessary workup is avoided when only alkaline phosphatase is elevated. • The process directs clinicians to pregnancy-specific workup when indicated and highlights the need for biliary imaging if both bilirubin and alkaline phosphatase are elevated. • The chart also notes that other differential diagnoses (e.g., AIH, Wilson disease) should be considered if clinically appropriate.
apoptosis caspase pathway intrinsic extrinsic cancer
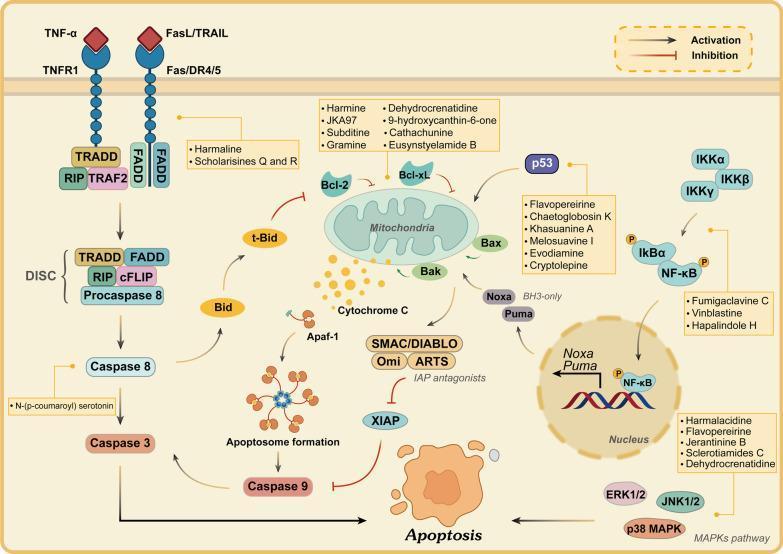
A comprehensive pathophysiology diagram illustrating the extrinsic and intrinsic apoptosis signaling pathways within a cell, specifically in the context of cancer research. The extrinsic pathway is shown on the left, initiated by TNF-α and FasL/TRAIL binding to TNFR1 and Fas/DR4/5 receptors, leading to DISC assembly (FADD, TRADD, RIP) and Caspase-8/3 activation. The intrinsic pathway centers on mitochondrial dysfunction, regulated by the Bcl-2 family (Bcl-2, Bcl-xL, Bax, Bak). It depicts the release of Cytochrome C to form the apoptosome with Apaf-1, activating Caspase-9. The diagram highlights cross-talk via t-Bid and the role of IAP antagonists (SMAC/DIABLO, Omi, ARTS) in counteracting XIAP. Additionally, the diagram integrates nuclear signaling through NF-κB and MAPK (ERK, JNK, p38) pathways. Yellow boxes annotate various indole alkaloids (e.g., Vinblastine, Harmine, Evodiamine) and their specific molecular targets within these cascades, demonstrating their pharmacological potential to induce apoptosis in tumor cells.
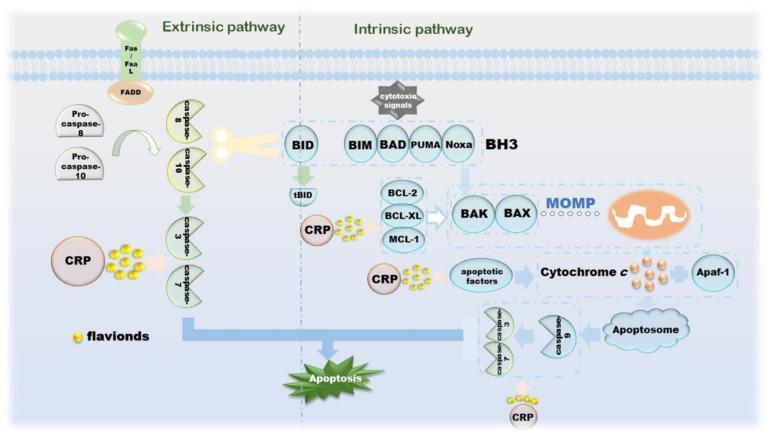
This pathophysiology diagram illustrates the extrinsic and intrinsic apoptotic signaling pathways and the modulatory role of Citri Reticulatae Pericarpium (CRP) and its flavonoids in cancer cell death. The extrinsic pathway (left) shows Fas/FasL binding to FADD, triggering the activation of Pro-caspase-8 and Pro-caspase-10 into active caspase-8 and caspase-10, which subsequently activate executioner caspases-3 and -7. The intrinsic pathway (right) is initiated by cytotoxic signals acting on BH3-only proteins (BID, BIM, BAD, PUMA, Noxa). These proteins modulate anti-apoptotic factors (BCL-2, BCL-XL, MCL-1) and pro-apoptotic BAK/BAX, leading to Mitochondrial Outer Membrane Permeabilization (MOMP). This results in Cytochrome c release, which binds to Apaf-1 to form the apoptosome, activating caspase-9 and executioner caspases. CRP and flavonoids are shown interacting at multiple nodes: promoting caspase activation in the extrinsic pathway, influencing tBID and mitochondrial factors in the intrinsic pathway, and ultimately enhancing the progression toward cellular apoptosis. The diagram serves as an educational summary of how natural compounds can target apoptotic dysregulation in oncology.
3rd Internal Assessment - Biochemistry Paper-2 (2025-26)
Krishnanagar Institute of Medical Science - Complete Answers
QUESTION 1 (Main Question - 15 Marks)
A. Types of Mutations
Classification of Mutations
| Type | Description | Example |
|---|---|---|
| Point mutation | Single base pair change | Sickle cell anemia (A→T in codon 6 of β-globin) |
| Frameshift mutation | Insertion/deletion shifting reading frame | Loss of codon reading frame |
| Chromosomal mutation | Large-scale structural changes | Deletions, inversions, translocations |
- Transition: Purine replaced by another purine (A↔G) or pyrimidine by pyrimidine (C↔T)
- Transversion: Purine replaced by pyrimidine or vice versa (A/G ↔ C/T)
- Missense mutation: One amino acid substituted by another (e.g., Sickle cell - Glu→Val)
- Nonsense mutation: Codon changed to stop codon - truncated protein
- Silent mutation: Base change but same amino acid coded (degeneracy of codons)
- Frameshift mutation: Insertion/deletion of non-multiple of 3 bases - completely altered downstream protein
NORMAL:   ATG - AAA - GGG - TTT - stop
MISSENSE: ATG - AAA - CGG - TTT - stop   (one AA changed)
NONSENSE: ATG - AAA - TAG - TTT          (premature stop)
FRAMESHIFT (deletion of A):
          ATG - AAG - GGT - TT...        (completely altered)
- Forward mutation: Wild type → mutant
- Back (reverse) mutation: Mutant → wild type
- Suppressor mutation: Second mutation at another site corrects the effect
B. Mutagens (Agents Causing Mutations)
- Ultraviolet (UV) radiation - causes thymine dimers (cyclobutane rings between adjacent thymine bases)
- X-rays and gamma rays - cause DNA strand breaks, base modifications
- Cosmic radiation
| Mutagen | Mechanism |
|---|---|
| Nitrous acid (HNO2) | Deaminates adenine → hypoxanthine (pairs with C instead of T); deaminates C → uracil |
| Alkylating agents (EMS, nitrogen mustard) | Add alkyl groups to bases; O6-methylguanine pairs with T instead of C |
| Base analogues (5-bromouracil, 2-aminopurine) | Incorporated in place of normal bases, causing misinsertion |
| Acridine dyes | Intercalate between base pairs, cause frameshift mutations |
| Benzopyrene (in cigarette smoke) | Bulky adduct causing distortion - repaired by NER |
- Transposons (jumping genes)
- Certain viruses (retroviruses inserting DNA)
C. DNA Repair Mechanisms
Common Steps (applicable to most repair mechanisms):
Step 1: RECOGNITION of DNA distortion/damage
          ↓
Step 2: REMOVAL of the damaged region (excision)
          ↓
Step 3: RESYNTHESIS - DNA polymerase fills the gap (5'→3')
          ↓
Step 4: LIGATION - DNA ligase seals the nick
          ↓
     REPAIRED DNA
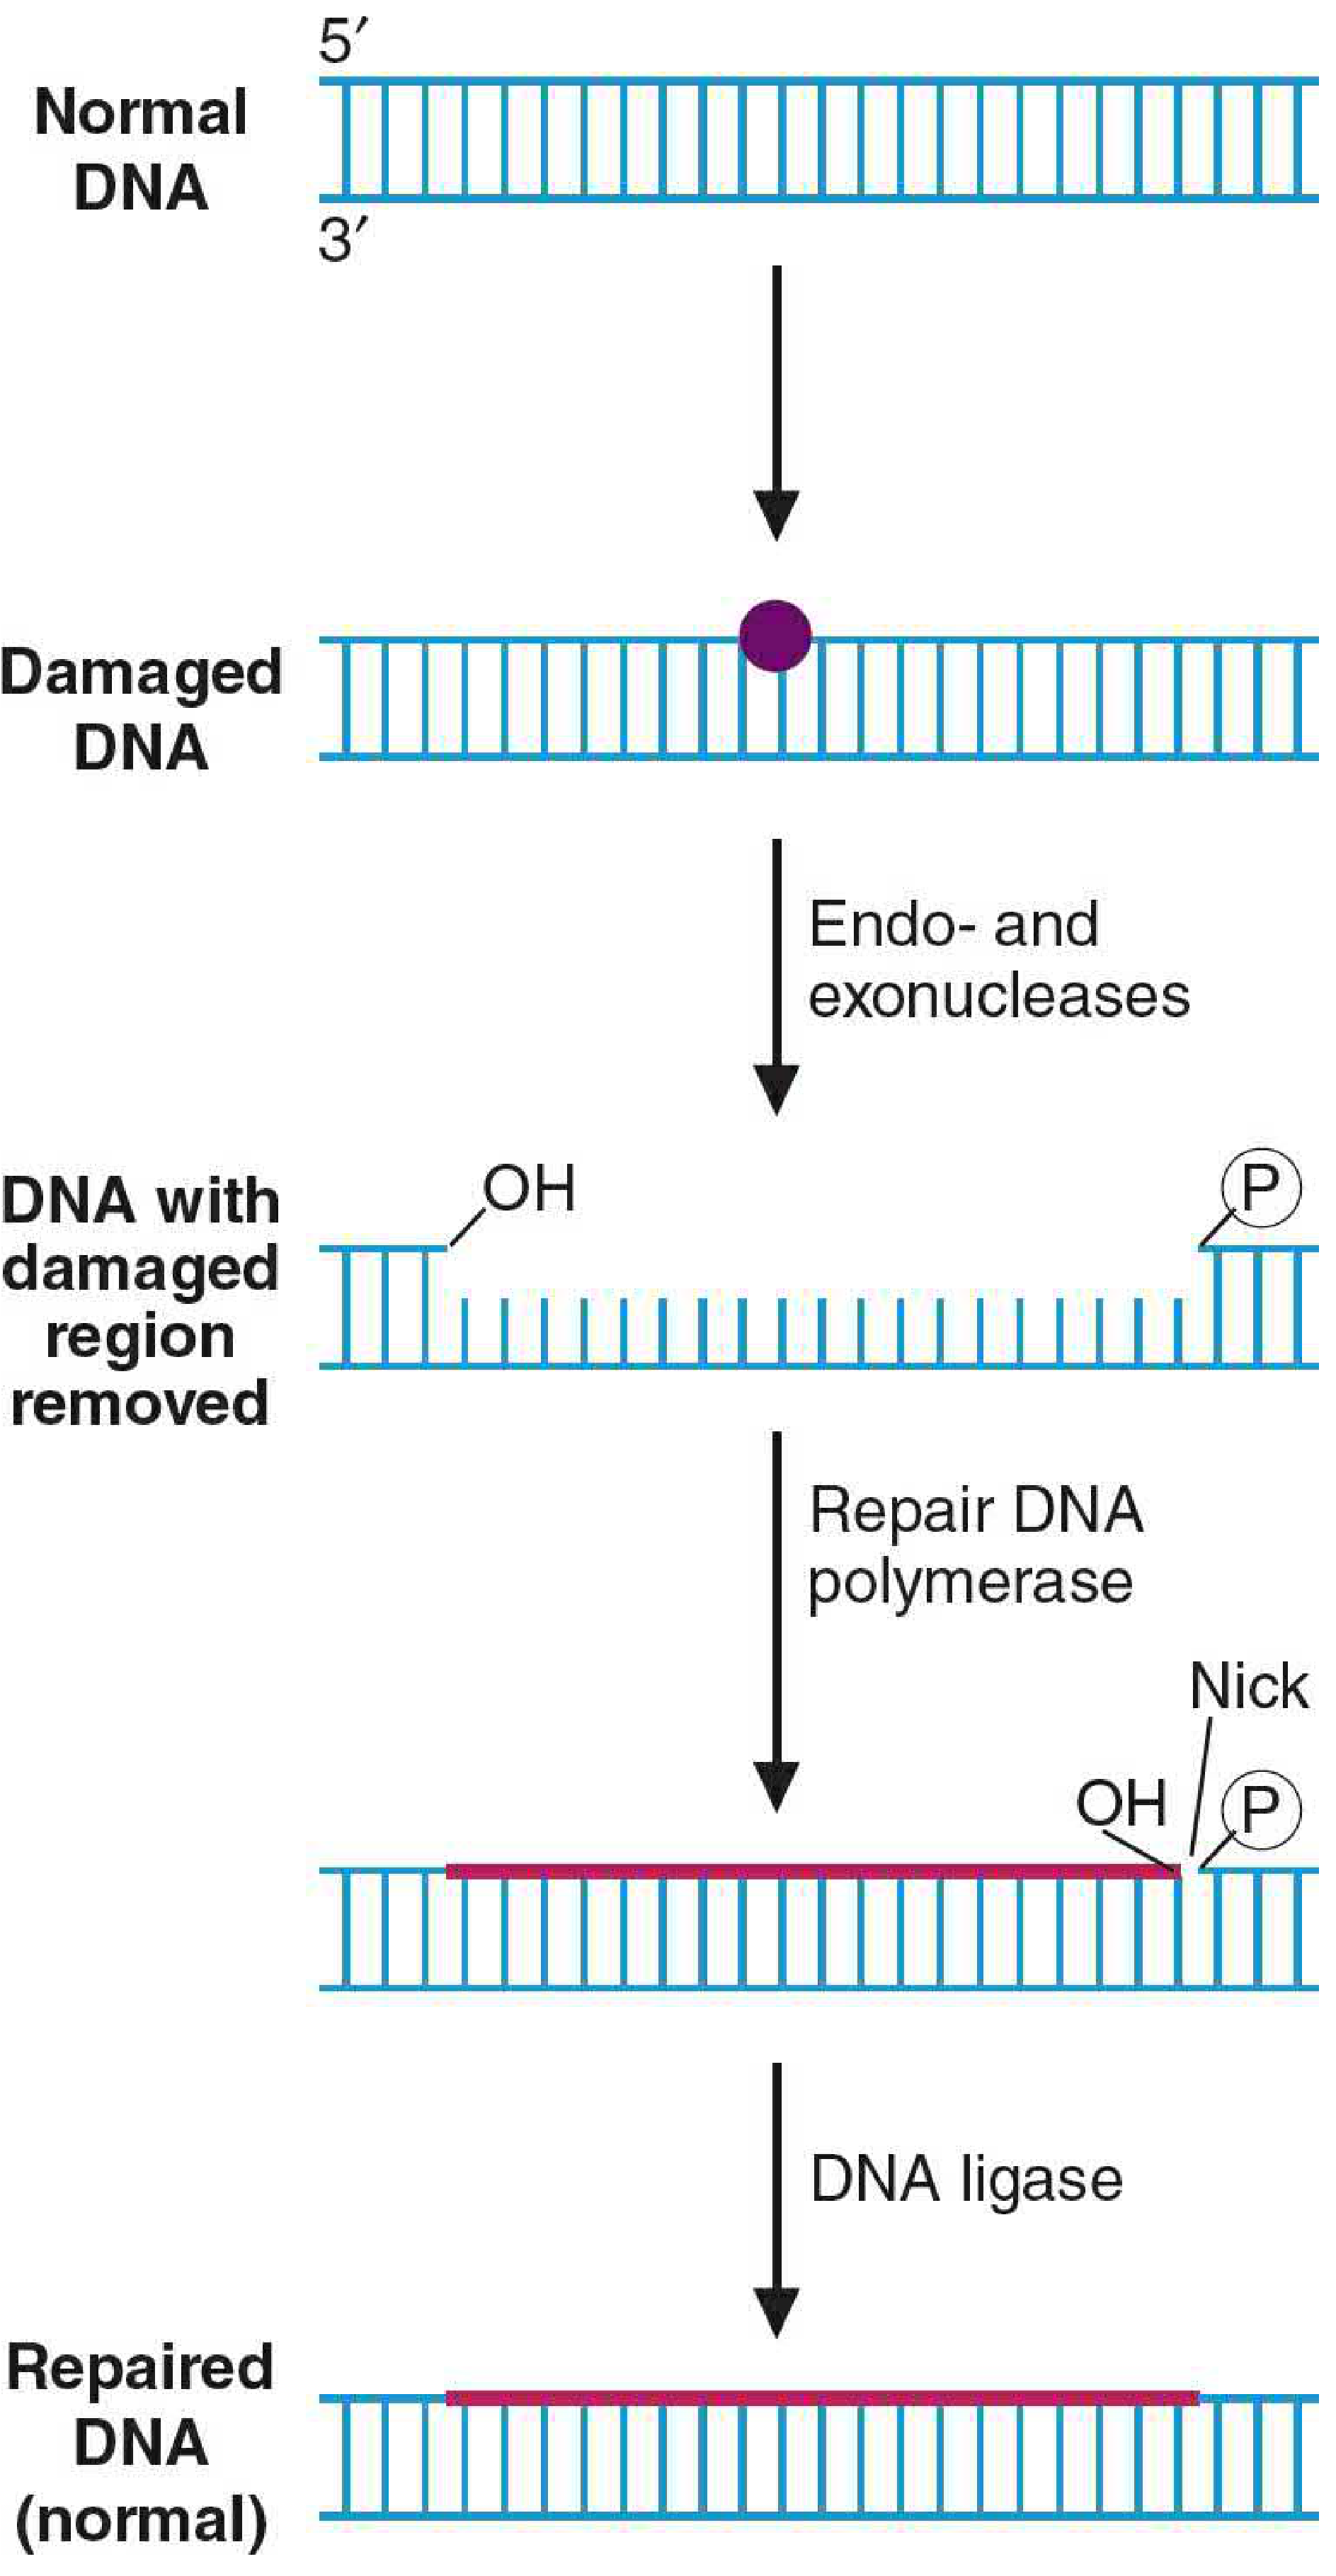
1. Nucleotide Excision Repair (NER)
- Endonucleases recognize the helix distortion
- An oligonucleotide of ~12-29 bases is removed (including the lesion)
- DNA polymerase I/delta fills the gap using intact strand as template
- DNA ligase seals the nick
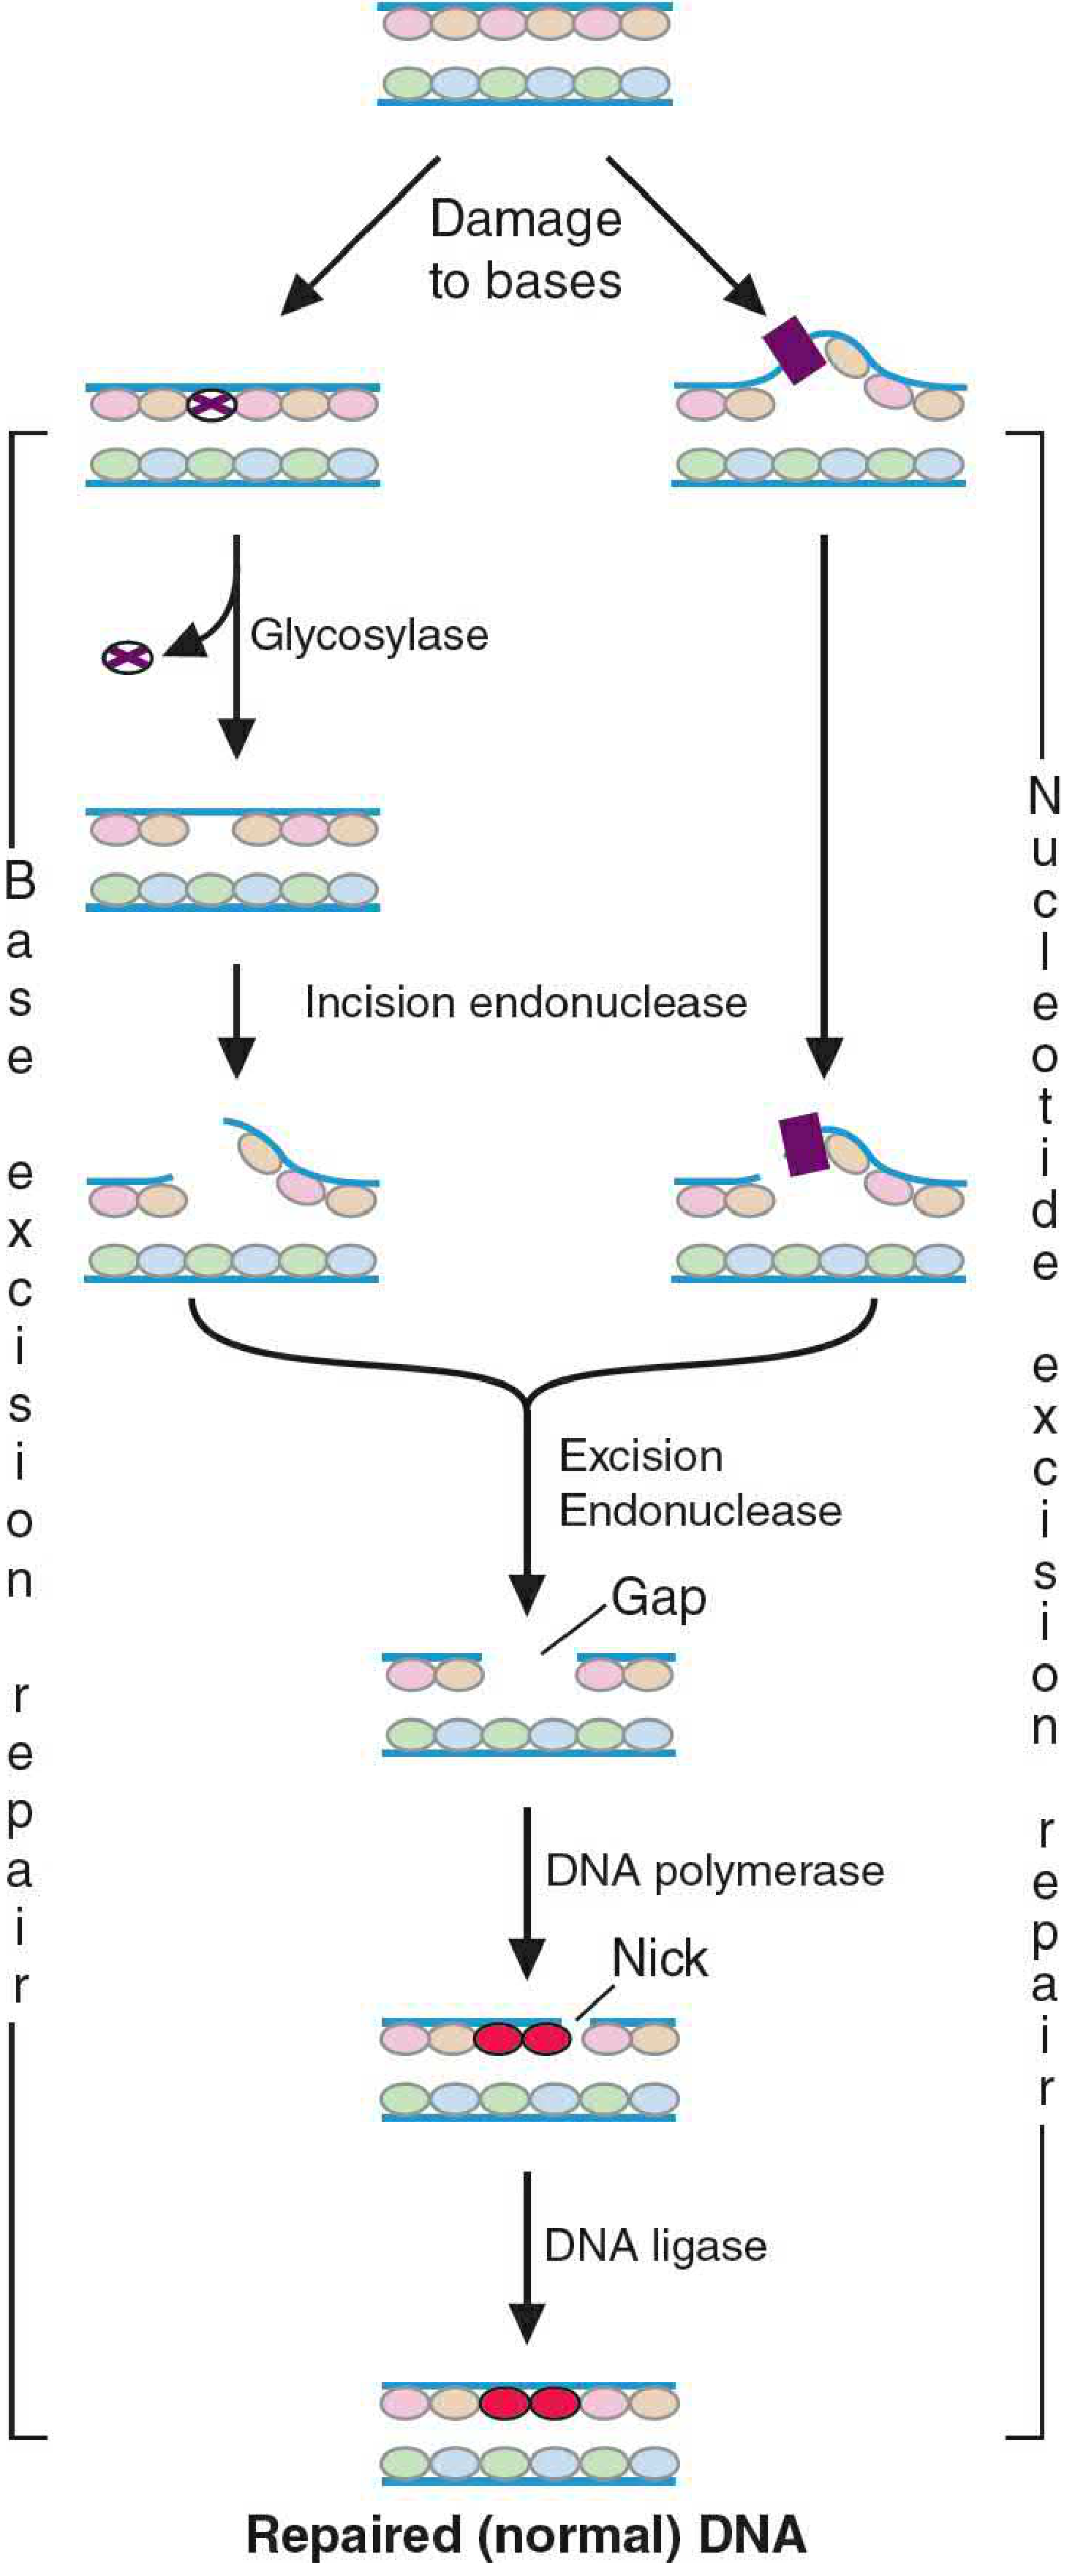
2. Base Excision Repair (BER)
- DNA glycosylase recognizes the damaged base and cleaves the N-glycosidic bond, releasing the damaged base
- This creates an AP site (apurinic/apyrimidinic site)
- AP endonuclease cleaves the backbone at the AP site
- DNA polymerase fills the gap
- DNA ligase seals the nick
3. Mismatch Repair (MMR)
- Mismatch recognition proteins (MutS in bacteria, MSH2/MSH6 in humans) bind the mismatch
- MutL (MLH1) nicks the newly synthesized strand
- Exonuclease removes the region containing the mismatch
- DNA polymerase + ligase complete repair
- Clinical: Defective MMR → Hereditary Non-Polyposis Colorectal Cancer (HNPCC/Lynch Syndrome)
4. Direct Repair (Photoreactivation)
- Photolyase enzyme directly cleaves the cyclobutane ring of thymine dimers using energy from visible light (300-500 nm)
- Found in bacteria, plants, some lower eukaryotes; NOT in humans
- No nucleotides are removed
5. Double-Strand Break Repair
- Homologous Recombination (HR): Uses the sister chromatid as template; error-free; active in S/G2 phase. Involves BRCA1, BRCA2, RAD51
- Non-Homologous End Joining (NHEJ): Directly joins broken ends; may be error-prone; active in G1 phase
D. Initiation of Transcription in Prokaryotes
- RNA polymerase (RNAP): Core enzyme = α2ββ'ω; Holoenzyme = core + sigma (σ) factor
- Sigma (σ) factor: Confers promoter recognition ability (most common: σ70 in E. coli)
- Promoter: DNA sequence upstream of the transcription start site
- -35 element: Consensus sequence TTGACA (17 bp upstream of -10)
- -10 element (Pribnow box): Consensus sequence TATAAT (closest to start site)
DNA:  5'--TTGACA--(17 bp)--TATAAT--(~6 bp)--[+1 start site]--3'
              ↑                   ↑
           -35 box           -10 box (Pribnow box)
1. SIGMA FACTOR binds to RNA polymerase (holoenzyme formation)
          ↓
2. HOLOENZYME binds loosely to DNA (closed complex / recognition)
          ↓
3. HOLOENZYME scans DNA and binds to PROMOTER (-35 and -10 elements)
          ↓
4. DNA UNWINDING (~17 bp) → forms OPEN COMPLEX (melting)
          ↓
5. First phosphodiester bond formed (start with ATP or GTP)
          ↓
6. SIGMA FACTOR RELEASED (elongation begins)
          ↓
7. RNA chain elongation in 5'→3' direction
- No primer needed (unlike DNA polymerase)
- Transcription starts at +1 site
- The template strand is read 3'→5'; RNA is synthesized 5'→3'
OR: BMI and Nutrition (Alternative for Q1)
| BMI (kg/m²) | Nutritional Status |
|---|---|
| < 16.0 | Severe thinness |
| 16.0-16.9 | Moderate thinness |
| 17.0-18.4 | Mild thinness |
| 18.5-24.9 | Normal |
| 25.0-29.9 | Overweight/Pre-obese |
| 30.0-34.9 | Obese Class I |
| 35.0-39.9 | Obese Class II |
| ≥ 40.0 | Obese Class III |
| Feature | Marasmus | Kwashiorkor |
|---|---|---|
| Cause | Total calorie deficiency | Protein deficiency (adequate calories) |
| Age | < 1 year | 1-3 years (after weaning) |
| Oedema | Absent | Present (hypoalbuminaemia) |
| Muscle wasting | Severe | Moderate |
| Fatty liver | Absent | Present |
| Dermatosis | Absent | "Flaky paint" dermatosis |
| Hair changes | Thin, sparse | Depigmented, "flag sign" |
- Reduce constipation and colon cancer risk (bulk, decreased transit time)
- Lower serum cholesterol (bind bile acids - soluble fibres like pectin, oat bran)
- Reduce glycaemic index of meals (slow glucose absorption)
- Decrease risk of type 2 diabetes
- Reduce cardiovascular disease risk (by lowering LDL cholesterol)
- Prebiotic effect - feed beneficial gut bacteria
QUESTION 2: Explain Why (Any Five) - 5 × 3 = 15 Marks
i) Free Radicals Play a Beneficial Role by Killing Bacteria in Our Body
- Phagocytes (neutrophils and macrophages) deliberately generate free radicals to kill engulfed bacteria through a process called the Respiratory Burst (Oxidative Burst)
- When a phagocyte engulfs a bacterium:
RESPIRATORY BURST CASCADE:
O2 + NADPH → O2•- + NADP+   [NADPH oxidase enzyme]
         ↓
2 O2•- + 2H+ → H2O2 + O2    [Superoxide dismutase - SOD]
         ↓
H2O2 + Cl- → HOCl + OH-     [Myeloperoxidase - MPO]
         ↓
HOCl (hypochlorous acid) → DESTROYS bacterial cell walls/proteins
- HOCl (similar to bleach) is the most potent bactericidal agent produced
- Hydroxyl radicals (via Fenton reaction) also directly damage bacterial DNA, lipids, and proteins
- Clinical: Chronic Granulomatous Disease (CGD) - NADPH oxidase deficiency → recurrent bacterial infections because free radical killing is defective
ii) Haemorrhagic Disease of the Newborn is More in Breast-Fed Babies
- Low Vitamin K in breast milk: Human breast milk contains very low levels of Vitamin K (1-4 µg/L), while formula milk is supplemented with Vitamin K (50-100 µg/L)
- Sterile gut: Newborns are born with a sterile gut; intestinal bacteria (that synthesize Vitamin K2/menaquinones) are not yet colonized at birth
- Immature liver: The newborn liver is immature and has limited stores of Vitamin K
- Vitamin K does not cross the placenta well
- Vitamin K is a cofactor for γ-carboxylation of glutamate residues in clotting factors II (prothrombin), VII, IX, X (also Protein C and S)
- Without carboxylation, these clotting factors cannot bind Ca2+ and phospholipid surfaces - rendering them inactive
- Result: defective clotting cascade → bleeding tendency
Without Vitamin K:
Factors II, VII, IX, X (PIVKA = Protein Induced by Vitamin K Absence)
         ↓
Cannot bind calcium → inactive
         ↓
Prolonged PT and aPTT
         ↓
BLEEDING (haemorrhagic disease of the newborn)
iii) P53 is Termed the "Guardian of the Genome"
DNA DAMAGE (radiation, mutagens, hypoxia)
          ↓
P53 PROTEIN STABILIZED (normally rapidly degraded by MDM2)
          ↓
         / \
        /   \
       ↓     ↓
CELL CYCLE    APOPTOSIS
  ARREST       (if irreparable)
   (G1/S)
       ↓
 DNA REPAIR
       ↓
Cell survives with corrected DNA
- Cell cycle arrest: Activates transcription of p21 (CIP1), which inhibits CDK4/6-cyclin D complex → arrests cell at G1/S checkpoint
- DNA repair: Upregulates DNA repair genes (GADD45)
- Apoptosis induction: Activates pro-apoptotic genes (BAX, PUMA, NOXA) if DNA damage is irreparable
- Senescence: Permanently halts division of cells with damaged DNA
- Antiangiogenesis: Inhibits tumour blood vessel formation
iv) Genomic DNA Library and cDNA Library are NOT the Same
| Feature | Genomic DNA Library | cDNA Library |
|---|---|---|
| Starting material | Total genomic DNA | mRNA (from specific tissue) |
| Method | Restriction enzyme digestion of whole genome | Reverse transcriptase converts mRNA → cDNA |
| What it contains | ALL DNA sequences including introns, exons, promoters, regulatory regions, non-coding DNA | Only expressed gene sequences (exon sequences only, no introns) |
| Size | Very large library (entire genome) | Smaller library |
| Introns present? | YES | NO |
| Tissue-specific? | NO (same in all cells) | YES (different tissues express different genes) |
| Used for | Finding regulatory sequences, mapping genes, studying non-coding DNA | Expressing human proteins in bacteria (no introns = no splicing needed), studying gene expression patterns |
| UTRs | Present | Present (5' and 3' UTR from mRNA) |
Genomic Library:
Genomic DNA → Restriction Enzymes → Fragments (with introns) → Cloned into vector

cDNA Library:
mRNA → Reverse Transcriptase → cDNA → Cloned into vector
(introns already removed by splicing)
v) Defective Caspases in the Apoptotic Pathway May Lead to Cancer
EXTRINSIC PATHWAY              INTRINSIC PATHWAY
(Death receptors:               (Mitochondrial):
FasL, TNF-α)                   DNA damage, stress
      ↓                               ↓
FADD recruitment               BAX/BAK activation
      ↓                               ↓
Procaspase-8 →                 Cytochrome C release
Caspase-8                            ↓
      ↓                        APOPTOSOME formation
      ↓                        (Cytochrome C + Apaf-1 + Caspase-9)
      ↓←─────────────────────────────↓
           CASPASE-3 (Executioner)
                   ↓
      APOPTOSIS: protein/DNA degradation
                   ↓
           Phagocytosis of debris
- When caspase-3, -8, or -9 are defective or absent, cells cannot execute apoptosis even when they have accumulated DNA damage
- Normally, cells with irreparable DNA damage are eliminated by apoptosis (a surveillance mechanism)
- Without apoptosis:
- Genetically damaged/mutated cells survive
- Continue to proliferate
- Accumulate further mutations
- Eventually transform into cancer cells
- Many tumours show downregulation of caspases (e.g., reduced caspase-8 in neuroblastoma)
- Also, Bcl-2 overexpression (which inhibits apoptosis) is found in follicular lymphoma
vi) In Scurvy, Collagen Loses its Tensile Strength
- Hydroxylation of proline → hydroxyproline (by prolyl hydroxylase)
- Hydroxylation of lysine → hydroxylysine (by lysyl hydroxylase)
NORMAL COLLAGEN SYNTHESIS:
Proline/Lysine in pro-collagen
          ↓ (Vitamin C needed)
Hydroxylation → Hydroxyproline/Hydroxylysine
          ↓
Triple helix formation (stabilized by H-bonds with hydroxyproline)
          ↓
Secreted → Lysyl oxidase cross-links → STRONG COLLAGEN FIBERS
IN SCURVY (no Vitamin C):
Proline/Lysine NOT hydroxylated
          ↓
Unstable triple helix
          ↓
Cross-links CANNOT form
          ↓
WEAK, DISORGANIZED collagen
          ↓
Loss of tensile strength
- Bleeding gums, perifollicular haemorrhages
- Poor wound healing
- Corkscrew hairs
- Painful joints (collagen in tendons/cartilage weak)
- "Scorbutic rosary" in children (rib cartilage)
- Subperiosteal haemorrhages (collagen in periosteum weak)
QUESTION 3: Short Notes (4 × 5 = 20 Marks)
i) Mucosal Block Theory of Iron Absorption
INTESTINAL LUMEN
Fe3+ (dietary) → Reduced to Fe2+ by:
                 - Stomach acid (HCl)
                 - Ferrireductase (DcytB) on brush border
                 - Vitamin C
          ↓
Fe2+ enters mucosal cell via DMT-1 (Divalent Metal Transporter-1)
          ↓
         INSIDE MUCOSAL CELL:
              ┌──────────────────────────────────┐
              │  Iron STORED as FERRITIN          │
              │  OR                               │
              │  Transported via FERROPORTIN-1    │
              │  to blood                         │
              └──────────────────────────────────┘
          ↓                           ↓
    MUCOSAL BLOCK:            WHEN BODY NEEDS IRON:
 Iron stored in ferritin     Ferritin stores empty
 in mucosal cells            → More ferroportin
 (when body stores full)     → More transfer to blood
- When body iron is sufficient: mucosal cells are pre-loaded with ferritin (apoferritin + iron)
- New dietary iron entering the mucosal cell quickly binds to this apoferritin - it is sequestered inside the cell
- The mucosal cells are shed every 2-3 days, taking their iron stores with them back into the intestinal lumen (excreted)
- Hepcidin (liver peptide) is the master regulator: high iron → high hepcidin → hepcidin degrades ferroportin → blocks iron export to blood
- Low hepcidin levels
- Ferroportin increases on basolateral surface
- More iron transferred to blood via transferrin
- Iron poisoning: Large doses overwhelm the mucosal block
- Haemochromatosis: Defective HFE gene → hepcidin is not induced → ferroportin not degraded → excessive iron absorption
ii) Post-Translational Modifications (PTMs)
- Attachment of sugar chains (oligosaccharides) to protein
- N-linked (to asparagine-Asn): in ER and Golgi; e.g., antibodies, hormones
- O-linked (to serine/threonine): mainly in Golgi
- Function: protein folding, stability, cell recognition, receptor binding
- Addition of phosphate group (-PO4) to Ser, Thr, or Tyr residues by kinases (removed by phosphatases)
- Most common regulatory PTM
- Activates or inhibits enzyme/receptor activity
- Examples: Insulin receptor tyrosine kinase, glycogen phosphorylase
- Hydroxylation of proline (→ hydroxyproline) in collagen (requires Vit C)
- Adds -OH group, enables cross-linking
- Addition of -COOH to glutamate (→ γ-carboxyglutamate) in clotting factors II, VII, IX, X
- Requires Vitamin K
- Addition of acetyl group to N-terminal amino acids or Lys residues
- Important in histone modification (gene regulation)
- Attachment of ubiquitin peptide to Lys residues
- Tags proteins for proteasomal degradation
- Key in cell cycle regulation and protein quality control
- Addition of methyl groups (histones, DNA regulation)
- Removal of signal peptides, propeptides
- Activation of zymogens (e.g., trypsinogen → trypsin; proinsulin → insulin)
- S-S bonds between cysteine residues stabilize 3D structure
- Occurs in ER (oxidizing environment)
| PTM | Enzyme | Effect |
|---|---|---|
| Phosphorylation | Kinase/Phosphatase | Signal transduction |
| Glycosylation | Transferases | Stability, targeting |
| Ubiquitination | E1/E2/E3 ligases | Proteasomal degradation |
| Acetylation | HAT/HDAC | Gene expression |
| Proteolytic cleavage | Proteases | Activation of zymogens |
iii) Type-1 Xenobiotic Reactions (Phase I / Dehydrogenase Reactions)
- Microsomal oxidation (CYP450 system): Located in smooth ER of liver; uses Cytochrome P450 enzymes (CYP1A2, CYP2C9, CYP3A4, etc.)
RH + O2 + NADPH + H+ → ROH + H2O + NADP+
(xenobiotic)           (hydroxylated product)
- Types: Aromatic hydroxylation, aliphatic hydroxylation, N-dealkylation, O-dealkylation, S-oxidation, Deamination, Epoxidation
- Azo-reduction: Breaks azo linkage (-N=N-) → aromatic amines
- Nitro-reduction: -NO2 → -NH2
- Carbonyl reduction: Ketones/aldehydes → alcohols
- Ester hydrolysis (by esterases/pseudocholinesterases): Esters → acids + alcohols
- Amide hydrolysis: Amides → acids + amines
- Epoxide hydration
- Alcohol dehydrogenase (ADH): Ethanol → Acetaldehyde
- Aldehyde dehydrogenase (ALDH): Acetaldehyde → Acetate
- These are important Phase I steps in alcohol metabolism
CH3CH2OH → [ADH, NAD+] → CH3CHO → [ALDH, NAD+] → CH3COO-
 Ethanol                Acetaldehyde              Acetate
- May activate pro-drugs (codeine → morphine)
- May generate toxic metabolites (e.g., paracetamol → NAPQI by CYP2E1)
- Products may then undergo Phase II conjugation reactions
iv) Inhibitors of Protein Synthesis
PROKARYOTIC TRANSLATION:

                    AMINOGLYCOSIDES (streptomycin, gentamicin)
                    - Cause misreading of mRNA (30S subunit)
                              ↓
         30S ────────────────────────────────────────
INITIATION:                                             ← LINEZOLID (30S initiation)
        mRNA + tRNA(fmet) + 30S + 50S
                    ↓
ELONGATION:
  A-site: aminoacyl-tRNA binding  ← TETRACYCLINES (block A-site, 30S)
  Peptide bond formation          ← CHLORAMPHENICOL (inhibits peptidyl transferase, 50S)
  Translocation                   ← FUSIDIC ACID (blocks EF-G)
                    ↓
TERMINATION/TRANSLOCATION         ← ERYTHROMYCIN/MACROLIDES (block translocation, 50S, tunnel)
                    ↓
         50S ─────────────────────────────────────────
| Inhibitor | Target | Mechanism |
|---|---|---|
| Streptomycin, Gentamicin (Aminoglycosides) | 30S (16S rRNA) | Causes misreading of genetic code; blocks translocation |
| Tetracyclines | 30S subunit | Blocks binding of aminoacyl-tRNA to A-site |
| Chloramphenicol | 50S subunit (peptidyl transferase) | Inhibits peptide bond formation |
| Erythromycin/Macrolides | 50S subunit (23S rRNA) | Blocks translocation; premature chain termination |
| Linezolid | 50S+30S junction | Prevents formation of initiation complex |
| Rifampicin | DNA-dependent RNA polymerase | Blocks transcription (not translation directly) |
| Eukaryote-specific inhibitors: | ||
| Cycloheximide | 60S | Inhibits peptidyl transferase in eukaryotes |
| Diphtheria toxin | EF-2 (eukaryotic) | ADP-ribosylates and inactivates EF-2; blocks translocation |
| Ricin | 60S (28S rRNA) | Depurinates rRNA; inactivates ribosome permanently |
| Puromycin | Both 70S and 80S | Mimics aminoacyl-tRNA; causes premature chain termination |
QUESTION 4: Short Notes (3 × 6 = 18 Marks)
i) Mechanism of Action of Glucagon, Norepinephrine, and Epinephrine
Mechanism of Action via cAMP Pathway:
HORMONE (Glucagon/Epinephrine/Norepinephrine)
          ↓  (binds to GPCR on cell membrane)
G-PROTEIN COUPLED RECEPTOR (GPCR)
          ↓  (Gs protein activated - GDP→GTP)
ADENYLYL CYCLASE (activated)
          ↓
ATP → cAMP (cyclic AMP)
          ↓
PROTEIN KINASE A (PKA) activated
[Regulatory subunits dissociate from catalytic subunits upon cAMP binding]
          ↓
PHOSPHORYLATION OF TARGET ENZYMES
Effects in Different Tissues:
| Target Enzyme | Phosphorylated State | Effect |
|---|---|---|
| Glycogen phosphorylase | ACTIVE | Glycogenolysis ↑ |
| Glycogen synthase | INACTIVE | Glycogenesis ↓ |
| PFK-2 | INACTIVE → F-2,6-BP ↓ | Glycolysis ↓, gluconeogenesis ↑ |
| Phosphoenolpyruvate carboxykinase | ↑ expression | Gluconeogenesis ↑ |
| Hormone-Sensitive Lipase (HSL) | ACTIVE | Lipolysis ↑ |
- In liver: Same as glucagon (via β2 receptors / cAMP) - glycogenolysis
- In muscle: Glycogenolysis (via β2 receptors) - glucose for immediate energy
- In adipose tissue: Activates HSL → fatty acid release (energy source)
- In heart: (+) chronotropic and inotropic effects via β1 receptors
- Also acts via α1 receptors (IP3/DAG pathway) in some tissues
- Primarily acts via α1 and α2 receptors
- α1: vasoconstriction (IP3/DAG pathway) → increases blood pressure
- α2: presynaptic inhibition (decreases cAMP)
- Less effect on heart rate than epinephrine
- Metabolic effects similar to epinephrine but less pronounced
SUMMARY OF cAMP PATHWAY:

Hormone → Receptor → Gs → Adenylyl cyclase → ATP → cAMP
                                                       ↓
                                                    PKA activated
                                                       ↓
                                          Phosphorylates enzymes
                                         (cascade amplification)
                                                       ↓
                              GLYCOGENOLYSIS + LIPOLYSIS + GLUCONEOGENESIS
                              (Metabolic effects)
cAMP degraded by Phosphodiesterase (PDE) → 5'-AMP (terminates signal)
ii) Proto-Oncogenes, Oncogenes, and Tumour Suppressor Genes
Proto-Oncogenes
- Definition: Normal cellular genes that promote cell growth, proliferation, and differentiation
- They encode proteins like growth factors, growth factor receptors, signal transducers, and transcription factors
- Examples: RAS (G-protein signal transducer), MYC (transcription factor), ERBB2/HER2 (growth factor receptor), SRC (tyrosine kinase)
- Under tight regulatory control in normal cells
Oncogenes
- Definition: Mutated/overexpressed versions of proto-oncogenes that cause uncontrolled cell proliferation
- Act as "gain-of-function" mutations - dominant (one mutant allele is sufficient)
- A proto-oncogene is converted to an oncogene by:
- Point mutation (e.g., RAS → KRAS mutation in codons 12, 13 - constitutively active)
- Chromosomal translocation (e.g., BCR-ABL in CML - Philadelphia chromosome t(9;22))
- Gene amplification (e.g., HER2/neu amplification in breast cancer)
- Retroviral insertion (provirus inserted near proto-oncogene → its overexpression)
PROTO-ONCOGENE (normal):
Growth signal → Receptor → Signal → Response → STOPS when signal stops

ONCOGENE (mutated):
NO growth signal needed → CONSTITUTIVELY ACTIVE SIGNAL → continuous proliferation
(like a car accelerator stuck down)
Tumour Suppressor Genes (Anti-Oncogenes)
- Definition: Genes that normally inhibit cell division, promote apoptosis, or maintain genomic stability
- Act as "loss-of-function" mutations - recessive (BOTH alleles must be inactivated - "Two-Hit Hypothesis" by Knudson)
- Examples:
| Gene | Normal Function | Cancer Associated |
|---|---|---|
| TP53 | Cell cycle arrest, apoptosis | >50% of all cancers |
| RB1 (Retinoblastoma) | Inhibits E2F, blocks G1→S | Retinoblastoma, osteosarcoma |
| BRCA1, BRCA2 | DNA repair (HR) | Breast and ovarian cancer |
| APC | Inhibits β-catenin (Wnt pathway) | Familial adenomatous polyposis, colon cancer |
| PTEN | Inhibits PI3K pathway | Multiple cancers |
TWO-HIT HYPOTHESIS (Knudson):

Sporadic cancer:          Familial cancer:
Hit 1: Somatic mutation  Hit 1: Germline mutation (inherited)
Hit 2: Somatic mutation  Hit 2: Somatic mutation in target tissue
Both alleles lost → TSG inactivated → Cancer
iii) Changes in Serum LFT (Liver Function Tests) in Different Types of Jaundice
Haemoglobin (RBC breakdown)
          ↓ (in reticuloendothelial system)
Unconjugated (indirect) bilirubin [insoluble, bound to albumin]
          ↓  (uptake by liver hepatocytes)
Conjugated (direct) bilirubin [water-soluble, glucuronide]
          ↓
Secreted into bile → intestine → urobilinogen/stercobilin (stool)
                    ↑
              Part reabsorbed (enterohepatic circulation)
              → urobilinogen in urine
Comparison Table of LFT in Different Types of Jaundice:
| Parameter | Pre-hepatic (Haemolytic) | Hepatic (Hepatocellular) | Post-hepatic (Obstructive) |
|---|---|---|---|
| Cause | Excess RBC breakdown | Hepatocyte damage (hepatitis, cirrhosis) | Bile duct obstruction (stones, carcinoma) |
| Serum Bilirubin (Total) | ↑ | ↑↑ | ↑↑↑ |
| Unconjugated (indirect) | ↑↑↑ | ↑↑ | Normal/slight ↑ |
| Conjugated (direct) | Normal | ↑↑ | ↑↑↑ |
| ALT/AST (transaminases) | Normal | ↑↑↑↑ (>10× normal) | Slight ↑ (or normal) |
| ALP | Normal | Slight ↑ | ↑↑↑↑ (very high) |
| GGT | Normal | ↑ | ↑↑↑↑ |
| Serum Albumin | Normal | ↓ (if chronic) | Normal |
| PT (Prothrombin time) | Normal | ↑ (doesn't correct with Vit K) | ↑ (corrects with Vit K) |
| Urine Bilirubin | Absent (unconjugated can't be filtered) | Present | Present |
| Urine Urobilinogen | ↑↑ | ↑ (or ↓ in severe) | Absent (no bile reaching gut) |
| Stool colour | Dark (↑ stercobilin) | Pale | Clay-coloured (acholic) |
- In obstructive jaundice: ALP is very high (produced by bile duct epithelium under bile pressure), direct bilirubin predominates, acholic stools, no urobilinogen in urine
- In hepatocellular: ALT/AST dramatically elevated (hepatocyte necrosis releases enzymes), mixed bilirubinemia
- In pre-hepatic: Only unconjugated bilirubin rises, all liver enzymes normal, dark urine (urobilinogen), dark stools
QUESTION 5: Short Notes (4 × 5 = 20 Marks)
i) Renal Defence in Acid-Base Imbalance
1. Bicarbonate Reabsorption (Proximal Tubule - 85%)
In tubular lumen:
HCO3- + H+ → H2CO3 → CO2 + H2O
(CO2 diffuses into cell)

Inside tubular cell:
CO2 + H2O → [Carbonic anhydrase] → H2CO3 → H+ + HCO3-

H+ secreted back into lumen (via Na+/H+ antiporter)
HCO3- enters blood via Na+/HCO3- cotransporter
2. Titratable Acid Excretion (Distal Tubule)
- H+ secreted by H+-ATPase combines with HPO4²- in tubule:
- HPO4²- + H+ → H2PO4- (excreted in urine)
- This allows excretion of H+ while regenerating HCO3-
3. Ammonium Excretion (Distal Tubule/Collecting Duct)
Glutamine → [glutaminase in renal cells] → NH3 + Glutamate
NH3 + H+ → NH4+ (trapped in tubular lumen, excreted in urine)
Response to Acid-Base Disorders:
- ↑ H+ secretion
- ↑ NH4+ excretion (NH3 production from glutamine increases)
- ↑ Titratable acid excretion
- ↑ HCO3- reabsorption → Net result: Urine becomes acidic (pH < 5.5), new HCO3- generated
- ↓ H+ secretion
- ↑ HCO3- excretion in urine → Urine becomes alkaline (pH > 7)
- Same as metabolic acidosis response (kidneys compensate over 3-5 days)
ii) Lac Operon
Structure:
REGULATORY GENE    OPERATOR    STRUCTURAL GENES
      |               |         |
    lacI ── P ── O ── lacZ ── lacY ── lacA
              ↑
           Promoter

lacZ = β-galactosidase (breaks lactose → glucose + galactose)
lacY = β-galactoside permease (transports lactose into cell)
lacA = β-galactoside transacetylase (minor role)
Regulation:
lacI gene → constitutively expressed → REPRESSOR PROTEIN synthesized
                                              ↓
                                       Binds to OPERATOR
                                              ↓
                            RNA polymerase CANNOT transcribe lacZ, Y, A
                                              ↓
                                       Operon is SWITCHED OFF
Lactose enters cell → converted to ALLOLACTOSE
                              ↓
                    Allolactose binds to REPRESSOR
                              ↓
                   Repressor INACTIVATED (allosteric change)
                              ↓
               Operator FREE → RNA polymerase binds promoter
                              ↓
            lacZ, lacY, lacA genes TRANSCRIBED
                              ↓
          Lactose metabolised (β-galactosidase cleaves it)
- When glucose is available, cAMP levels are LOW → CAP (Catabolite Activator Protein) is inactive → weak transcription even if repressor removed
- When glucose is absent, cAMP levels RISE → cAMP binds CAP → CAP-cAMP binds to DNA upstream of promoter → ENHANCES RNA polymerase binding → strong transcription
BOTH required for full expression:
1. Lactose present (removes repressor) AND
2. Glucose absent (high cAMP → CAP activated)
| Glucose | Lactose | cAMP | CAP | Repressor | Transcription |
|---|---|---|---|---|---|
| + | - | Low | Inactive | Bound to Op | OFF |
| + | + | Low | Inactive | Free | Low (leaky) |
| - | - | High | Active | Bound to Op | OFF |
| - | + | High | Active | Free | HIGH (ON) |
iii) Different Renal Clearance Tests in Chronic Kidney Disease (CKD)
- U = urinary concentration of substance
- V = urine volume per minute
- P = plasma concentration of substance
Tests Used in CKD:
- Inulin is freely filtered, not reabsorbed, not secreted, not metabolized
- Inulin clearance = True GFR = 125 mL/min (normal)
- Not used routinely (requires IV infusion, complex)
- Endogenous marker, 24-hour urine collection
- Slightly overestimates GFR (some tubular secretion of creatinine)
- Normal: ~90-120 mL/min
- Formula: (Urine Cr × Urine Vol/min) / Plasma Cr
- In CKD: decreases proportionally to GFR loss
- Uses serum creatinine + age + sex + race
- CKD staging based on eGFR:
| Stage | GFR (mL/min/1.73m²) | Description |
|---|---|---|
| G1 | ≥ 90 | Normal/high with markers |
| G2 | 60-89 | Mildly decreased |
| G3a | 45-59 | Mild-moderately decreased |
| G3b | 30-44 | Moderate-severely decreased |
| G4 | 15-29 | Severely decreased |
| G5 | < 15 | Kidney failure |
- PAH is filtered + actively secreted → completely cleared in one pass
- PAH clearance = Effective Renal Plasma Flow = ~625 mL/min
- Renal Blood Flow = RPF / (1 - Hct) = ~1200 mL/min
- Glucose Tm: Threshold = ~180 mg/dL plasma glucose; Tm glucose = ~375 mg/min (tubular reabsorption capacity)
- Tm PAH: Measures maximal tubular secretion capacity = ~80 mg/min
- Older test, rarely used now
- Partially reabsorbed in tubules; underestimates GFR
- Normal: 70 mL/min
- Creatinine and urea rise in serum (azotemia)
- GFR progressively falls
- Phosphate clearance falls → hyperphosphatemia
- Bicarbonate clearance affected → metabolic acidosis
iv) Types of Hypersensitivity Reactions
Type I - Immediate (IgE-Mediated / Anaphylactic)
First exposure:
Antigen (allergen) → IgE antibodies produced → IgE binds to mast cells/basophils

Second exposure:
Allergen crosslinks IgE on mast cells
          ↓
DEGRANULATION of mast cells
          ↓
Release of: Histamine, Leukotrienes (LTC4, LTD4), PGD2, Tryptase
          ↓
Vasodilation, bronchoconstriction, ↑ vascular permeability, ↑ mucus
- Time: Within minutes (15-30 min)
- Examples: Allergic rhinitis, asthma, urticaria, anaphylaxis, food allergy
- Mediators: Histamine, leukotrienes, prostaglandins
- Test: Skin prick test, serum IgE, RAST
Type II - Cytotoxic (IgG or IgM antibody against cell-surface antigens)
Antigen on cell surface → IgG/IgM antibodies
          ↓
Complement activation (MAC - membrane attack complex)
OR
ADCC (Antibody-Dependent Cellular Cytotoxicity)
OR
Opsonization → phagocytosis
          ↓
Cell destruction
- Time: Hours
- Examples: Haemolytic anaemia (drug-induced), transfusion reactions, Rh incompatibility, Goodpasture's syndrome, Myasthenia gravis (receptor blockade)
Type III - Immune Complex-Mediated
Antigen + Antibody → IMMUNE COMPLEXES
          ↓
Deposited in blood vessel walls, glomeruli, joints, skin
          ↓
Complement activation → neutrophil recruitment → lysosomal enzymes
          ↓
TISSUE DAMAGE (vasculitis, nephritis)
- Time: 4-8 hours (Arthus reaction); 10-21 days (serum sickness)
- Examples: SLE, post-streptococcal glomerulonephritis, serum sickness, farmer's lung
- Lab: Low complement (C3, C4), immune complexes in blood/tissue
Type IV - Delayed (Cell-Mediated / T-cell mediated)
Antigen presented to T cells (by APC via MHC II)
          ↓
Sensitized CD4+ Th1 cells (memory cells form)

Second exposure:
CD4+ T cells activated → release cytokines (IFN-γ, TNF-α, IL-2)
          ↓
Macrophage activation → granuloma formation
CD8+ CTLs directly kill antigen-bearing cells
          ↓
TISSUE DAMAGE
- Time: 48-72 hours (delayed)
- Examples: Contact dermatitis (nickel, poison ivy), tuberculin test (Mantoux), graft rejection, type 1 diabetes
| Type | Mediator | Time | Classic Example |
|---|---|---|---|
| I (Anaphylactic) | IgE, Mast cells, Histamine | Minutes | Anaphylaxis, asthma |
| II (Cytotoxic) | IgG/IgM + Complement | Hours | Haemolytic anaemia, transfusion reaction |
| III (Immune complex) | IgG/IgM complexes + Complement | 4-8 h | SLE, serum sickness |
| IV (Delayed/Cell-mediated) | T cells, Macrophages, Cytokines | 48-72 h | Tuberculin test, contact dermatitis |
QUESTION 6: Mark the Correct Response (12 × 1 = 12 Marks)
i) In Obstructive Jaundice, Which Enzyme is NOT Significantly Elevated?
-
ALP (Alkaline Phosphatase): ↑↑↑↑ (markedly elevated) - produced by bile duct epithelium in response to back-pressure of bile; hallmark of cholestasis
-
GGT (Gamma-Glutamyl Transferase): ↑↑↑ - also elevated in obstructive jaundice; confirms biliary source of ALP rise
-
5'-NT (5'-Nucleotidase): ↑↑ - liver-specific enzyme elevated in cholestasis; differentiates hepatic from bone source of ALP
-
ALT (Alanine Aminotransferase): NOT significantly elevated - ALT is a marker of hepatocellular damage/necrosis. In pure obstructive jaundice (without secondary hepatocellular damage), ALT is normal or only mildly raised. It rises dramatically only when hepatocytes are damaged (hepatitis, acute liver injury).
ii) A 10-Year-Old Girl with Pellagra-Like Rash and Increased Urinary Indole Acetic Acid and Indole Pyruvic Acid
- Tryptophan cannot be absorbed from intestine → passes to colon → bacterial metabolism of tryptophan → produces Indole Acetic Acid and Indole Pyruvic Acid → excreted in large amounts in urine (aminoaciduria of neutral amino acids)
- Tryptophan cannot be reabsorbed in renal tubules → neutral aminoaciduria
- Tryptophan is precursor to Niacin (Vitamin B3) - without tryptophan, Niacin cannot be synthesized → Pellagra-like symptoms (4 D's: Dermatitis, Diarrhoea, Dementia, Death)
- Neurological symptoms - tryptophan is also the precursor to serotonin and affects brain function
- Phenylketonuria: Deficiency of phenylalanine hydroxylase; elevated phenylalanine and phenylpyruvic acid in urine, NOT indole compounds; presents with intellectual disability and fair skin
- Alkaptonuria: Deficiency of homogentisic acid oxidase; homogentisic acid in urine → darkens on standing (ochronosis); no neurological symptoms initially
- Homocystinuria: Deficiency of cystathionine synthase; elevated homocysteine; Marfan-like features, lens dislocation, thrombosis; no pellagra
iii) Hyperventilation, pH 7.3, pCO2 20 mmHg, Serum Bicarbonate 23 mEq/L
| Parameter | Given Value | Normal Range |
|---|---|---|
| pH | 7.3 | 7.35-7.45 |
| pCO2 | 20 mmHg | 35-45 mmHg |
| HCO3- | 23 mEq/L | 22-26 mEq/L |
- pH = 7.3 → ACIDOSIS (below 7.35)
- pCO2 = 20 mmHg → very LOW (normal 35-45) → points to respiratory ALKALOSIS (excess CO2 blown off by hyperventilation)
- HCO3- = 23 mEq/L → near normal
- The hyperventilation is compensatory for an underlying metabolic acidosis
- HCO3- of 23 is still near normal initially (the question cuts off)
- The pCO2 of 20 with pH 7.3 suggests metabolic acidosis with respiratory compensation (Kussmaul breathing)
- pH ↑ (alkalosis)
- pCO2 ↓ (PRIMARY change due to hyperventilation)
- HCO3- ↓ slightly (renal compensation, takes days)
Sources: Basic Medical Biochemistry - A Clinical Approach 6e (Lieberman & Peet); Robbins & Kumar Pathologic Basis of Disease; Janeway's Immunobiology 10e; Thompson & Thompson Genetics & Genomics in Medicine 9e; Tietz Textbook of Laboratory Medicine 7e; Harrison's Principles of Internal Medicine 22e.