Surfactant, hb oxygen dissociation curve , functional residual volume, vital capacity, transport of gases, neural regulation of respiration,
Reading File
Finding Sources
Finding Sources
Finding Sources
Finding Sources
Finding Sources
Finding Sources
Reading File
Reading File
Reading File
Reading File
Reading File
Finding Sources
Reading File
Finding Sources
Reading File
Finding Sources
Finding Sources
Loading Image
Loading Image
Loading Image
I now have comprehensive textbook content and images. Let me compile the full answer on all six topics.
Respiratory Physiology: Complete Notes
1. Surfactant
What Is It?
Surfactant is a mixture of phospholipids (primarily dipalmitoyl phosphatidylcholine, DPPC) that lines the alveolar surface and reduces surface tension. It is synthesized from fatty acids by Type II alveolar cells.
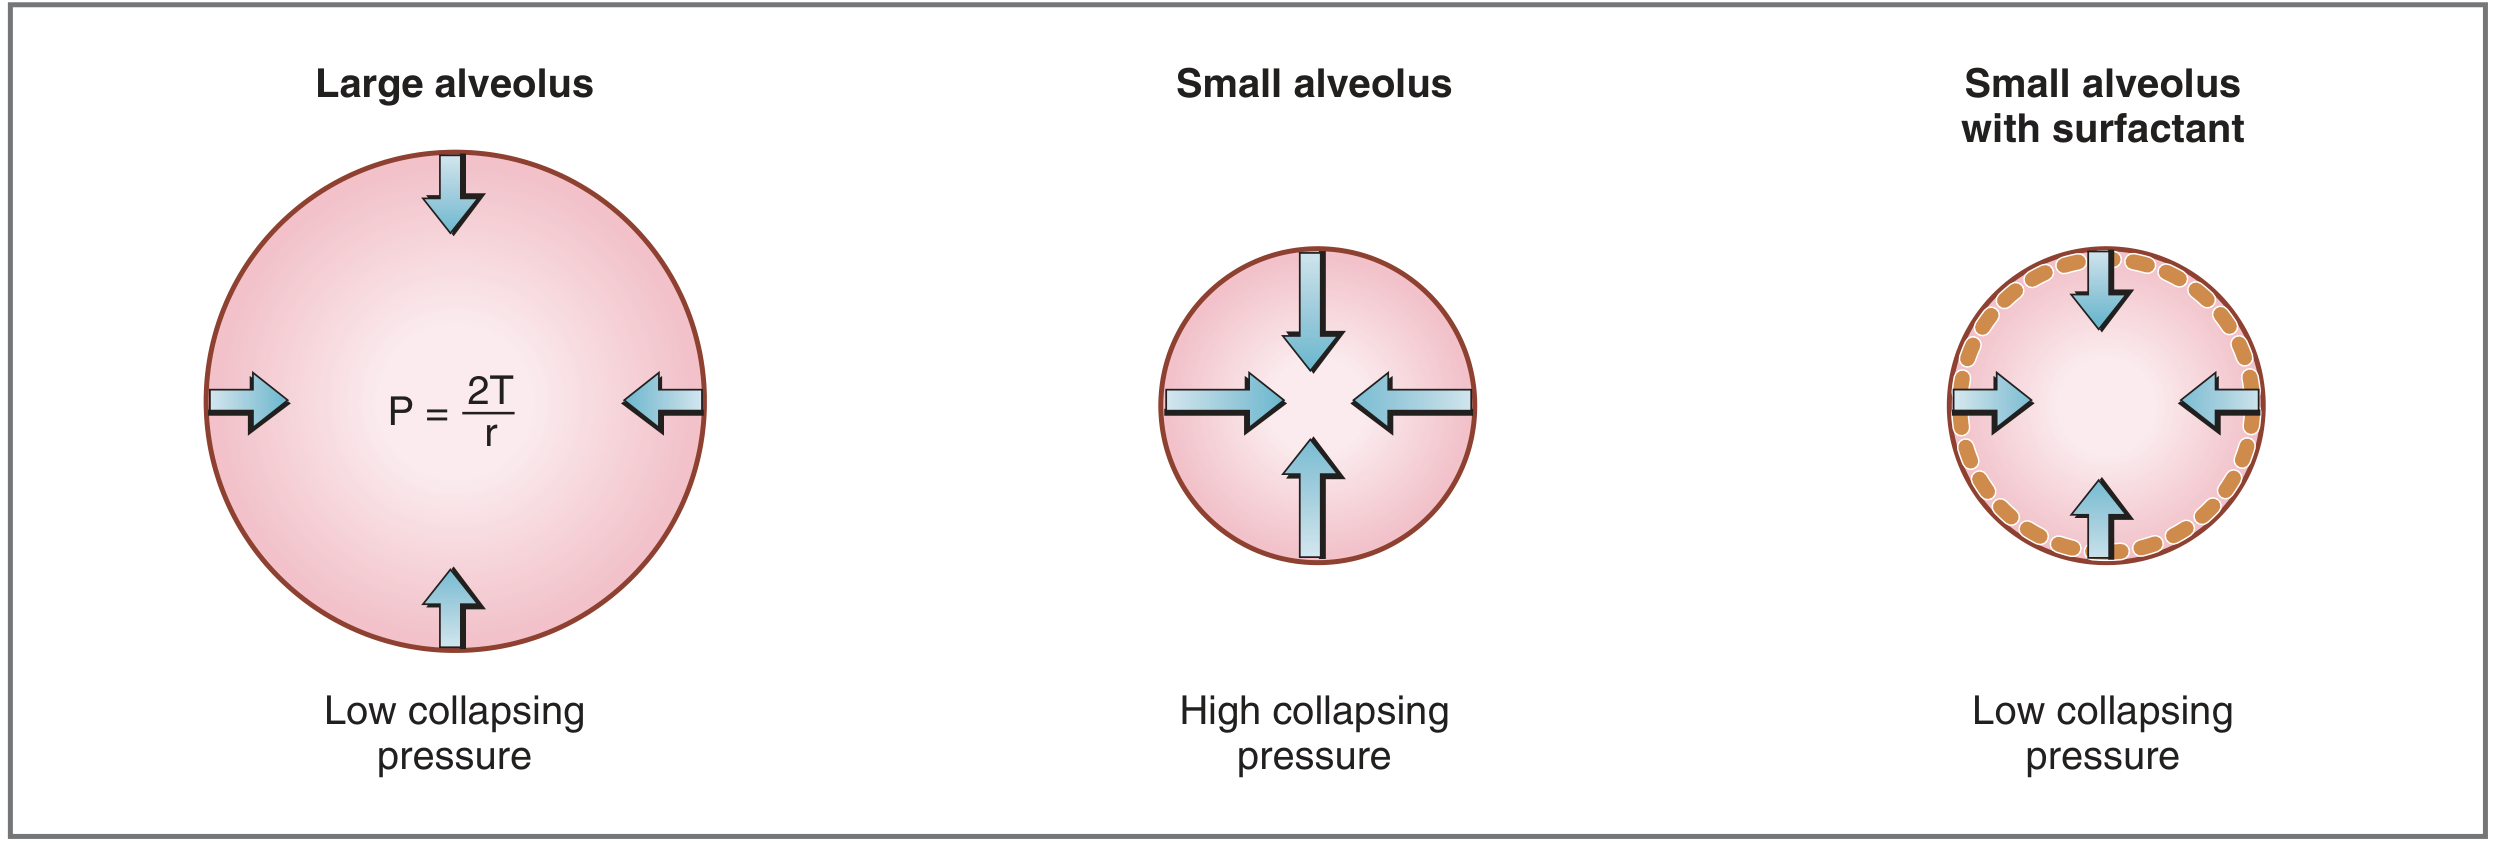
How It Works — Law of Laplace
The collapsing pressure of an alveolus is governed by:
P = 2T / r
Where P = collapsing pressure, T = surface tension, r = radius.
- A small alveolus has a small radius → high collapsing pressure → tends to collapse (atelectasis)
- Surfactant reduces T, thus reduces P even in small alveoli, keeping them open
Mechanism of DPPC
DPPC is amphipathic (hydrophobic on one end, hydrophilic on the other). The molecules align on the alveolar surface, and intermolecular forces between DPPC molecules break up the attractive forces between water molecules — thereby lowering surface tension.
Functions of Surfactant
- Prevents alveolar collapse (atelectasis) — especially in small alveoli
- Increases lung compliance — reduces work of breathing during inspiration
- Keeps alveoli of different sizes stable (prevents large alveoli from emptying into small ones)
Clinical Significance — Neonatal Respiratory Distress Syndrome (NRDS)
- Surfactant synthesis begins at gestational week 24, almost always present by week 35
- Premature infants (<35 weeks) may lack surfactant
- Consequences: alveolar collapse, hypoxemia (shunt physiology), decreased compliance, increased work of breathing
- Treatment: exogenous surfactant therapy
— Costanzo Physiology 7th Edition
2. Hemoglobin–Oxygen Dissociation Curve
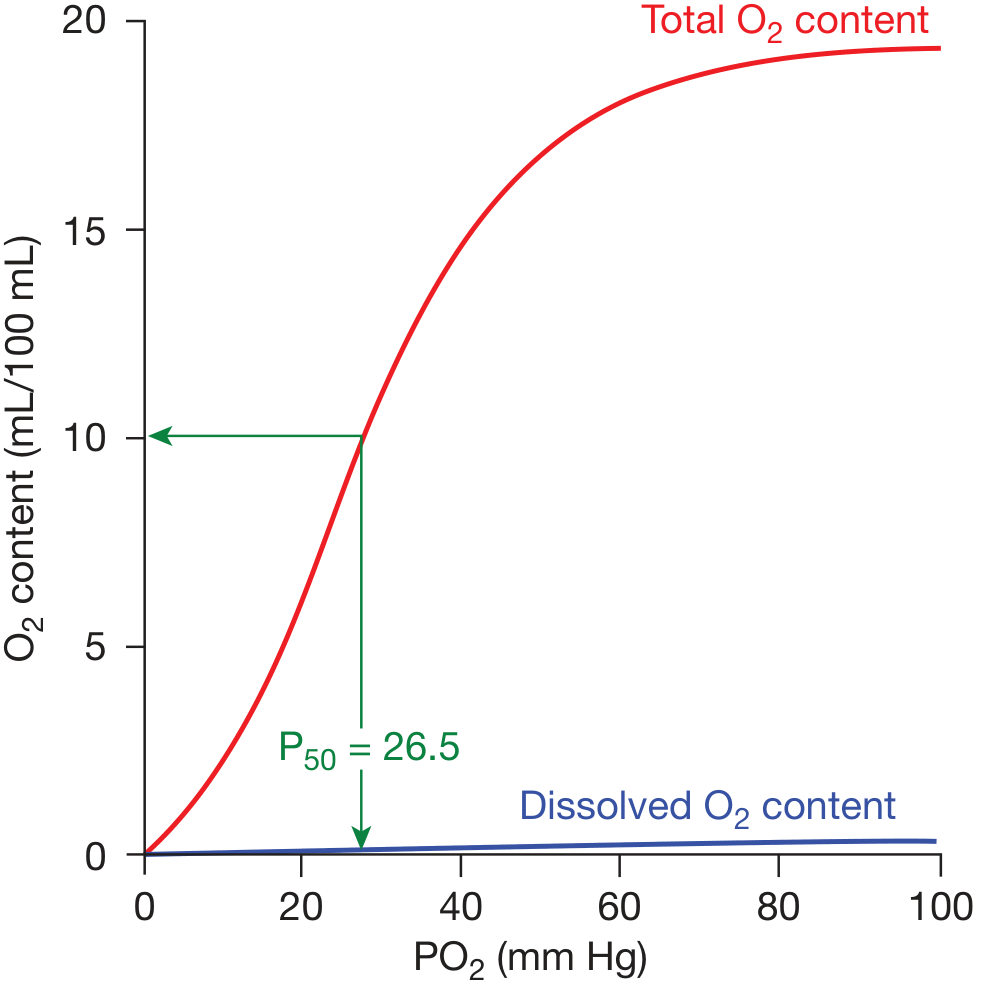
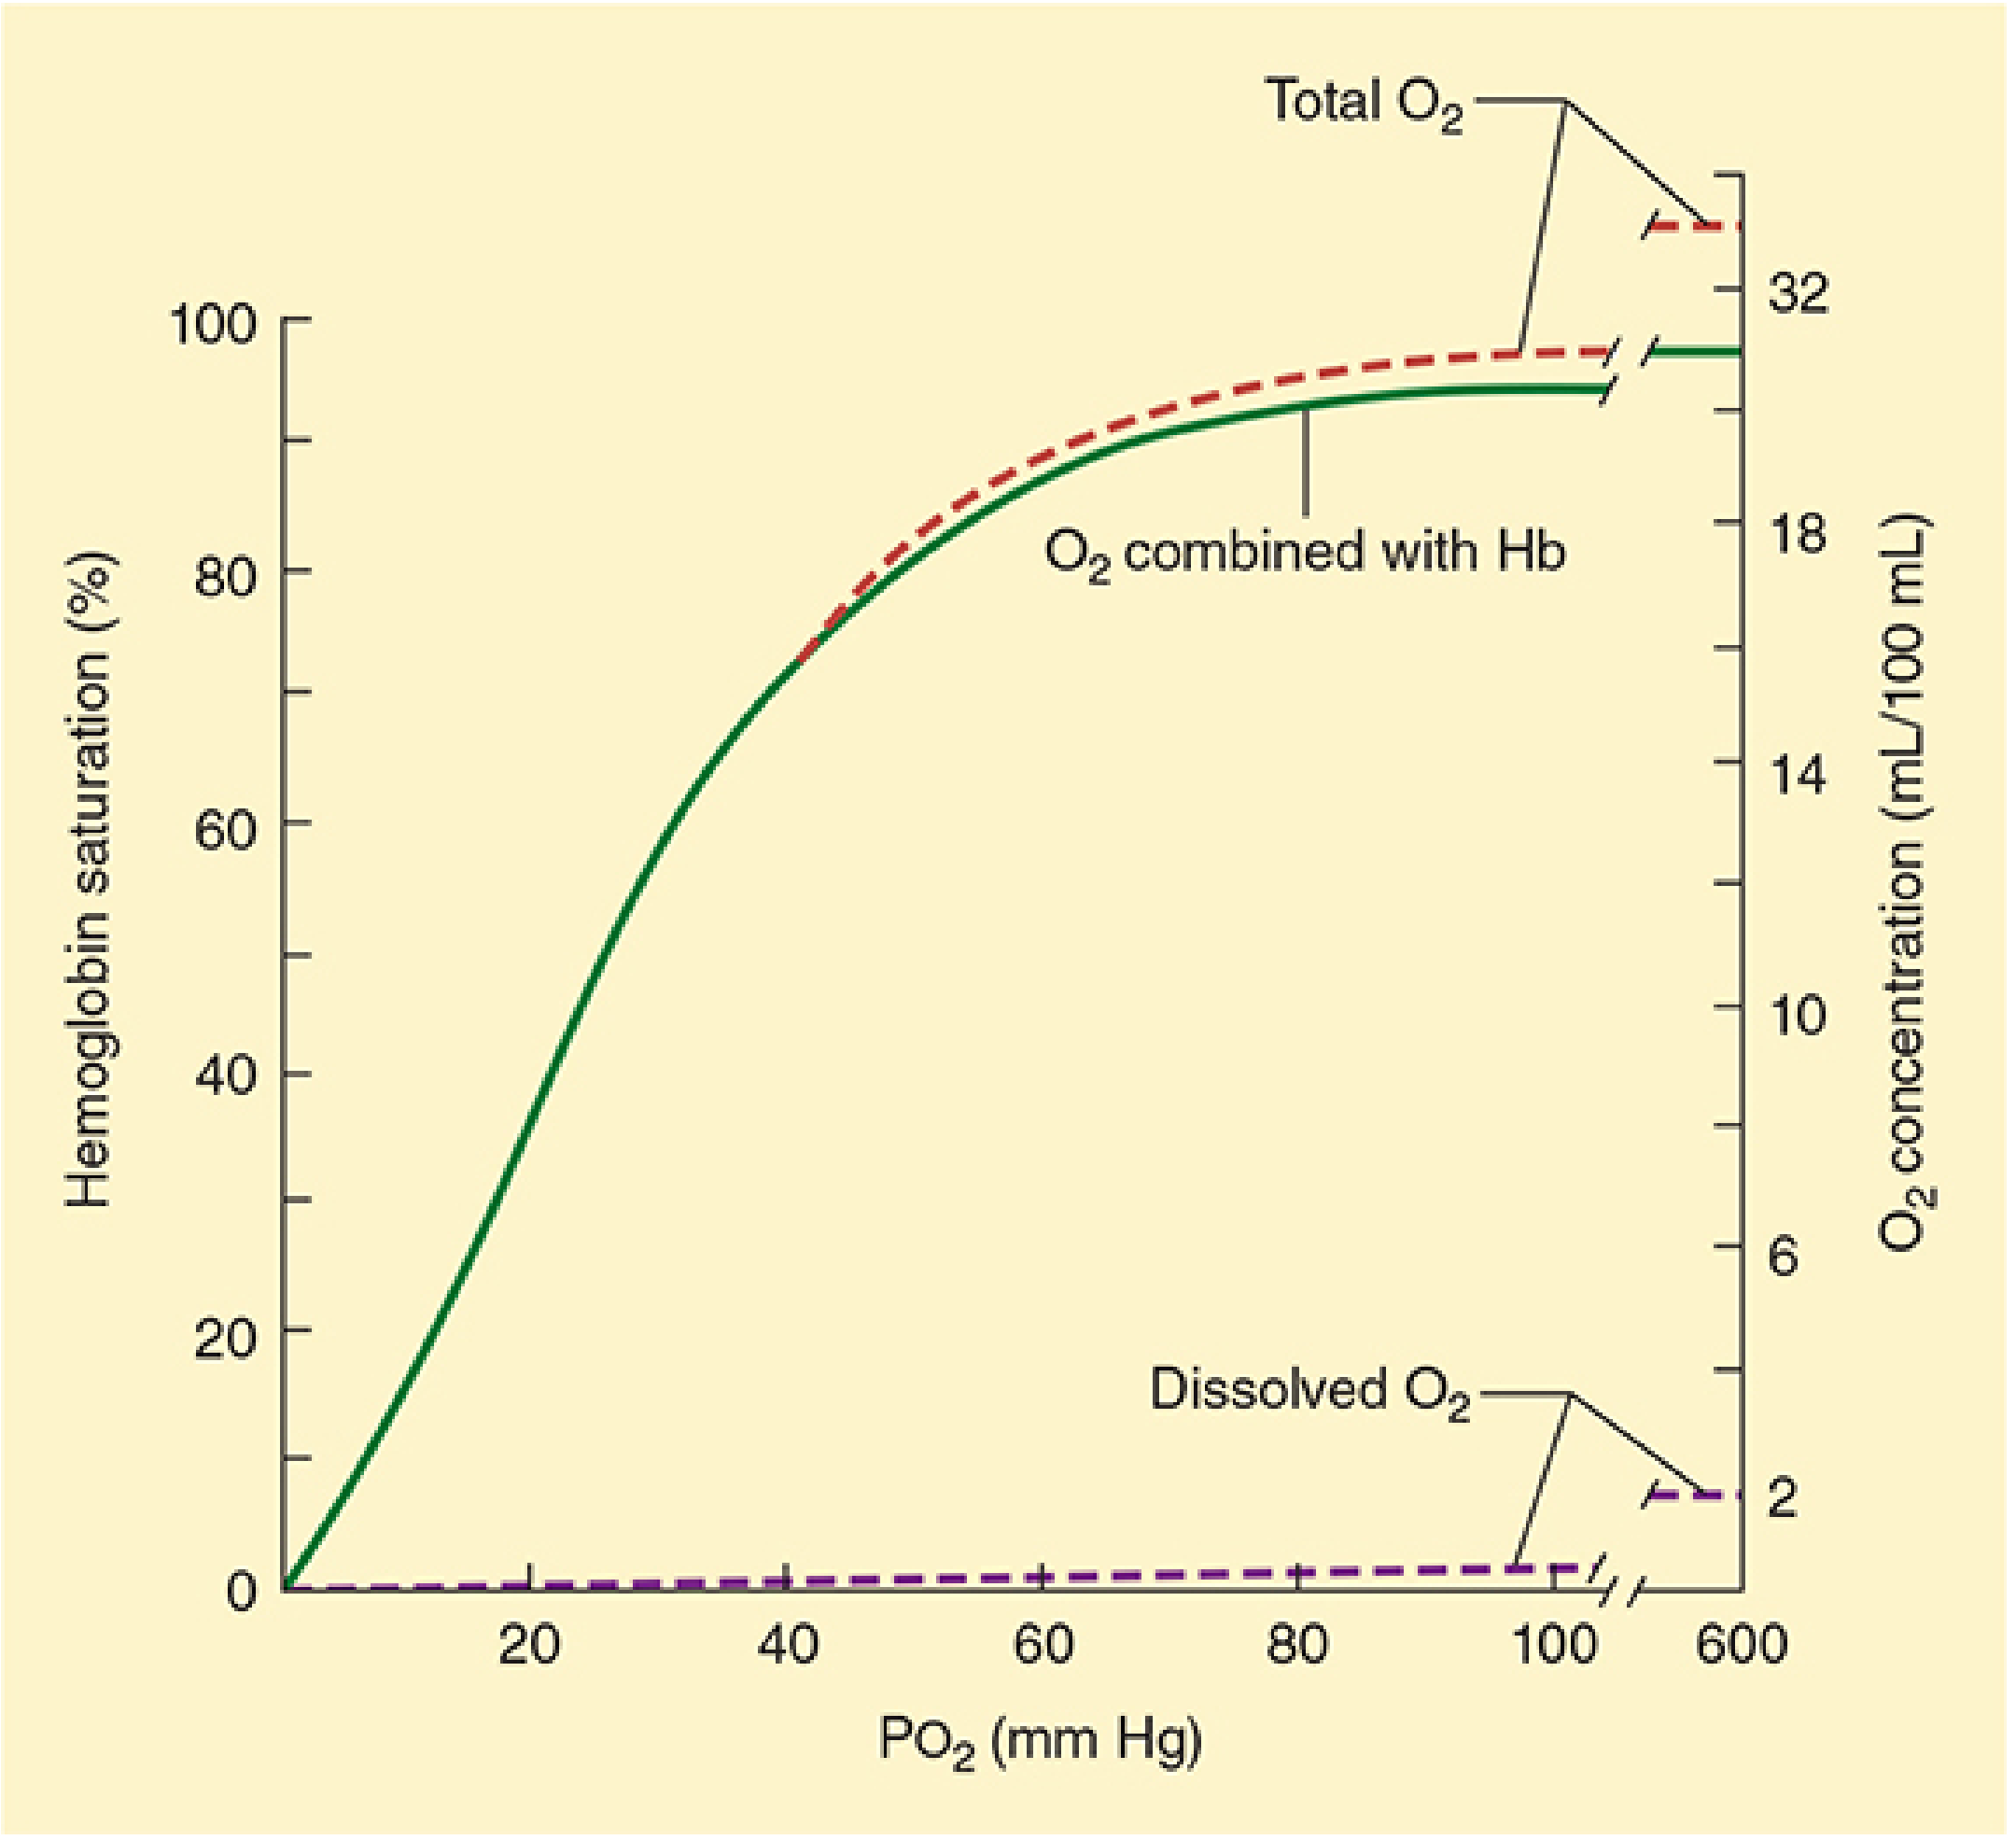
The Curve
The O₂ dissociation curve is sigmoid (S-shaped) because of cooperative binding. Each Hb molecule binds up to 4 O₂ molecules; binding of the first three induces conformational changes that greatly accelerate binding of the fourth.
Key Values
| Parameter | Value |
|---|---|
| Normal P₅₀ (adults) | 26.6 mmHg |
| Arterial PO₂ | ~100 mmHg → ~97.5% saturation |
| Mixed venous PO₂ | ~40 mmHg → ~75% saturation |
| O₂ carrying capacity of Hb | 1.39 mL O₂/g Hb (theoretical) |
| Dissolved O₂ coefficient | 0.003 mL/dL/mmHg |
Physiological Significance of the Sigmoid Shape
- Flat upper portion (PO₂ 60–100 mmHg): Hb remains ~90% saturated even with drops in PaO₂ — protects loading of O₂ in the lungs
- Steep lower portion (PO₂ 20–60 mmHg): Large amounts of O₂ are released with modest drops in PO₂ — facilitates O₂ unloading at tissues
Shifts of the Curve
| Direction | Causes | Effect |
|---|---|---|
| Right shift (↑P₅₀) | ↑ temperature, ↑ PCO₂, ↓ pH (acidosis), ↑ 2,3-DPG | ↓ O₂ affinity → more O₂ released to tissues (Bohr effect) |
| Left shift (↓P₅₀) | ↓ temperature, ↓ PCO₂, ↑ pH (alkalosis), ↓ 2,3-DPG, fetal Hb (HbF), CO poisoning | ↑ O₂ affinity → less O₂ released to tissues |
- At rest, only 25% of delivered O₂ is extracted (normal extraction fraction)
— Fishman's Pulmonary Diseases and Disorders; Morgan & Mikhail's Clinical Anesthesiology 7e
3. Functional Residual Capacity (FRC)
Definition
FRC is the volume of gas remaining in the lungs at the end of a normal, passive expiration. At FRC, the inward elastic recoil of the lung is exactly balanced by the outward elastic recoil of the chest wall (including resting diaphragmatic tone).
FRC = Expiratory Reserve Volume (ERV) + Residual Volume (RV)
Measurement
FRC cannot be measured by simple spirometry (it includes RV). Methods:
- Nitrogen washout (open-circuit)
- Helium dilution (closed-circuit)
- Body plethysmography (most accurate, measures all gas including trapped gas)
Factors That Alter FRC
| Factor | Effect on FRC |
|---|---|
| ↑ Height | ↑ FRC (directly proportional) |
| Obesity | ↓↓ FRC (reduced chest wall compliance, ↑ abdominal pressure) |
| Female sex | ~10% lower than males |
| Supine position | ↓ FRC (abdominal contents push up diaphragm) |
| ↑ Intraabdominal pressure (pregnancy, ascites, laparoscopy) | ↓ FRC |
| Restrictive lung disease | ↓ FRC (decreased compliance) |
| Obstructive lung disease (e.g., emphysema) | ↑ FRC (air trapping, hyperinflation) |
| Phrenic nerve paralysis | ↓ FRC (loss of diaphragmatic tone) |
Clinical Importance
- FRC serves as the oxygen reservoir during apnea — at FRC, the lungs contain ~450 mL O₂
- Reduced FRC → rapid O₂ desaturation during apnea (critical in obstetric/obese patients)
- FRC determines the closing capacity relationship — when FRC < closing capacity, small airways close during normal tidal breathing → V/Q mismatch and hypoxemia
— Morgan & Mikhail's Clinical Anesthesiology 7e; Fishman's Pulmonary Diseases
4. Vital Capacity (VC) and Lung Volumes
Lung Volume Subdivisions
TLC (Total Lung Capacity)
├── VC (Vital Capacity)
│   ├── IC (Inspiratory Capacity)
│   │   ├── TV (Tidal Volume, ~500 mL)
│   │   └── IRV (Inspiratory Reserve Volume)
│   └── ERV (Expiratory Reserve Volume)
└── RV (Residual Volume) — cannot be measured by spirometry
Also: FRC = ERV + RV
Vital Capacity
- Definition: Maximum volume of air that can be exhaled after a maximal inspiration (or inhaled from RV to TLC)
- Measured by spirometry: subject inhales maximally, then exhales completely (no time limit = "slow VC")
- FVC (Forced Vital Capacity) = VC performed with maximal effort and speed
VC Can Be Reduced By Two Mechanisms
- ↓ TLC — restrictive disease (pulmonary fibrosis, chest wall deformity, neuromuscular weakness)
- ↑ RV — obstructive disease (emphysema, asthma → air trapping)
- Only by measuring both TLC and RV can these two causes be differentiated
Combined VC vs. Simple VC
- In severe airflow obstruction: combined VC > simple VC — reflects trapped gas in poorly ventilated regions (increased transmural pressure causes airway closure during the single exhalation maneuver near RV)
Normal Reference Values (approximate)
| Volume | Normal (adult male) |
|---|---|
| TLC | ~6 L |
| VC | ~4.8 L |
| FRC | ~2.4 L |
| RV | ~1.2 L |
| TV | ~0.5 L |
— Murray & Nadel's Textbook of Respiratory Medicine
5. Transport of Respiratory Gases
Oxygen Transport
Form 1: Dissolved O₂
- Governed by Henry's Law: concentration = solubility coefficient × partial pressure
- Solubility coefficient for O₂ = 0.003 mL/dL/mmHg
- At PaO₂ = 100 mmHg: only 0.3 mL/dL dissolved — physiologically small but essential for diffusion
Form 2: Bound to Hemoglobin
- Each gram of Hb carries up to 1.39 mL O₂; normal Hb = 15 g/dL
- Hb molecule: 4 heme + 4 protein subunits; only ferrous iron (Fe²⁺) binds O₂
Total O₂ content formula:
CaO₂ = (0.003 × PaO₂) + (SaO₂ × Hb × 1.31)
- Normal CaO₂ ≈ 19.5 mL/dL
- Normal CvO₂ ≈ 14.8 mL/dL
- A-V O₂ difference ≈ 4.7 mL/dL
O₂ Delivery (DO₂)
DO₂ = CaO₂ × Cardiac Output Normal = ~1000 mL O₂/min (20 mL/dL × 50 dL/min)
- Normal extraction fraction = 25% (body uses 25% of delivered O₂)
- When DO₂ falls critically, VO₂ becomes supply-dependent → lactic acidosis from cellular hypoxia
Carbon Dioxide Transport
CO₂ is carried in three forms:
| Form | % of CO₂ in venous blood |
|---|---|
| Dissolved CO₂ | ~5% |
| Bicarbonate (HCO₃⁻) | ~90% (largest fraction) |
| Carbamino compounds (CO₂ + Hb → carbaminohemoglobin) | ~5% |
Bicarbonate Formation
CO₂ + H₂O ⇌ H₂CO₃ ⇌ H⁺ + HCO₃⁻
- In tissue capillaries: CO₂ enters RBCs → carbonic anhydrase converts to HCO₃⁻ → HCO₃⁻ exits RBC into plasma; Cl⁻ enters RBC (Hamburger / chloride shift)
- In pulmonary capillaries: reverse occurs — Cl⁻ exits RBC, HCO₃⁻ re-enters, converted back to CO₂ which is exhaled
Haldane Effect
- Deoxygenated Hb has 3.5× greater affinity for CO₂ as carbaminohemoglobin, and acts more as a base — takes up H⁺, driving bicarbonate formation
- At lungs: oxygenation of Hb → it acts as an acid, releases H⁺ → drives CO₂ formation and exhalation
- Net result: venous blood carries more CO₂ than arterial blood
— Morgan & Mikhail's Clinical Anesthesiology 7e
6. Neural Regulation of Respiration
Overview
Respiration is controlled by a network of neurons in the brainstem (medulla oblongata and pons), with inputs from chemoreceptors, mechanoreceptors, and higher cortical centers.
Respiratory Centers
A. Medullary Centers (primary rhythm generators)
-
Dorsal Respiratory Group (DRG)
- Located in the nucleus tractus solitarius
- Primarily drives inspiration
- Receives input from peripheral chemoreceptors (CN IX/X) and stretch receptors
- Sets the baseline inspiratory rhythm
-
Ventral Respiratory Group (VRG)
- Located in the nucleus ambiguus and nucleus retroambigualis
- Contains both inspiratory and expiratory neurons
- Active mainly during forced/active breathing
- The pre-Bötzinger complex (within VRG) is the key rhythmogenesis center — pacemaker for breathing
B. Pontine Centers
-
Pneumotaxic Center (Pontine Respiratory Group, PRG)
- Located in the upper pons (nucleus parabrachialis)
- Limits inspiration — sends inhibitory signals to DRG, shortening inspiratory duration
- Controls respiratory rate and pattern; increases respiratory frequency
-
Apneustic Center
- Located in the lower pons
- Tends to prolong inspiration (apneusis = sustained inspiratory gasp)
- Normally inhibited by the pneumotaxic center
- If pneumotaxic center is damaged and vagus nerve is cut → apneustic breathing
Chemoreceptor Inputs
Central Chemoreceptors
- Located on the ventrolateral surface of the medulla
- Respond to changes in CSF pH (H⁺ concentration) — NOT directly to CO₂
- CO₂ crosses the blood-brain barrier → combines with H₂O → H⁺ + HCO₃⁻ → ↓ CSF pH → stimulates ventilation
- Primary driver of resting ventilation
- Do NOT respond to hypoxia
Peripheral Chemoreceptors
- Carotid bodies (CN IX — glossopharyngeal) — most important
- Aortic bodies (CN X — vagus)
- Respond to: ↓ PaO₂ (most potent stimulus), ↑ PaCO₂, ↓ pH, ↓ blood flow
- Main defense against hypoxia
- In COPD with chronic CO₂ retention: central receptors become desensitized; peripheral chemoreceptors become the primary drive ("hypoxic drive")
Mechanical/Reflex Inputs
| Reflex | Receptor | Effect |
|---|---|---|
| Hering-Breuer inflation reflex | Pulmonary stretch receptors (slowly adapting) in airway smooth muscle | Lung inflation → inhibits further inspiration (limits tidal volume) |
| Deflation reflex | Rapidly adapting (irritant) receptors | Deflation/irritants → stimulates inspiration/coughing |
| J-receptors (juxtacapillary) | Alveolar walls near capillaries | Pulmonary edema/congestion → rapid shallow breathing, dyspnea |
| Proprioceptors | Joints, muscles | Exercise → immediate ↑ in ventilation |
Pattern of Normal Breathing
Inspiration is active (diaphragm + external intercostals contract). Normal expiration is passive (elastic recoil). Active expiration uses internal intercostals and abdominal muscles.
Summary Table
| Topic | Key Point |
|---|---|
| Surfactant | DPPC from Type II cells; reduces surface tension; prevents atelectasis; deficient in NRDS |
| O₂-Hb Dissociation Curve | Sigmoid; P₅₀ = 26.6 mmHg; right shift = ↑ O₂ delivery (Bohr effect) |
| FRC | ERV + RV; set by lung-chest wall equilibrium; reduced in obesity/supine/restrictive disease |
| Vital Capacity | VC = IRV + TV + ERV; reduced by ↓TLC or ↑RV |
| Gas Transport | O₂: dissolved + Hb-bound; CO₂: mainly as HCO₃⁻ (90%); Hamburger shift; Haldane effect |
| Neural Control | DRG (inspiration) + VRG (active breathing); Pneumotaxic (limits inspiration); Central (CO₂/pH) + Peripheral (hypoxia) chemoreceptors |
This is a shared conversation. Sign in to Orris to start your own chat.