
How to read an ecg
ECG electrocardiogram reading interpretation diagram waves PQRST
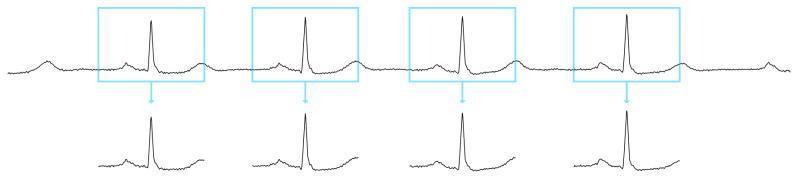
This diagnostic image illustrates the process of ECG signal preprocessing and heartbeat extraction for clinical analysis. The top portion of the diagram shows a continuous electrocardiogram (ECG) waveform containing a series of successive heartbeats. Four specific sections of this signal are demarcated by light blue rectangular windows, each centered on a prominent R-peak. Below the continuous trace, arrows point to isolated 600 ms segments corresponding to the boxed areas. Each isolated segment clearly displays the classic PQRST complex morphology: a low-amplitude P wave representing atrial depolarization, a high-amplitude R-peak indicating ventricular depolarization, and a broader T wave representing ventricular repolarization. This visualization demonstrates the segmentation technique used in automated ECG classification systems (such as those using the MIT-BIH database) to prepare individual heartbeats for algorithmic rhythm analysis. The uniform appearance of the extracted windows suggests a stable sinus rhythm, and the consistent windowing (108 samples before and after the peak) is a standard approach in biomedical signal processing for feature extraction and abnormal beat detection.
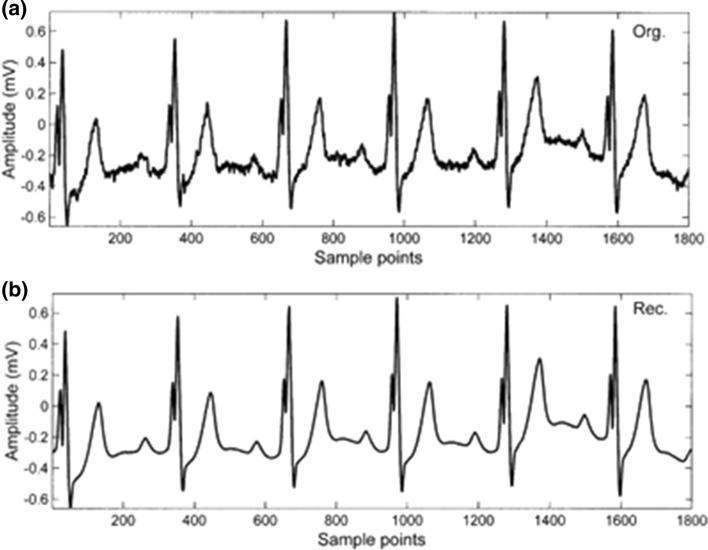
This diagnostic image presents a comparative analysis of electrocardiogram (ECG) signal processing. Panel (a) displays the original raw ECG trace, characterized by visible baseline wander, high-frequency noise, and slight morphological irregularities in the PQRST complexes over 1800 sample points. The amplitude ranges approximately from -0.6 mV to 0.7 mV. Panel (b) shows the reconstructed signal following the application of a Singular Value Decomposition (SVD) algorithm. In the reconstructed trace, there is a significant reduction in noise, resulting in a smoothed baseline and more uniform wave morphologies. The primary physiological features, including the P-waves, QRS complexes, and T-waves, are preserved, though minor notching and high-frequency fluctuations from the original signal are filtered out. This comparison demonstrates the efficacy of SVD in biomedical signal denoising and feature extraction while maintaining the essential diagnostic intervals and amplitudes required for cardiac rhythm analysis.
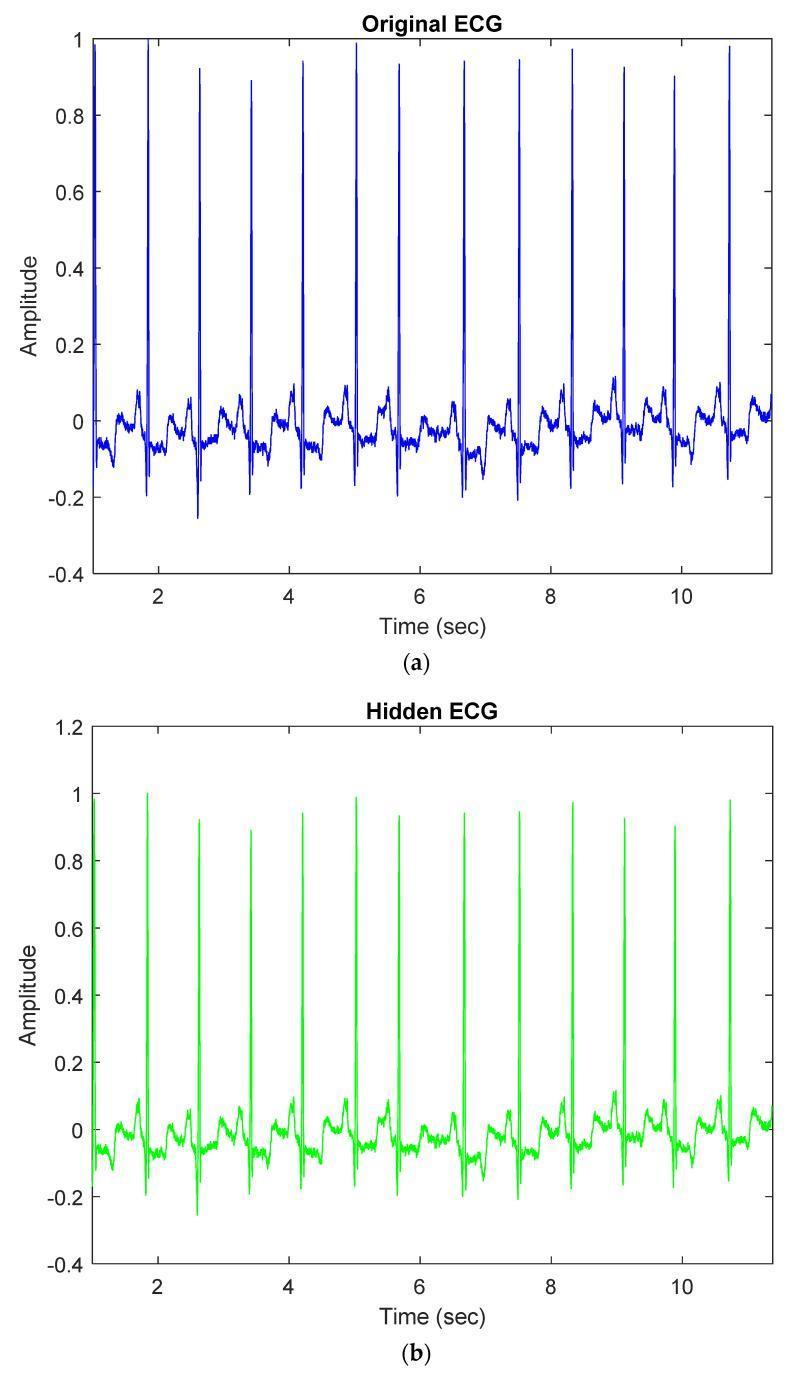
A multi-panel medical diagnostic graphic comparing an original electrocardiogram (ECG) signal with an embedded or 'hidden' ECG signal used for medical data steganography. Panel (a) displays a 10-second 'Original ECG' trace in blue, showing rhythmic cardiac cycles with prominent R-wave spikes, P-waves, and T-waves at a frequency of approximately 1 Hz (60 bpm) and an amplitude range of -0.2 to 1.0. Panel (b) shows the 'Hidden ECG' trace in green, which maintains the morphological integrity and clinical diagnostic features of the original signal despite the data embedding process. The comparison illustrates how clinical signals can be utilized as carriers for confidential patient information (such as name or medical history) via wavelet-domain optimization techniques. The focus is on demonstrating that the signal quality remains high enough for diagnostic interpretation after the embedding of metadata, with minimal visual distortion in the PQRST waveform components.
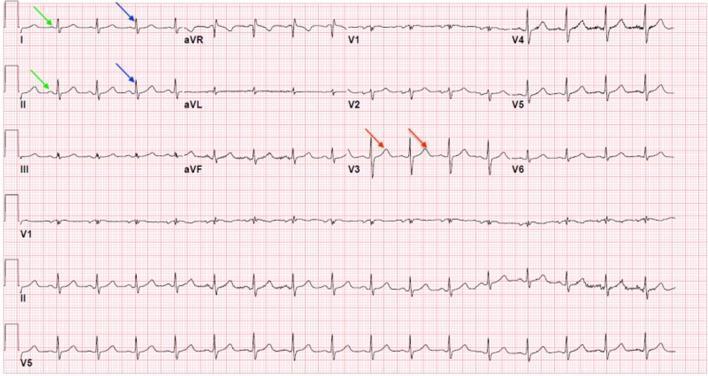
This diagnostic image shows a standard 12-lead electrocardiogram (ECG) recorded on a pink grid background. The layout consists of several horizontal strips displaying cardiac electrical activity from different leads (I, II, III, aVR, aVL, aVF, and V1–V6). Each strip exhibits the characteristic repeating PQRST wave cycle. Green arrows identify the P waves, representing atrial depolarization. Blue arrows indicate the QRS complexes, which represent ventricular depolarization and exhibit the highest amplitude in the cycle. Red arrows point to the T waves in lead V3, signifying ventricular repolarization. The morphological features vary across leads: P waves appear as small positive deflections, QRS complexes vary in polarity and height based on the lead orientation, and T waves are generally broad and rounded. At the bottom, a continuous rhythm strip (Lead II) is provided for long-term rhythm assessment. This visual is used to teach waveform identification, heart rate calculation, and the diagnosis of cardiac conditions like arrhythmias or myocardial injury.
ECG lead placement 12-lead standard axis normal values
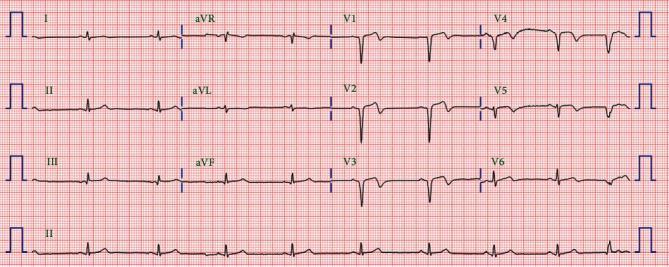
A standard 12-lead electrocardiogram (ECG) displayed on a traditional red grid background. The tracing demonstrates a normal sinus rhythm with a regular rate and consistent P-wave morphology preceding each narrow QRS complex. The axis appears normal with positive QRS deflections in leads I and aVF. There is normal R-wave progression across the precordial leads (V1-V6), characterized by an increasing R-wave amplitude and decreasing S-wave depth as the transition occurs from V1 to V5. Of clinical importance in this post-percutaneous coronary intervention (PCI) context, the ST segments are isoelectric without evidence of acute elevation or depression, and the T waves are largely upright in the lateral leads. Notably, the QT interval is within normal limits, demonstrating no signs of prolongation. This ECG serves as a baseline comparison for evaluating subsequent rhythmic stability or drug-induced repolarization abnormalities in patients treated for myocardial infarction.
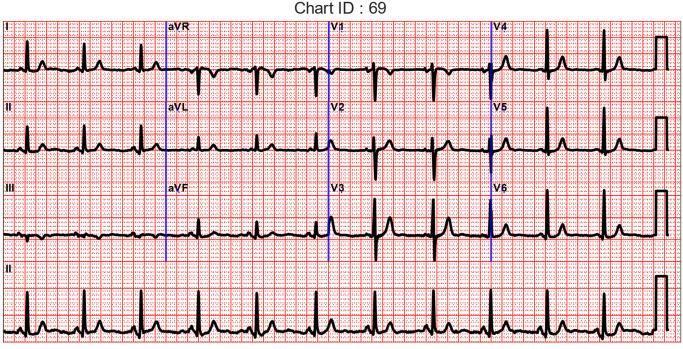
This diagnostic image shows a standard 12-lead electrocardiogram (ECG) displayed on a red-ruled grid. The chart is organized into four rows: the top three rows represent the standard limb leads (I, II, III), augmented limb leads (aVR, aVL, aVF), and precordial leads (V1–V6) in a three-channel format, while the bottom row provides a continuous rhythm strip of Lead II. Each lead demonstrates clear P waves, narrow QRS complexes, and T waves, indicating a normal sinus rhythm. The grid follows standard calibration where the vertical axis represents voltage (10 mm = 1 mV) and the horizontal axis represents time (25 mm = 1 s). Notable morphology includes normal R-wave progression from V1 through V6 and typical negative deflections in aVR. The image serves as a clinical reference for assessing cardiac electrical activity and is used in medical education to teach lead placement, waveform identification, and cardiac rhythm interpretation.
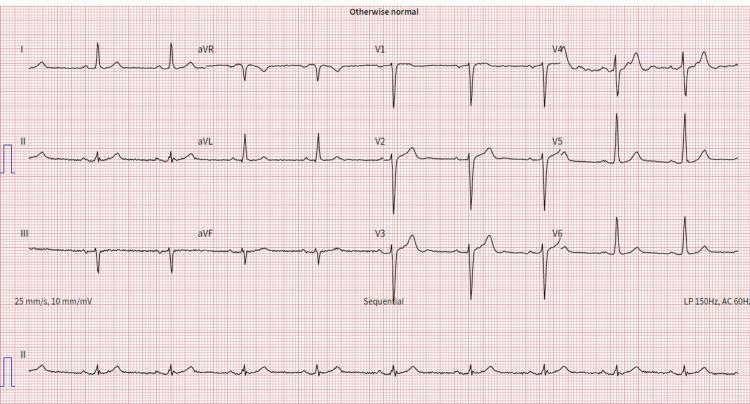
A standard 12-lead electrocardiogram (ECG/EKG) displayed on a red grid background with calibration settings of 25 mm/s and 10 mm/mV. The leads are organized in a four-column by three-row layout (I, II, III; aVR, aVL, aVF; V1, V2, V3; V4, V5, V6) with a continuous rhythm strip of Lead II at the bottom. The tracing shows a normal sinus rhythm with clearly identifiable P waves, narrow QRS complexes, and upright T waves in most leads. A notable diagnostic finding is left axis deviation, characterized by a predominantly positive QRS complex in lead I and a negative QRS complex in leads II, III, and aVF. Annotations on the tracing include 'Otherwise normal' at the top, 'Sequential' in the center, and filter settings (LP 150Hz, AC 60Hz) in the bottom right corner. This image serves as a clinical example of an ECG tracing used for assessing cardiac electrical activity and axis orientation in cardiovascular medicine.
PR interval QRS complex ST segment T wave normal ECG measurements
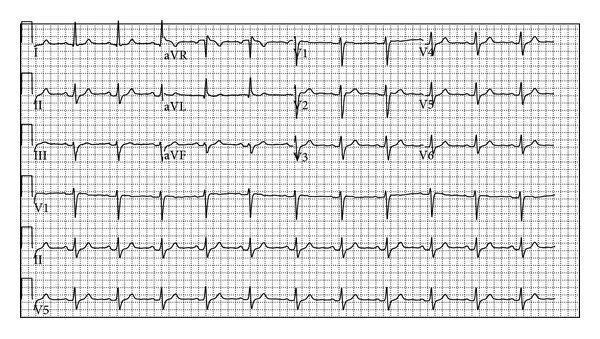
A standard 12-lead electrocardiogram (ECG) displayed on a traditional grid background. The tracing shows a normal sinus rhythm with a heart rate estimated at approximately 60–80 beats per minute. Each QRS complex is preceded by a clear, upright P wave in the inferior leads (II, III, and aVF). The PR interval and QRS duration appear to be within normal limits. The QRS complexes demonstrate normal axis and progression across the precordial leads (V1-V6). The ST segments are predominantly isoelectric, and T waves are upright in most leads, including leads I, II, aVF, and V3-V6. No overt signs of acute ischemia, such as significant ST-segment elevation or depression, are readily identifiable in this initial recording. The image serves as a baseline clinical diagnostic tool for evaluating cardiac electrical activity in a patient presenting with syncope, illustrating the transition from a seemingly unremarkable initial ECG to subsequent diagnostic findings associated with Brugada syndrome.
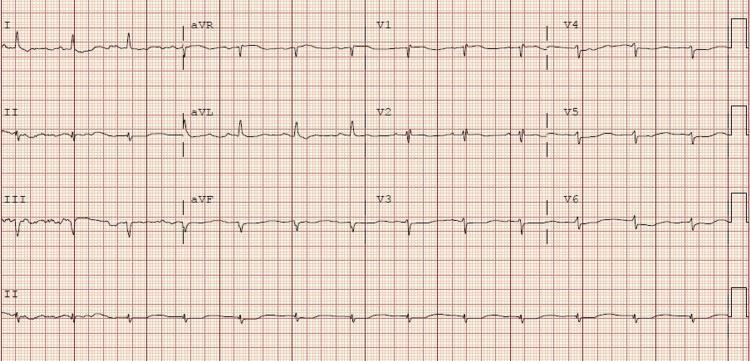
A standard 12-lead electrocardiogram (ECG) on red grid paper demonstrating a narrow complex sinus rhythm at a rate of approximately 78 beats per minute. The rhythm is regular with consistent P-wave morphology and a stable PR interval, indicating a sinoatrial node origin. The QRS complexes are narrow (within normal limits), suggesting normal intraventricular conduction. Noteworthy features include deep, pathologic-appearing Q waves in the inferior leads (II, III, and aVF), which may indicate a prior inferior myocardial infarction. The ST segments are generally isoelectric, although very mild ST-segment depression is visible in some leads. T waves appear upright in most leads but show relatively low amplitude. There is no clear evidence of prominent U waves. The calibration signal (10mm/mV) is visible on the far right. This ECG serves as an educational example of monitoring cardiac rhythm and conduction stability in the context of critical illness and metabolic recovery.
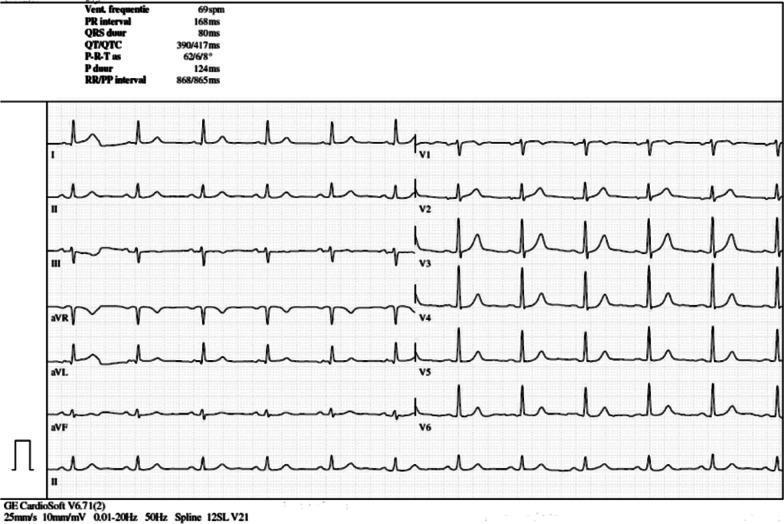
A 12-lead electrocardiogram (ECG) printed on standard grid paper (25 mm/s, 10 mm/mV). The tracing demonstrates a normal sinus rhythm at a ventricular rate of 69 bpm. P waves are present before every QRS complex with a PR interval of 168 ms. The QRS complexes are narrow (80 ms) with a normal axis. In the limb leads (I, II, III, aVR, aVL, aVF), the waveforms show consistent morphology and appropriate polarity. The precordial leads (V1-V6) show expected R-wave progression, with V4-V6 demonstrating prominent R-wave amplitudes. T waves are concordant with the QRS complexes in most leads, though minor T-wave inversion is visible in V1 and V2. Automated measurements provided at the top of the tracing include: Heart rate 69 bpm, PR interval 168 ms, QRS duration 80 ms, QT/QTc 390/417 ms, and P duration 124 ms. This ECG serves as a baseline 'reassuring' study for a patient undergoing immunotherapy, showing no acute ST-segment changes or arrhythmias.
How to Read an ECG
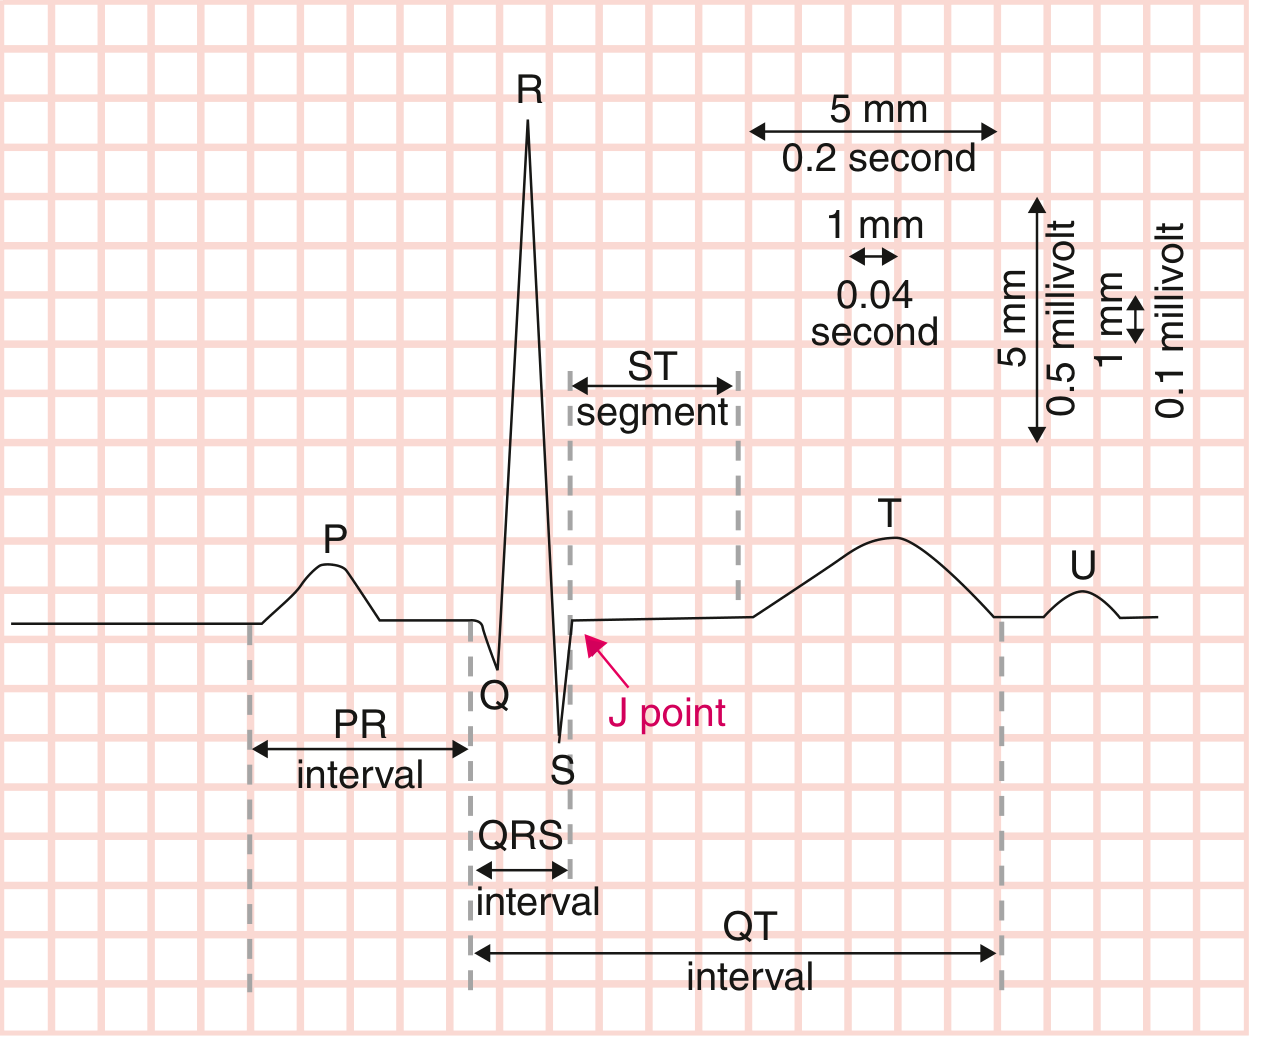
The Paper and Scale
- Horizontal axis = time: 1 small box = 0.04 sec; 1 large box = 0.2 sec
- Vertical axis = voltage: 1 small box = 0.1 mV; 10 small boxes = 1 mV
- Standard speed is 25 mm/second
Step 1 - Rate
Heart rate = 60,000 / RR interval (in ms)
Step 2 - Rhythm
- Regular: R-R intervals are equal throughout
- Regularly irregular: a pattern exists (e.g., every 3rd beat is early)
- Irregularly irregular: no pattern (classic for atrial fibrillation)
Step 3 - P Wave
- Duration: < 120 ms (< 3 small boxes)
- Upright in leads I, II, aVF; inverted in aVR
- Rounded and monophasic
- Absent: AF, junctional rhythm
- Wide and notched ("P mitrale"): left atrial enlargement
- Tall and peaked ("P pulmonale"): right atrial enlargement
- Inverted in II: ectopic atrial or junctional rhythm
Step 4 - PR Interval
| Finding | Interpretation |
|---|---|
| PR > 200 ms | 1st degree AV block |
| PR progressively lengthens then dropped beat | 2nd degree (Mobitz I / Wenckebach) |
| Dropped beats without PR change | 2nd degree (Mobitz II) |
| No relationship between P and QRS | 3rd degree (complete) heart block |
| PR < 120 ms + delta wave | WPW syndrome (pre-excitation) |
Step 5 - QRS Complex
- Capital letters (Q, R, S) = large deflections (≥ 5 mm / 0.5 mV)
- Lowercase (q, r, s) = small deflections (< 5 mm)
- First negative deflection = Q (or q)
- First positive deflection = R (or r)
- Negative deflection after R = S (or s)
| Finding | Interpretation |
|---|---|
| Wide QRS > 120 ms | Bundle branch block or ventricular rhythm |
| RBBB | RSR' ("rabbit ears") in V1, wide S in I/V6 |
| LBBB | Broad notched R in I, V5, V6; no Q in lateral leads |
| Pathological Q wave (> 25% of R height, > 40 ms wide) | Prior myocardial infarction |
Step 6 - ST Segment
| Finding | Interpretation |
|---|---|
| ST elevation ≥ 1 mm in ≥ 2 contiguous leads | STEMI, pericarditis, Brugada, early repolarization |
| ST depression ≥ 0.5-1 mm | Ischemia (NSTEMI/UA), digoxin effect, LVH strain |
| Diffuse saddle-shaped elevation | Pericarditis |
| Concave up elevation | Early repolarization (benign variant) |
- Inferior (II, III, aVF): RCA territory
- Anterior (V1-V4): LAD territory
- Lateral (I, aVL, V5-V6): Circumflex territory
- Posterior (tall R in V1-V2 + ST depression): Posterior wall
Step 7 - T Wave
| Finding | Interpretation |
|---|---|
| Peaked/tall T waves | Hyperkalemia (early), hyperacute MI |
| T wave inversion | Ischemia, LVH strain, RBBB, PE (V1-V3) |
| Flat T waves | Hypokalemia, ischemia |
| Biphasic T waves in V1-V2 | Wellens syndrome (critical LAD stenosis) |
Step 8 - QT Interval
Step 9 - Axis
| Lead I | Lead aVF | Axis |
|---|---|---|
| Positive | Positive | Normal (-30° to +90°) |
| Positive | Negative | Left axis deviation |
| Negative | Positive | Right axis deviation |
| Negative | Negative | Extreme (northwest) axis |
- Left axis deviation (< -30°): LBBB, left anterior fascicular block, inferior MI
- Right axis deviation (> +90°): RVH, PE, RBBB, lateral MI, normal in children
Step 10 - Hypertrophy Criteria
RVH: R > S in V1, right axis deviation, P pulmonale
Normal ECG Reference Intervals
| Parameter | Normal Range |
|---|---|
| Heart rate | 50-100 bpm |
| P wave duration | < 120 ms |
| PR interval | 90-200 ms |
| QRS duration | 75-110 ms |
| QTc (male) | 390-450 ms |
| QTc (female) | 390-460 ms |
| QRS axis | -30° to +90° |
A Practical Checklist
- Rate (fast/slow/normal?)
- Rhythm (regular/irregular? P before every QRS?)
- P wave (present, normal morphology?)
- PR interval (normal? prolonged? short?)
- QRS (narrow or wide? axis? R progression?)
- ST segment (elevated? depressed? at baseline?)
- T wave (upright? inverted? peaked?)
- QTc (prolonged?)
- Any additional findings (U wave, delta wave, J wave?)