
1. Discuss Molecular basis of carcinogenesis in detail. 2. Hallmarks of cancer 3. Oncogenes 4. Tumor suppressor genes 5. Tumor micro environment 6. Lab diagnosis of cancer of unknown origin, including IHC. 7. What is carcinogenesis, discuss various causes like chemical, viral, and radiation. 8. Discuss molecular techniques used in pathology laboratory Please refer to Robbins and cotran pathologic basis of disease
hallmarks of cancer diagram circular Hanahan Weinberg
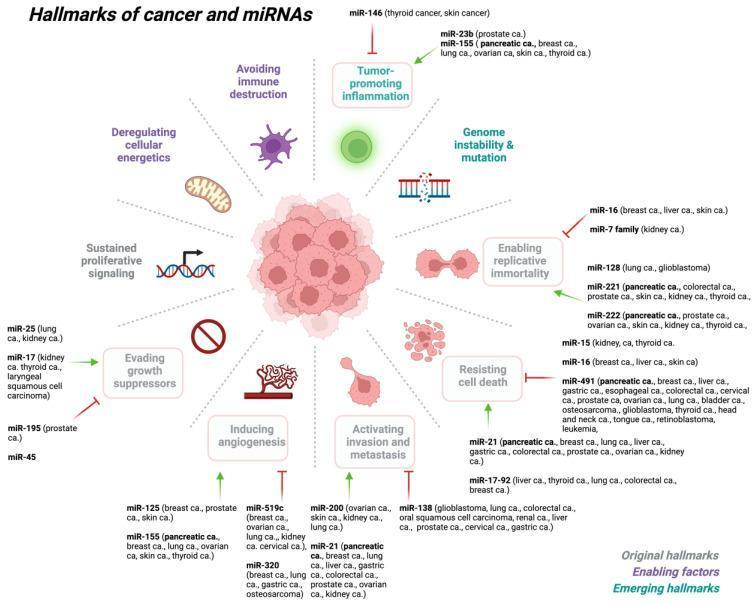
This medical infographic illustrates Hanahan and Weinberg’s hallmarks of cancer and their regulation by specific microRNAs (miRNAs). Centered around a primary tumor mass, ten hallmarks are arranged radially: Sustained proliferative signaling (DNA helix), Deregulating cellular energetics (mitochondrion), Avoiding immune destruction (leukocyte), Tumor-promoting inflammation, Genome instability & mutation (fragmented DNA), Enabling replicative immortality (dividing cells), Resisting cell death (apoptotic bodies), Activating invasion and metastasis (migrating cells), Inducing angiogenesis (vessel sprouting), and Evading growth suppressors. The diagram classifies these into original hallmarks, enabling factors, and emerging hallmarks. Specific miRNAs (oncomiRs and tumor-suppressor miRs) are linked to each hallmark with green arrows (activation) or red bars (inhibition). For example, miR-21 is shown promoting metastasis and resisting cell death across multiple cancers (pancreatic, breast, lung), while miR-155 is linked to inflammation and angiogenesis. The diagram serves as an educational summary of how non-coding RNA dysregulation drives malignant transformation and progression in various human cancers, including lung, colorectal, and prostate carcinomas.
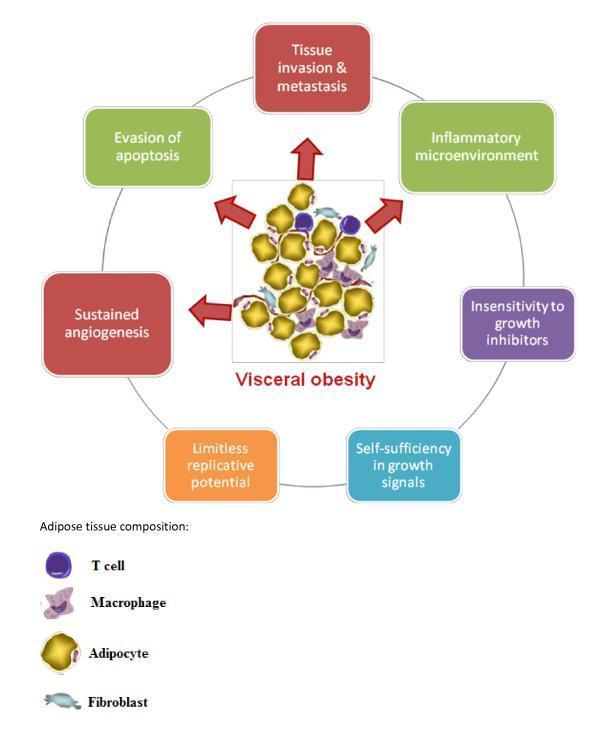
This pathophysiology diagram illustrates the link between visceral obesity and the hallmarks of cancer. At the center is a cluster labeled 'Visceral obesity' depicting the cellular composition of adipose tissue, including yellow round adipocytes, purple irregular macrophages, small spherical T cells, and elongated blue fibroblasts. Red arrows radiate from this central cluster toward surrounding boxes that represent specific tumorigenic processes influenced by the obese state. These hallmarks are arranged in a circular flow and include: tissue invasion and metastasis, inflammatory microenvironment, insensitivity to growth inhibitors, self-sufficiency in growth signals, limitless replicative potential, sustained angiogenesis, and evasion of apoptosis. The diagram uses color-coded rounded rectangles (red, green, orange, blue, and purple) to categorize these biological capabilities. This educational tool demonstrates how the metabolically active milieu of visceral fat promotes a pro-tumorigenic environment, facilitating cancer development and progression through altered immune, metabolic, and endocrine signaling pathways.
tumor microenvironment stromal cells immune cells
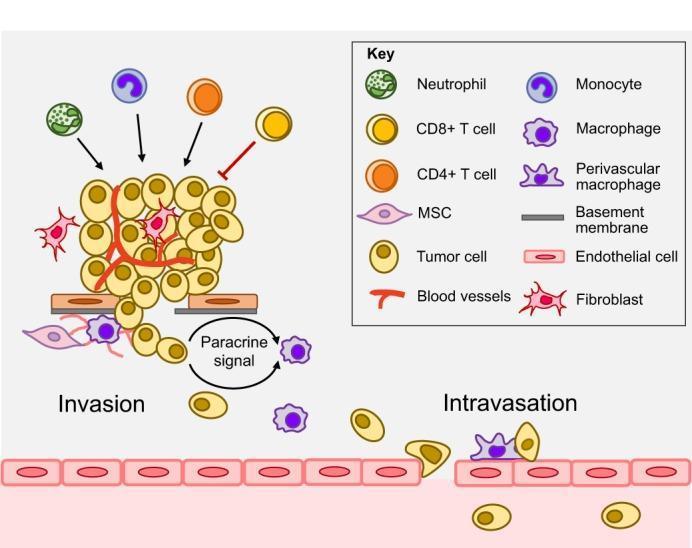
A pathophysiology diagram illustrating the metastatic cascade within the primary tumor microenvironment, specifically focusing on the stages of invasion and intravasation. The left panel, 'Invasion', shows tumor cells breaching the basement membrane and infiltrating the extracellular matrix. Key stromal interactions are depicted, including mesenchymal stem cells (MSCs) and fibroblasts remodeling the matrix, and a paracrine signaling loop between tumor cells and macrophages (TAMs). The diagram highlights the recruitment and modulation by immune cells such as neutrophils, monocytes, and CD4+ T cells, while CD8+ T cells are shown attempting to mediate anti-tumor responses. The right panel, 'Intravasation', illustrates tumor cells interacting with perivascular macrophages and endothelial cells to penetrate the vascular barrier. This process, facilitated by the 'Tumor Microenvironment for Metastasis' (TMEM) structure, allows tumor cells to enter the bloodstream. The illustration uses distinct icons and color-coding for each cell type, including endothelial cells, myeloid cells, and different T cell subsets, to explain the complex signaling and structural changes required for cancer dissemination.
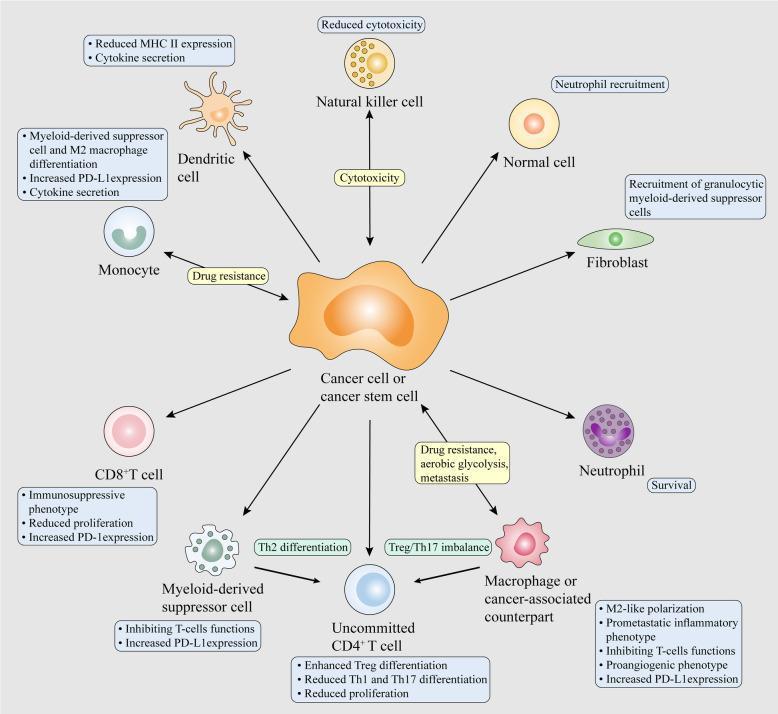
This medical illustration depicts a pathophysiology diagram of the tumor microenvironment (TME), specifically focusing on extracellular vesicle (EV)-mediated crosstalk. A central 'Cancer cell or cancer stem cell' acts as the primary hub, exerting immunosuppressive and protumoral influences on surrounding immune and stromal cells via unidirectional arrows. Key cellular interactions include: 1) Suppression of Natural Killer (NK) cells (reduced cytotoxicity) and CD8+ T cells (immunosuppressive phenotype, increased PD-1); 2) Reprogramming of myeloid lineages, including M2-like macrophage polarization, dendritic cell dysfunction (reduced MHC II), and monocyte/neutrophil drug resistance; 3) Alteration of CD4+ T cell differentiation towards a Treg phenotype, creating a Th2/Treg dominance; and 4) Modulation of stromal elements like fibroblasts (recruiting myeloid-derived suppressor cells) and normal cells. The diagram highlights critical oncogenic mechanisms such as increased PD-L1 expression, proangiogenic phenotypes, and enhanced survival signaling. This resource is designed to educate on how tumor-derived factors drive immune evasion and cancer progression within the local microenvironment.
Neoplasia: A Comprehensive Review
Based on Robbins & Cotran Pathologic Basis of Disease
7. What is Carcinogenesis? Causes: Chemical, Viral, and Radiation
- Initiation - exposure to a carcinogenic agent causes permanent, heritable DNA damage (mutation). Initiated cells are not yet tumors.
- Promotion - promoters (not themselves mutagenic) cause clonal expansion of initiated cells. Promotion is reversible in early stages.
- Progression - subclones accumulate additional mutations, eventually yielding a fully malignant, invasive cancer.
A. Chemical Carcinogenesis
- Alkylating agents: β-propiolactone, dimethyl sulfate, diepoxybutane
- Anticancer drugs: cyclophosphamide, chlorambucil, nitrosoureas
- These are weak carcinogens but important because therapeutic use can induce secondary malignancies (especially acute myeloid leukemia)
- Polycyclic aromatic hydrocarbons (PAH): benzo[a]pyrene (from cigarette smoke, soot, grilled meats) - most potent indirect carcinogens. Metabolized by CYP1A1 to reactive epoxides.
- Aromatic amines and azo dyes: 2-naphthylamine (bladder cancer in dye workers), benzidine
- Aflatoxin B1: produced by Aspergillus flavus on peanuts/grains - causes hepatocellular carcinoma, characteristically mutates codon 249 of TP53
- Nitrosamines: formed from dietary nitrites - gastric cancer
- Vinyl chloride: angiosarcoma of liver
B. Radiation Carcinogenesis
Ultraviolet (UV) Radiation
- UV-B (wavelength 280-320 nm) is the main carcinogenic component of sunlight
- Causes pyrimidine dimers (covalent cross-links between adjacent thymine/cytosine residues) in DNA
- Repaired by nucleotide excision repair (NER); deficiency in NER causes xeroderma pigmentosum with >1000-fold increased risk of skin cancer
- Causes squamous cell carcinoma, basal cell carcinoma, and melanoma
- Dose-dependent: cumulative lifetime UV exposure correlates with skin cancer risk
Ionizing Radiation
- X-rays, gamma rays, alpha/beta particles cause double-stranded DNA breaks and chromosomal rearrangements
- Historical evidence: thyroid cancer from radioiodine fallout (Chernobyl, atomic bomb survivors), leukemia in radiologists, lung cancer in uranium miners (radon exposure)
- Increased leukemia risk after diagnostic/therapeutic radiation
- Mechanism: direct ionization of DNA or indirect damage via reactive oxygen species
- Robbins & Cotran, pp. 288-289
C. Microbial (Viral) Carcinogenesis
Oncogenic RNA Viruses (Retroviruses)
- HTLV-1 (Human T-cell Leukemia Virus type 1): causes adult T-cell leukemia/lymphoma
- Encodes the Tax protein, which activates NF-κB and transcription of growth-promoting genes including IL-2 and IL-2 receptor, creating an autocrine growth loop
- Tax also inhibits TP53 function and DNA repair
Oncogenic DNA Viruses
- More than 100 HPV subtypes; HPV 16, 18 are high-risk for carcinoma
- Encodes two oncoproteins: E6 and E7
- E6 binds and promotes ubiquitin-mediated degradation of p53 (TP53)
- E7 binds and inactivates RB protein, releasing E2F transcription factors and driving S-phase entry
- E7 also binds p21 and p27, bypassing additional cell cycle checkpoints
- Causes cervical carcinoma, oropharyngeal cancer, penile/anal/vulvar cancers
- In cervical cancer, HPV DNA is integrated into host genome (unlike benign warts where it remains episomal)
- Latently infects B lymphocytes; encodes LMP-1 (latent membrane protein-1), a functional mimic of the CD40 receptor
- LMP-1 activates NF-κB and JAK/STAT pathways, driving B-cell proliferation
- Associated with: Burkitt lymphoma (Africa), diffuse large B-cell lymphoma (immunosuppressed), Hodgkin lymphoma, nasopharyngeal carcinoma
- In Burkitt lymphoma, EBV infection precedes the characteristic t(8;14) translocation (MYC to immunoglobulin locus)
- Major cause of hepatocellular carcinoma (HCC) worldwide
- HBx protein activates transcription of multiple proto-oncogenes
- Chronic infection causes cycles of liver cell destruction/regeneration, promoting accumulation of mutations
- HBV DNA integrates near and disrupts various growth-regulatory genes
- RNA virus (not integrating) - causes HCC primarily through chronic hepatitis, cirrhosis, and sustained regenerative stimulus
- HCV proteins may directly interact with p53 and Wnt/β-catenin pathways
- Associated with gastric adenocarcinoma and MALT lymphoma
- Causes chronic gastritis, stimulating B-cell proliferation via T-cell activation
- H. pylori eradication can cause regression of early MALT lymphomas, confirming the driver role of chronic antigen stimulation
- Robbins & Cotran, pp. 289-292
1. Molecular Basis of Carcinogenesis
Multistep Model - Colorectal Carcinoma as the Prototype
- Normal epithelium - APC mutation (early event, familial and sporadic)
- Hyperproliferative epithelium - Hypomethylation of DNA
- Early adenoma - KRAS mutation
- Intermediate adenoma - Loss of SMAD2/4 (18q deletion)
- Late adenoma - TP53 mutation (late event)
- Carcinoma - Additional mutations in telomerase, PI3K, etc.
Genomic Instability as an Enabling Characteristic
- MMR proteins (MSH2, MLH1, MSH6, PMS2) act as "spell checkers" during DNA replication
- Loss of MMR leads to microsatellite instability (MSI) - expansion or contraction of repetitive sequences throughout the genome
- Germline MMR mutations cause Lynch syndrome (HNPCC) - autosomal dominant, predominantly proximal colon cancers
- Sporadic MSI cancers (15% of colon cancers) usually result from epigenetic silencing of MLH1
- NER repairs UV-induced pyrimidine dimers
- Germline NER gene mutations cause xeroderma pigmentosum - extreme sensitivity to UV and high rates of skin cancer
- Repairs double-strand DNA breaks and cross-links
- Germline BRCA1/BRCA2 mutations impair HR, causing familial breast and ovarian cancer
- ATM mutations cause ataxia-telangiectasia (leukemia/lymphoma risk)
- Bloom syndrome (helicase mutation), Fanconi anemia (>12 genes) - impaired HR and cancer predisposition
Epigenetic Changes in Cancer
- Genome-wide DNA hypomethylation: activates proto-oncogenes and promotes chromosomal instability
- Promoter CpG island hypermethylation: silences tumor suppressor genes (e.g., MLH1 in sporadic MSI cancers, CDKN2A/p16 in many cancers)
- Histone modifications: H3K27 trimethylation by EZH2 silences differentiation genes
- Mutations in chromatin-remodeling enzymes: SWI/SNF complex (ARID1A, SMARCB1) mutations are common drivers in ovarian clear cell, rhabdoid tumors, and others
- Noncoding RNAs: miRNAs regulate hundreds of target mRNAs; oncomiRs (e.g., miR-21) are overexpressed and silence tumor suppressors; tumor suppressor miRNAs (e.g., let-7, miR-34) are frequently silenced in cancer
2. Hallmarks of Cancer
The Eight Hallmarks
- Tumors proliferate without external growth factor stimuli
- Mechanisms: autocrine growth factor loops (gliomas expressing PDGF + PDGFR), gain-of-function mutations in growth factor receptors (EGFR in lung cancer), constitutively active signal transducers (RAS mutations in ~30% of all cancers)
- Proto-oncogene activation is the molecular basis
- Tumor cells fail to respond to growth-inhibitory molecules (TGF-β, contact inhibition)
- Mechanisms: inactivation of RB (retinoblastoma protein), loss of TP53, inactivation of CDK inhibitors (p16/CDKN2A, p21)
- Tumor suppressor gene loss is the molecular basis
- Even in normoxic conditions, cancer cells preferentially use aerobic glycolysis (glucose → lactate) rather than oxidative phosphorylation
- This "Warburg effect" supports rapid biosynthesis of macromolecules (lipids, nucleotides, proteins) needed for cell growth
- HIF-1α (activated by hypoxia or oncogenic signaling) drives expression of glycolytic enzymes
- MYC amplification upregulates glutamine metabolism
- Oncometabolism: IDH1/2 mutations in gliomas and AML produce the oncometabolite 2-hydroxyglutarate (2-HG), which inhibits α-ketoglutarate-dependent enzymes (histone demethylases, TET DNA demethylases), causing a hypermethylation phenotype
- Autophagy: cancer cells can cannibalize their own organelles for energy during nutrient deprivation; becomes a survival mechanism in established tumors
- Tumors resist programmed cell death
- Mechanisms: BCL-2 overexpression (follicular lymphoma - t(14;18)), loss of TP53, overexpression of IAPs (inhibitor of apoptosis proteins), upregulation of survival signaling via PI3K/AKT pathway
- BCL-2 family: BCL-2, BCL-XL are anti-apoptotic; BAX, BAK are pro-apoptotic; cancer tips the balance toward survival
- Normal cells undergo senescence after ~70 doublings (Hayflick limit) due to telomere shortening
- Cancer cells acquire telomerase (TERT) expression, preventing telomere erosion and enabling immortal replication
- Cancer stem cells possess inherent self-renewal capacity
- Two mechanisms for cancer stemness: transformation of a tissue stem cell (e.g., HSC in CML) or acquisition of stemness mutation in a progenitor (e.g., granulocyte progenitor in APL)
- Tumors >1-2 mm cannot grow without a new blood supply
- The angiogenic switch: balance shifts from anti-angiogenic to pro-angiogenic factors
- Key pro-angiogenic factor: VEGF (upregulated by HIF-1α under hypoxia, and by oncogenes like RAS and MYC)
- Anti-angiogenic factors: thrombospondin-1 (upregulated by p53), angiostatin, endostatin
- Loss of p53 removes thrombospondin-1 upregulation, permitting VEGF to dominate
- Therapeutic targeting: bevacizumab (anti-VEGF) now part of oncology armamentarium
- Metastasis causes ~90% of cancer deaths
- Invasion of ECM: requires loss of E-cadherin (epithelial-mesenchymal transition/EMT), degradation of basement membrane by matrix metalloproteinases (MMPs), acquisition of motility by tumor cells
- EMT - tumor cells downregulate E-cadherin (adhesion), upregulate N-cadherin and vimentin (mesenchymal markers), acquire motility and invasive capacity
- Vascular dissemination: circulating tumor cells (CTCs) form multicellular aggregates with platelets for protection; express CD44 and chemokine receptors for tissue homing
- Seed and soil hypothesis (Paget): metastatic cells (seeds) preferentially colonize permissive tissues (soil) - e.g., prostate/breast cancer to bone, lung cancer to adrenals/brain
- Colonization involves: surviving anoikis, evading immune surveillance, adapting to new metabolic microenvironment, escaping from tumor dormancy
- Tumor immune evasion mechanisms:
- Downregulation of MHC class I on tumor cells (invisible to CTLs)
- PD-L1/PD-L2 upregulation on tumor cells - engages PD-1 on T cells, inducing T-cell anergy/exhaustion
- CTLA-4 signaling: tumor regulatory T cells (Tregs) express CTLA-4, competing with CD28 for B7 ligands and suppressing effector T cell activation
- Production of immunosuppressive cytokines: TGF-β, IL-10
- Induction of immune tolerance through FasL expression on tumor cells (killing Fas+ T cells)
- Secretion of IDO (indoleamine 2,3-dioxygenase) - depletes tryptophan needed for T-cell function
Two Enabling Characteristics
- Genomic Instability: Accelerates acquisition of driver mutations (discussed above)
- Cancer-Enabling Inflammation: Tumor-associated macrophages (TAMs) and other inflammatory cells supply growth factors, survival signals, pro-angiogenic factors, and matrix-remodeling enzymes that support tumor progression
3. Oncogenes
Mechanisms of Proto-Oncogene Activation
- RAS genes (KRAS, NRAS, HRAS): most commonly mutated oncogenes in human cancer (~30% of all tumors)
- RAS is a GTPase that transmits signals from receptor tyrosine kinases to downstream effectors (RAF-MEK-ERK and PI3K-AKT)
- Oncogenic RAS mutations (codons 12, 13, 61) impair intrinsic GTPase activity - RAS stays locked in the active GTP-bound state
- KRAS mutations are found in >90% of pancreatic cancers, ~50% of colon cancers, ~30% of lung adenocarcinomas
- Multiple copies of oncogene DNA sequences appear as:
- Double minutes (small extrachromosomal circular DNA pieces)
- Homogeneous staining regions (HSRs) - inserted amplified DNA creating bands lacking normal light/dark banding pattern
- NMYC: amplified in 25-30% of neuroblastomas; associated with poor prognosis
- ERBB2 (HER2): amplified in ~20% of breast cancers; target of trastuzumab (Herceptin)
- EGFR: amplified in glioblastoma and some NSCLC
- CCND1 (Cyclin D1): amplified in mantle cell lymphoma (also via translocation)
- t(9;22) - Philadelphia chromosome: BCR::ABL1 fusion in CML (and ALL)
- Creates a constitutively active tyrosine kinase; BCR-ABL activates RAS, PI3K, and JAK/STAT
- Targeted by imatinib (first targeted tyrosine kinase inhibitor)
- t(8;14): MYC translocation to IgH locus in Burkitt lymphoma - massive MYC overexpression
- t(15;17): PML::RARα fusion in acute promyelocytic leukemia (APL)
- PML-RARα acts as a dominant-negative transcription repressor blocking myeloid differentiation
- ATRA (all-trans retinoic acid) binds PML-RARα, relieving repression and enabling differentiation - the first successful differentiation therapy
- EML4::ALK fusion (inv(2p)) in ~5% of lung adenocarcinomas - constitutively active ALK kinase; targeted by crizotinib
- Small deletions can activate oncogenes by juxtaposing them with active promoters
- TAL1 overexpression in T-ALL via promoter juxtaposition (chromosome 1 deletion)
Categories of Oncoproteins (Table 7.5 in Robbins)
| Category | Examples | Cancer Association |
|---|---|---|
| Growth Factors | PDGF-β, FGF3 | Astrocytoma, Stomach/Bladder cancer |
| Growth Factor Receptors (RTKs) | EGFR/ERBB1, ERBB2 (HER2), RET, KIT | NSCLC, Breast, Thyroid, GIST |
| Non-receptor Tyrosine Kinases | ABL1 (BCR-ABL), JAK2 | CML, ALL, MPN |
| RAS/MAPK Pathway | KRAS, NRAS, HRAS, RAF (BRAF) | Pancreas, Colon, Lung, Melanoma |
| PI3K/AKT/mTOR Pathway | PIK3CA, AKT1, PTEN loss | Breast, Endometrial, many others |
| Transcription Factors | MYC, NMYC, LMYC | Burkitt lymphoma, Neuroblastoma, SCLC |
| Cell Cycle Regulators | Cyclin D1 (CCND1), CDK4/6 | Breast, Mantle cell lymphoma, many |
| Anti-apoptotic | BCL-2 | Follicular lymphoma |
MYC - A Master Transcription Factor Oncogene
- MYC (c-Myc) is a transcription factor that forms heterodimers with MAX to activate transcription of hundreds of target genes
- When overexpressed, MYC drives cell proliferation (upregulates cyclins, CDKs), metabolism (upregulates glutamine transporter, glycolytic enzymes), and angiogenesis (VEGF)
- MYC also causes genomic instability and sensitizes cells to apoptosis - hence its combination with BCL-2 overexpression in many lymphomas
Cyclins and CDKs as Oncoproteins
- CDK4/Cyclin D1 complex phosphorylates RB, releasing E2F and allowing S-phase entry
- CDK inhibitors (INK4 family: p16, p15; CIP/KIP family: p21, p27) brake this process
- CCND1 amplification/overexpression constitutively activates CDK4/6 and keeps RB phosphorylated (inactive) permanently
- CDK4/6 inhibitors (palbociclib, ribociclib) exploit this in breast cancer treatment
4. Tumor Suppressor Genes
RB: Governor of Proliferation
- RB protein (pRb) is a "master brake" on the cell cycle
- In its hypophosphorylated (active) state, pRb binds and inhibits E2F transcription factors, blocking transcription of genes needed for S-phase entry
- Growth factors activate Cyclin D/CDK4/6 complexes → phosphorylate RB → RB releases E2F → cell enters S phase
- Germline RB mutation (one allele) + somatic loss of second allele = retinoblastoma (Knudson's two-hit)
- Somatic mutations in both RB alleles occur in: osteosarcoma, breast, lung (SCLC), bladder carcinomas
- Functional inactivation even without RB mutation: cyclin D overexpression (keeps RB phosphorylated), loss of p16/CDKN2A (fails to inhibit CDK4/6), viral oncoproteins (HPV E7 binds and inactivates pRb)
- Familial retinoblastoma: one mutant RB inherited (first hit germline) + one somatic mutation (second hit) → nearly all children develop bilateral, multifocal tumors
- Sporadic retinoblastoma: both hits must be somatic → unilateral, unifocal, later onset
TP53: Guardian of the Genome
- p53 is a transcription factor activated by cellular stresses (DNA damage, hypoxia, oncogene activation)
- In unstressed cells, p53 levels are kept low by MDM2, an E3 ubiquitin ligase that promotes proteasomal degradation of p53
- DNA-damage-induced kinases (ATM, ATR, Chk1/Chk2) phosphorylate p53 at Ser15/Ser20, preventing MDM2 binding → p53 accumulates
-
Transient cell cycle arrest (G1 arrest):
- p53 transcribes CDKN1A (p21) → p21 inhibits CDK4/D cyclin complexes → RB stays active → G1 block
- Allows time for DNA repair (p53 also induces GADD45 repair genes)
- If repair successful: MDM2 re-accumulates, p53 falls, cell cycle resumes
-
Senescence (permanent arrest):
- Epigenetic changes form heterochromatin at cell cycle gene loci
- Irreversible, stress-dependent
-
Apoptosis:
- p53 transcribes pro-apoptotic genes: BAX (promotes cytochrome c release), PUMA, NOXA
- Triggered when DNA damage is too severe for repair
- Li-Fraumeni syndrome: germline TP53 mutation → multiple cancers (sarcomas, leukemia, brain tumors, breast cancer) at young age
- Somatic mutations: missense mutations in the DNA-binding domain (codons 175, 248, 249, 273 are hotspots)
- Aflatoxin B1 signature: G→T transversion at codon 249
- Viral inactivation: HPV-E6 targets p53 for degradation; HBx may inhibit p53 transcriptional activity
- MDM2 amplification: amplified in ~7% of cancers (especially well-differentiated liposarcoma), keeping p53 degraded even when intact
Other Key Tumor Suppressor Genes
- Normally degrades β-catenin (the effector of Wnt signaling)
- When APC is mutated, β-catenin accumulates, translocates to nucleus, and activates MYC, Cyclin D1, and other proliferative genes
- Germline APC mutations cause familial adenomatous polyposis (FAP); somatic APC mutation is the earliest event in 80% of sporadic colorectal cancers
- VHL protein normally targets HIF-1α for ubiquitin-mediated degradation under normoxic conditions
- Loss of VHL → HIF-1α accumulates even under normoxia → constitutive activation of VEGF, PDGF, EPO, and other HIF target genes
- Causes clear cell renal cell carcinoma (germline: VHL disease; somatic: ~80% of sporadic ccRCC)
- Required for homologous recombination repair of double-strand DNA breaks
- Germline mutations: familial breast (~25% of familial cases), ovarian cancers
- BRCA-deficient cancers are particularly sensitive to PARP inhibitors (synthetic lethality - exploiting a DNA repair vulnerability)
- Phosphatase that dephosphorylates PIP3, opposing PI3K and negatively regulating AKT survival signaling
- Most commonly lost tumor suppressor after TP53; mutations in endometrial, prostate, glioblastoma, breast cancers
- Germline mutations: Cowden syndrome (hamartomas, breast/thyroid cancer risk)
- Encodes both p16 (inhibits CDK4/6) and p14ARF (inhibits MDM2, stabilizing p53)
- Deleted or silenced (promoter methylation) in a wide variety of cancers including melanoma, pancreatic cancer, NSCLC
- Mediators of TGF-β growth-inhibitory signaling
- Loss of SMAD4 in pancreatic and colorectal cancers deprives cells of TGF-β's growth-suppressive effects
5. Tumor Microenvironment (TME)
Key Cellular Components of the TME
- Most abundant stromal cells in many carcinomas (breast, pancreas, colon)
- Activated by TGF-β, PDGF from tumor cells
- Secrete ECM components (collagen, fibronectin), growth factors (HGF, IGF-1, FGF), and MMPs
- Create a desmoplastic stroma (e.g., in pancreatic cancer) that acts as a barrier to drug delivery
- Support tumor angiogenesis, invasion, and metastasis
- The most abundant immune cells in the TME of most solid tumors
- Polarized toward an M2-like (alternatively activated) phenotype by IL-4, IL-13, IL-10, and TGF-β from tumor cells
- M2 TAMs promote:
- Tumor growth (secrete EGF, HGF, VEGF)
- Immune evasion (produce IL-10, TGF-β; suppress CTL activity)
- Angiogenesis (secrete VEGF, bFGF, CXCL8)
- Matrix remodeling and invasion (secrete MMPs, cathepsins)
- Phagocytosis of apoptotic tumor cells, clearing debris and limiting immunogenic cell death
- High TAM density correlates with poor prognosis in most cancers
- CD8+ CTLs: the principal anti-tumor immune effectors; can kill tumor cells presenting neoantigens on MHC class I. High TIL density correlates with better prognosis in melanoma, breast, colon (especially MSI-H) cancers.
- CD4+ helper T cells (Th1): produce IFN-γ, supporting CTL activity
- Regulatory T cells (Tregs): immunosuppressive; express FOXP3; suppress CTL and NK activity via IL-10, TGF-β, and CTLA-4/IL-2 consumption
- NK cells: innate immune effectors that kill tumor cells lacking MHC class I (KIR-mediated surveillance); suppressed by TGF-β and PD-L1 in the TME
- Immature myeloid cells (granulocytic and monocytic subtypes) that accumulate in blood and tumors
- Potently immunosuppressive via: arginase-1 (depletes arginine needed for T-cell activation), ROS production, TGF-β, IL-10
- Recruited by tumor-derived factors: VEGF, GM-CSF, M-CSF, CXCL5
- Tumor vessels are structurally abnormal: leaky, dilated, tortuous, poorly connected
- High interstitial pressure within the tumor impairs drug delivery
- Lymphangiogenesis (driven by VEGF-C, VEGF-D) facilitates lymphatic metastasis
- The ECM is extensively remodeled by cancer and stromal cells
- MMPs degrade basement membrane and ECM, releasing pro-angiogenic factors stored in the matrix (bFGF) and enabling tumor cell invasion
- Stiff, crosslinked collagen promotes mechanosignaling through integrins, activating oncogenic pathways (PI3K, FAK, YAP/TAZ)
Cancer-Enabling Inflammation
- Inflammatory cells produce reactive oxygen species (ROS) and reactive nitrogen species (RNS) that damage DNA
- Cytokines (TNF-α, IL-6) activate NF-κB in tumor cells, promoting survival, proliferation, and EMT
- Prostaglandins (via COX-2) promote tumor cell survival and angiogenesis
- Examples: H. pylori infection → gastric cancer; IBD → colorectal cancer; chronic hepatitis → HCC; asbestosis → mesothelioma
Immune Checkpoint Mechanisms in TME
- PD-1/PD-L1 axis: Tumor cells and MDSCs upregulate PD-L1, which engages PD-1 on CD8+ T cells, inducing T-cell exhaustion. This is the basis for checkpoint inhibitors (pembrolizumab, nivolumab).
- CTLA-4: Tregs and exhausted T cells express high levels of CTLA-4, competing with CD28 for CD80/CD86 costimulatory ligands. Ipilimumab targets CTLA-4.
- LAG-3, TIM-3, TIGIT: Additional co-inhibitory receptors that mediate T-cell exhaustion in the TME; emerging immunotherapy targets.
6. Laboratory Diagnosis of Cancer of Unknown Primary (CUP), Including IHC
Step 1: Morphological Assessment (H&E)
| Category | Characteristics | % of CUP |
|---|---|---|
| Adenocarcinoma | Gland formation, mucin production | ~60% |
| Squamous cell carcinoma | Keratin pearls, intercellular bridges | ~5% |
| Undifferentiated / Poorly differentiated carcinoma | No defining features on H&E | ~30% |
Step 2: Immunohistochemistry (IHC) - The Cornerstone of CUP Workup
| Marker | Positive | Significance |
|---|---|---|
| Pan-Cytokeratin (AE1/AE3, MNF116) | Epithelial tumors (carcinomas) | Confirms carcinoma vs. sarcoma/lymphoma |
| Vimentin | Mesenchymal/sarcoma, some carcinomas (RCC, endometrial) | Sarcoma marker |
| LCA (CD45) | Lymphoma/leukemia | Excludes carcinoma |
| S100 + Melan-A + HMB-45 | Melanoma | Diagnoses melanoma in undifferentiated tumors |
| Desmin, SMA, Myogenin | Myogenic tumors (rhabdomyosarcoma, leiomyosarcoma) | Sarcoma sub-typing |
| Primary Site | Key Markers |
|---|---|
| Breast | ER (estrogen receptor), PR (progesterone receptor), HER2, GATA-3, mammaglobin |
| Prostate | PSA (prostate-specific antigen), PSAP, NKX3.1, AMACR |
| Lung (adenocarcinoma) | TTF-1 (thyroid transcription factor-1), Napsin-A, CK7+/CK20- |
| Lung (squamous) | p40, p63, CK5/6, SOX2 |
| Colorectal | CDX2, CK20+/CK7-, SATB2 |
| Thyroid | TTF-1, thyroglobulin, PAX8 (follicular), calcitonin (medullary) |
| Renal cell | PAX8, PAX2, RCC, CAIX (clear cell), CD10 |
| Hepatocellular carcinoma | HepPar-1, arginase-1, glypican-3, AFP |
| Cholangiocarcinoma | CK7+, CK20-, CA19-9, pCEA (canalicular) |
| Ovary/Müllerian | PAX8, WT1, CA-125, ER |
| Bladder | GATA-3, uroplakin III, p63, CK5/6 |
| Neuroendocrine | Chromogranin A, synaptophysin, CD56, INSM1 |
| Mesothelioma | Calretinin, WT1, D2-40, CK5/6; negative CEA, MOC-31 |
| Germ cell tumor | SALL4, OCT4, NANOG, CD117 (seminoma), AFP (yolk sac), β-hCG (choriocarcinoma) |
- CK7+/CK20-: Lung, breast, ovary, endometrium, bladder, cholangiocarcinoma
- CK7-/CK20+: Colorectal carcinoma (classic pattern), Merkel cell carcinoma
- CK7+/CK20+: Urothelial, gastric, mucinous ovarian, cholangiocarcinoma
- CK7-/CK20-: Hepatocellular carcinoma, squamous cell carcinomas, renal cell carcinoma, prostate, adrenocortical
Step 3: Molecular and Ancillary Tests
- FISH for HER2 amplification in breast CUP with HER2 IHC 2+ (equivocal)
- EBER in-situ hybridization for EBV in undifferentiated nasopharyngeal carcinoma
- RET, ALK, ROS1 FISH in lung adenocarcinoma
- Multi-gene panels (e.g., Foundation One, MSK-IMPACT) can identify driver mutations that suggest tissue of origin:
- KRAS G12C: lung adenocarcinoma
- IDH1/2 R132: glioma or cholangiocarcinoma
- BRAF V600E: melanoma, thyroid, colon
- AR amplification: prostate
- Also identifies actionable alterations (MSI-H, TMB-H, NTRK fusions, BRCA mutations) enabling site-agnostic therapy (pembrolizumab for MSI-H, larotrectinib for NTRK)
- CancerSEEK, Tissue of Origin Test, CancerTYPE ID
- Analyze expression of hundreds of genes to compute probabilistic tissue-of-origin scores
- Sensitivity ~85% for correctly identifying primary site
- PSA (prostate), AFP (HCC/germ cell), β-hCG (germ cell/gestational trophoblastic), CA-125 (ovary), CA19-9 (pancreas/biliary), CEA (colorectal/lung), calcitonin (medullary thyroid)
- Identifies ultrastructural features: desmosomes (squamous), neurosecretory granules (neuroendocrine), melanosomes (melanoma), premelanosomes
Practical CUP Algorithm
Biopsy → H&E morphology
     ↓
Carcinoma? → Pan-CK, CD45, S100/HMB45, vimentin
     ↓
Adenocarcinoma → CK7/CK20 matrix → site-specific IHC panel
     ↓
Squamous → p40/p63 confirm → CK5/6 → site (lung, cervix, head/neck, skin)
     ↓
Neuroendocrine → Chromogranin, synaptophysin, Ki-67 (grade)
     ↓
Undifferentiated → SALL4/OCT4 (germ cell), CD45 (lymphoma), HMB45 (melanoma)
     ↓
Still uncertain → NGS/CGP + gene expression profiling
8. Molecular Techniques Used in the Pathology Laboratory
1. Fluorescence In Situ Hybridization (FISH)
- Principle: Fluorescently labeled DNA probes hybridize to complementary sequences in fixed tissue sections or cell preparations on glass slides
- Applications in pathology:
- Gene amplification: HER2 amplification in breast cancer (determining HER2 status for trastuzumab eligibility)
- Chromosomal translocations: BCR-ABL (CML), EML4-ALK (lung), SYT-SSX (synovial sarcoma), EWSR1 rearrangements (Ewing sarcoma, myxoid liposarcoma)
- Chromosomal deletions: 13q (RB deletion), 17p (TP53 deletion in CLL), 1p/19q codeletion (oligodendroglioma)
- Chromosomal gains/aneusomy: chromosome 3 in uveal melanoma
- Break-apart probes (detect gene rearrangement) vs. dual-fusion probes (detect specific fusion) vs. enumeration probes (copy number)
2. Polymerase Chain Reaction (PCR) and Variants
- Conventional PCR: amplifies specific DNA sequences; used to detect gene mutations, microbial DNA, viral integration (HPV, EBV, HBV)
- RT-PCR (Reverse Transcriptase PCR): detects gene expression by amplifying mRNA (converted to cDNA); used to detect fusion transcripts (BCR-ABL, ETV6-RUNX1 in ALL)
- Real-Time Quantitative PCR (qPCR): quantifies gene expression levels or copy numbers; used for minimal residual disease (MRD) monitoring in leukemia (BCR-ABL1 quantitation), HER2 copy number, CMV viral load
- Allele-Specific PCR / ARMS (Amplification Refractory Mutation System): detects specific point mutations (KRAS, BRAF, EGFR); high sensitivity for detecting mutations in heterogeneous tumor samples
- Digital PCR: counts individual DNA molecules; highest sensitivity for low-frequency variants; used for liquid biopsy (circulating tumor DNA)
3. Next-Generation Sequencing (NGS)
- Principle: massively parallel sequencing of millions of DNA fragments simultaneously; generates gigabytes of sequence data per run
- Types:
- Targeted gene panels (e.g., 50-500 gene panels): sequencing hotspots and clinically relevant genes; most common in diagnostic labs
- Whole-exome sequencing (WES): all ~22,000 protein-coding genes
- Whole-genome sequencing (WGS): complete genome including non-coding regions; identifies structural variants, copy number alterations, mutational signatures
- RNA sequencing (RNA-seq): transcriptome-wide gene expression; identifies fusion transcripts (NTRK, ROS1, RET, etc.)
- Applications:
- Identifying actionable mutations: EGFR exon 19/21 (osimertinib), KRAS G12C (sotorasib), BRAF V600E (dabrafenib+trametinib), ALK/ROS1/RET fusions (targeted inhibitors)
- MSI and TMB (tumor mutational burden) testing for immunotherapy eligibility
- Tumor clonal evolution and resistance mechanisms
- Hereditary cancer gene panels (BRCA1/2, Lynch syndrome genes, PALB2, CDH1, etc.)
- Liquid biopsy: ctDNA from plasma samples
4. Chromogenic In Situ Hybridization (CISH) and Silver ISH (SISH)
- Similar to FISH but uses chromogenic (peroxidase/DAB) or silver deposition instead of fluorescence
- Can be performed on standard bright-field microscopy; signals are permanent (unlike FISH)
- Used for HER2 gene amplification (as alternative to FISH), HPV genotyping, EBV detection
5. Comparative Genomic Hybridization (CGH) and Array CGH
- Conventional CGH: compares copy number of entire tumor genome vs. normal genome
- Array CGH (aCGH): interrogates copy number at thousands of loci across the genome using microarrays
- Identifies chromosomal gains (amplifications) and losses (deletions) throughout the genome
- Used for pediatric tumors, constitutional chromosomal disorders, and comprehensive cancer profiling
6. DNA Methylation Analysis
- Bisulfite sequencing converts unmethylated cytosines to uracil; methylated cytosines resistant
- MGMT promoter methylation: silences the DNA repair gene in glioblastoma; predicts response to temozolomide chemotherapy
- MLH1 promoter methylation: indicates epigenetic silencing rather than mutation as cause of MSI
- DNA methylation profiling (Heidelberg classifier): classifies CNS tumors by methylation signature; now WHO-endorsed for CNS tumor classification
7. Gene Expression Profiling (Microarrays and RNA-seq)
- Measures expression levels of thousands of genes simultaneously
- Oncotype DX (21-gene recurrence score): predicts recurrence risk and chemotherapy benefit in ER+ HER2- early breast cancer
- PAM50/Prosigna: classifies breast cancer into intrinsic subtypes (Luminal A, Luminal B, HER2-enriched, Basal-like)
- Decipher (22-gene genomic classifier): prostate cancer recurrence risk after prostatectomy
- 70-gene signature (MammaPrint): breast cancer distant metastasis risk
8. Immunohistochemistry (IHC) - as a Molecular Surrogate
- Though tissue-based, IHC provides molecular information:
- MMR protein IHC (MLH1, MSH2, MSH6, PMS2): screening for Lynch syndrome and MSI; loss of any protein expression triggers MSI PCR or NGS testing
- p53 IHC: diffuse strong ("aberrant") staining = gain-of-function TP53 mutation; complete absence = nonsense/frameshift TP53 mutation; wild-type = scattered weak/moderate staining
- PD-L1 IHC: companion diagnostic for immunotherapy eligibility (pembrolizumab in NSCLC, cervical, TNBC, etc.)
- ALK IHC: highly sensitive/specific for ALK rearrangement in NSCLC; confirms before targeted therapy
- BRAF V600E IHC (VE1 antibody): mutation-specific antibody for colorectal, thyroid, glioma screening
9. Flow Cytometry
- Measures multiple surface and intracellular markers simultaneously on single cells in suspension
- Applications:
- Immunophenotyping of leukemias and lymphomas: defining lineage (B, T, NK, myeloid), maturation stage, aberrant antigen expression
- Detecting clonal B-cell populations (light chain restriction - κ or λ excess)
- MRD (minimal residual disease) monitoring after leukemia treatment - sensitivity 10⁻⁴ to 10⁻⁵
- DNA ploidy and cell cycle analysis (S-phase fraction)
10. Cytogenetics (Karyotyping)
- G-banding of metaphase chromosomes from cultured tumor cells
- Identifies numerical abnormalities (monosomy, trisomy), structural rearrangements (translocations, inversions, deletions, amplifications as double minutes/HSRs)
- Essential in hematologic malignancies:
- t(9;22) in CML, t(8;14) in Burkitt, t(15;17) in APL, t(14;18) in follicular lymphoma
- Complex karyotype (≥3 abnormalities) in AML/MDS indicates poor prognosis
- Spectral karyotyping (SKY): uses multicolor FISH to visualize all 23 chromosome pairs simultaneously
11. Liquid Biopsy
- Analysis of cell-free DNA (cfDNA), circulating tumor DNA (ctDNA), circulating tumor cells (CTCs), exosomes from blood samples
- Applications: therapy monitoring, early relapse detection, resistance mutation identification (e.g., EGFR T790M in NSCLC after osimertinib), minimal residual disease, cancer screening
- Platforms: digital droplet PCR (ddPCR), ultra-deep NGS
Summary Table: Robbins Chapter 7 Key Concepts
| Topic | Key Points |
|---|---|
| Carcinogenesis | Multistep, requires multiple driver mutations; initiation (mutation) + promotion (proliferation) + progression |
| Hallmarks | 8 hallmarks + 2 enabling characteristics (Hanahan & Weinberg); each targets a specific cellular pathway |
| Oncogenes | Dominant gain-of-function; activated by point mutation, amplification, translocation; examples: RAS, MYC, BCR-ABL, HER2 |
| Tumor suppressors | Recessive loss-of-function (two-hit); examples: RB (cell cycle), TP53 (genome guardian), APC (Wnt), BRCA1/2 (DNA repair), VHL (hypoxia) |
| TME | CAFs, TAMs (M2-like), Tregs, MDSCs create immunosuppressive, pro-tumor niche; PD-1/PD-L1, CTLA-4 are checkpoint targets |
| CUP diagnosis | H&E → IHC (CK7/CK20 matrix + site-specific markers) → NGS → gene expression classifiers |
| Molecular techniques | FISH, PCR/qPCR, NGS, CGH, methylation analysis, flow cytometry, cytogenetics, liquid biopsy |
Reference: Robbins & Cotran Pathologic Basis of Disease, 10th Edition (Kumar, Abbas, Aster). Chapter 7: Neoplasia, pp. 250-330. ISBN: 9780443264528.