
T inversion in v1 to v3
T wave inversion V1 V2 V3 ECG leads
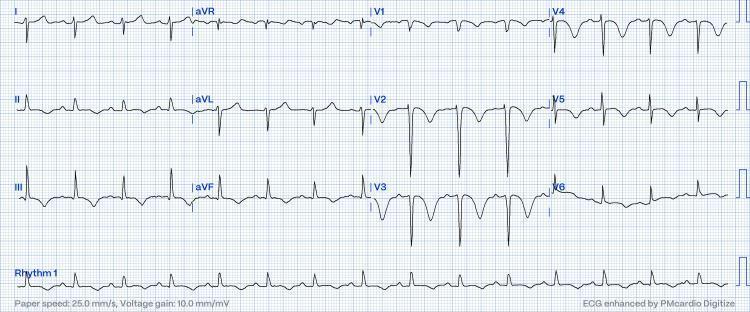
This diagnostic image is a 12-lead electrocardiogram (ECG) demonstrating several clinically significant abnormalities. Key findings include deep, symmetrical, and biphasic T-wave inversions primarily across the precordial leads V2 to V5, with the most pronounced inversion occurring in V3. Similar, though less severe, T-wave inversions are also noted in the inferior limb leads (II, III, and aVF). The tracing exhibits poor R-wave progression across the precordial leads, characterized by the failure of the R-wave amplitude to increase appropriately from V1 through V6. Additionally, there is evidence of right axis deviation. These visual features are often associated with right ventricular strain, as seen in clinical contexts such as acute pulmonary embolism or the Zurkurnai ECG pattern. The ECG is recorded at a standard paper speed of 25.0 mm/s and a voltage gain of 10.0 mm/mV, showing a sinus rhythm. This educational resource illustrates key ECG markers used in the identification of pulmonary hypertension and acute right heart strain.
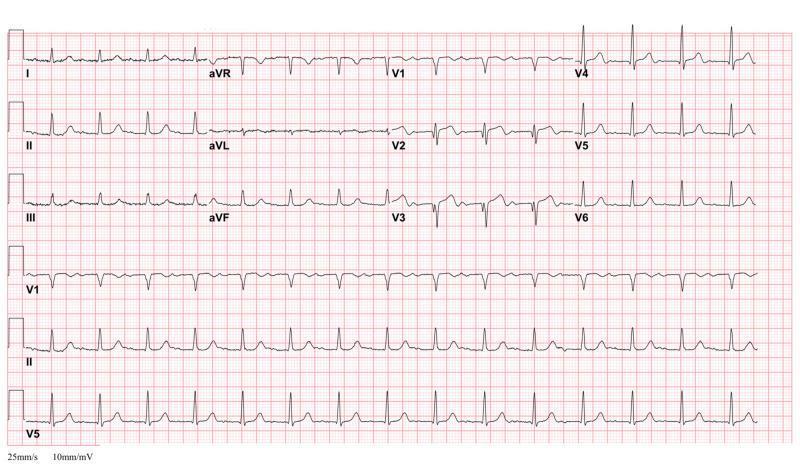
A 12-lead electrocardiogram (ECG) demonstrating the classic 'Type A' Wellens' Syndrome pattern. The recording shows a regular rhythm with normal QRS complexes; however, there is a pathognomonic T-wave morphology in the precordial leads, specifically V2 and V3. These leads exhibit biphasic T-waves characterized by an initial shallow positive deflection followed by a deep, terminal negative deflection. The terminal inversion is more prominent in amplitude than the initial upward phase. Such findings in the context of clinical stability are highly specific for critical stenosis of the proximal left anterior descending (LAD) coronary artery. The ECG also includes standard limb leads (I, II, III), augmented limb leads (aVR, aVL, aVF), and the full precordial series (V1-V6), with rhythm strips for V1, II, and V5 at the bottom. The paper speed is noted at 25mm/s with a sensitivity of 10mm/mV, providing a standard diagnostic reference for ischemic heart disease and acute coronary syndrome (ACS) evaluation.
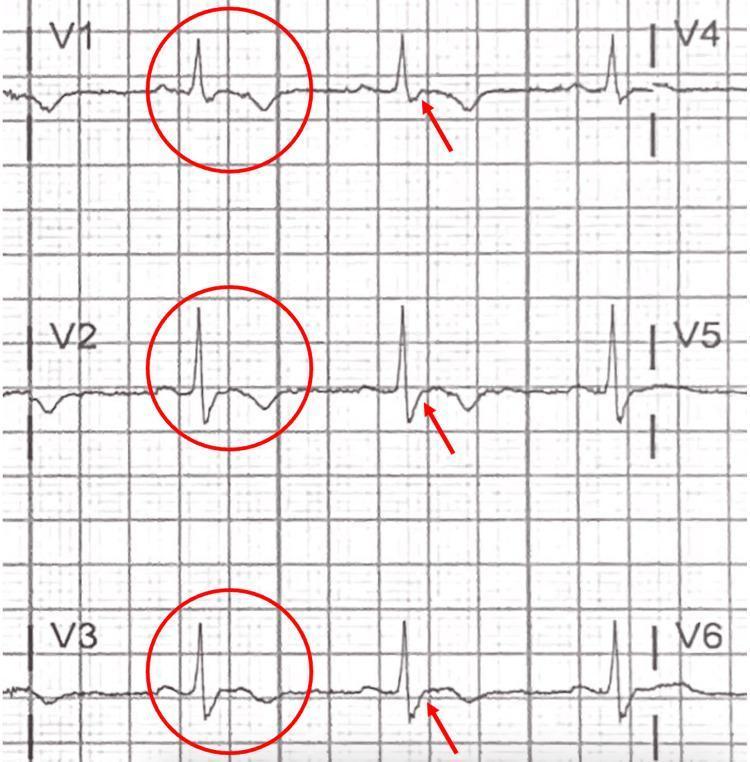
This diagnostic image displays a focused 12-lead electrocardiogram (ECG) tracing specifically highlighting the precordial leads V1 through V6. The visual focuses on the right precordial leads (V1, V2, and V3), which are marked with red circles and arrows to indicate diagnostic abnormalities. Key morphological features include prominent T-wave inversions in leads V1-V3, while the lateral leads V4-V6 show upright T-waves. A critical finding is the presence of an 'epsilon wave,' identified as a small positive deflection or notch at the terminal end of the QRS complex, occurring between the end of the S-wave and the start of the T-wave. These electrocardiographic signs—T-wave inversion in right precordial leads beyond V1 and the presence of epsilon waves—are highly characteristic of Arrhythmogenic Right Ventricular Cardiomyopathy (ARVC). This image serves as a clinical teaching tool for identifying subtle depolarization and repolarization abnormalities associated with fibrofatty replacement of the right ventricular myocardium.
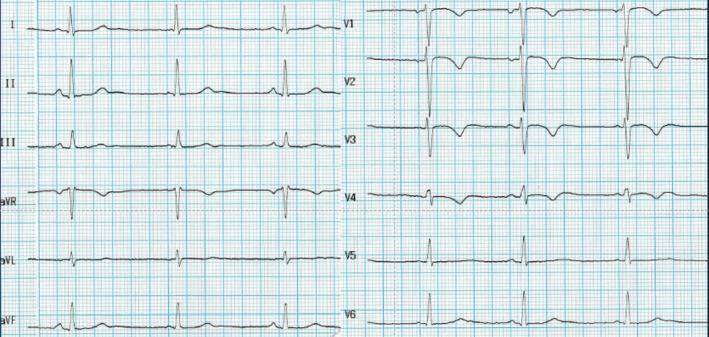
A 12-lead electrocardiogram (ECG) demonstrating a classic presentation of arrhythmogenic cardiomyopathy (AC) in a young athlete. The most significant finding is the presence of deep, symmetric T-wave inversions (TWI) in the right precordial leads, extending from V1 through V4. These inversions are most prominent in V2 and V3. The limb leads (I, II, III, aVL, and aVF) show generally upright QRS complexes and T-waves, while lead aVR shows expected global inversion. There is no evidence of complete right bundle branch block (QRS < 120 ms). The primary clinical significance of this ECG pattern is its recognition as a major diagnostic criterion for arrhythmogenic cardiomyopathy, especially when identified during pre-participation screenings for athletes. This visual serves as an educational reference for distinguishing pathologic anterior T-wave inversions from benign athletic adaptations, which typically lack this degree of precordial extension and depth.
"T wave inversion" precordial leads ECG differential diagnosis
T-Wave Inversion in V1-V3: Comprehensive Guide
Normal / Benign Causes
| Cause | Key Feature |
|---|---|
| Normal variant (V1 only) | T inversion in V1 alone is normal in all ages |
| Persistent juvenile pattern | TWI in V1-V3 that persists into adulthood; more common in women; asymptomatic |
| Post-tachycardia / post-pacemaker | TWI that normalizes over time after rate returns to normal |
- Tintinalli's Emergency Medicine, table of conditions with T-wave inversions without ischemia includes "persistent juvenile pattern," "post-tachycardia T-wave inversion," and "post-pacemaker T-wave inversion"
Most Important Pathological Causes
1. Wellens Syndrome (Critical - Do Not Miss)
- Type A (75%) - Deep, symmetric TWI in V2-V3 (sometimes V1-V4)
- Type B (25%) - Biphasic T waves: initial shallow positive deflection then deep terminal negative deflection
- ROSEN's Emergency Medicine: "Wellens syndrome is indicative of a lesion of the left anterior descending artery and the natural history of this presentation is progression to anterior wall STEMI"
2. Acute Pulmonary Embolism / Right Ventricular Strain
- Goldman-Cecil: "The ECG may show new changes suggestive of right ventricular strain, such as T wave inversion in leads V1 to V4; the classic S1, Q3, and T3 pattern; and complete or incomplete right bundle branch block"
- Fishman's Pulmonary: "The presence of an S1Q3T3 pattern, right bundle branch block, or T-wave inversion in leads V1-V3 in a patient with embolism should suggest right ventricular dysfunction, and these findings at presentation are associated with increased [mortality]"
3. ARVC / Arrhythmogenic Cardiomyopathy
- Epsilon waves (small positive deflection at terminal QRS, seen best in V1-V3)
- Prolonged terminal QRS in V1-V3 (>55 ms from S-wave nadir to end of QRS)
- History of palpitations, syncope, or ventricular tachycardia with LBBB morphology
4. Right Bundle Branch Block (RBBB)
5. Non-STEMI / ACS
- Subendocardial ischemia
- Post-STEMI reperfusion pattern (after primary PCI, TWI may follow ST elevation)
- Fuster & Hurst: "Marked symmetric T-wave inversion in multiple precordial leads" is a high-likelihood feature of ACS
6. Other Causes
| Condition | Notes |
|---|---|
| Brugada syndrome | RBBB pattern with ST elevation V1-V3; TWI may accompany |
| Hypertrophic cardiomyopathy | May have deep TWI across precordials |
| Myocarditis | Diffuse TWI; often with ST changes and elevated troponins |
| Intracranial hemorrhage / CNS events | Classically deep, wide "cerebral T waves" across precordials; associated with Stokes-Adams |
| Spontaneous pneumothorax | Axis deviation with TWI in right precordials |
| Cardiac sarcoidosis | Can mimic ARVC; PR prolongation helps differentiate |
Clinical Approach - Differential Ladder
V1-V3 TWI
│
├── V1 only → likely normal
│
├── Pain-free + biphasic/deep TWI V2-V3 + no Q waves → WELLENS (urgent cath)
│
├── Chest pain + dyspnea + S1Q3T3 + tachycardia → PE (CT-PA)
│
├── Young patient + epsilon waves + LBBB VT → ARVC (echo, cardiac MRI)
│
├── Wide QRS + slurred S in V6 → RBBB (secondary change, not ischemic)
│
├── Neuro event + deep wide T waves → Cerebral T waves (CT head)
│
└── Troponin rise + symptoms → NSTEMI / ACS (risk stratify, cath)
Key Distinguishing Features at a Glance
| Cause | Symmetry | Depth | Associated findings |
|---|---|---|---|
| Wellens A | Deep, symmetric | >2 mm | No Q waves, minimal ST change |
| Wellens B | Biphasic | Variable | No Q waves |
| PE/RV strain | Variable | Variable | S1Q3T3, tachycardia, RBBB |
| ARVC | Symmetric | Variable | Epsilon waves, LBBB VT |
| RBBB | Asymmetric (secondary) | Shallow | Wide QRS, slurred S in V6 |
| Cerebral T waves | Deep, wide | Very deep | Neurological symptoms, QT prolongation |
| Juvenile pattern | Symmetric | Shallow | Asymptomatic, young female |
Differential diagnosis for a child age 7 who developed facial edema unilateral
unilateral facial swelling child periorbital edema parotitis
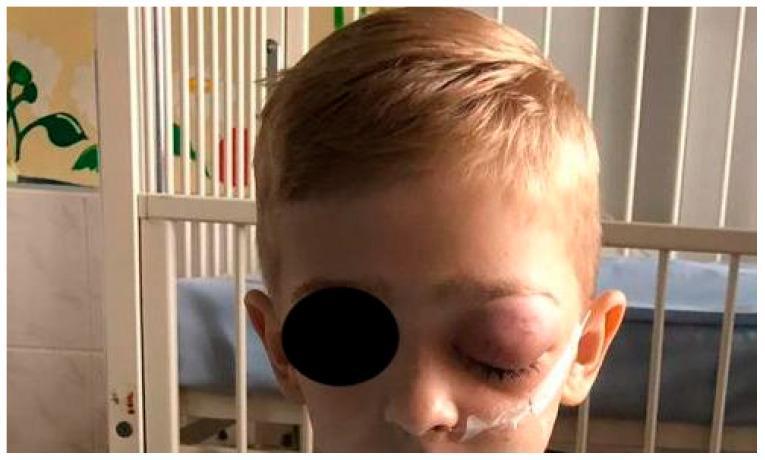
A clinical photograph of a 7-year-old pediatric patient demonstrating severe unilateral facial swelling and erythema on the left side, consistent with orbital phlegmon or orbital cellulitis. The visual highlights marked edema of the left upper and lower eyelids, resulting in significant narrowing of the palpebral fissure. The swelling extends to the periorbital and malar regions. A medical adhesive and a tube, likely a nasogastric tube or oxygen cannula, are visible at the nostril, indicating inpatient management. The background suggests a hospital setting with a clinical bed or crib. This image illustrates the external manifestations of a serious odontogenic infection that has spread to the upper face, emphasizing the need for urgent clinical evaluation to prevent complications such as vision loss or intracranial extension. The educational focus is on identifying acute periorbital inflammatory signs in children.
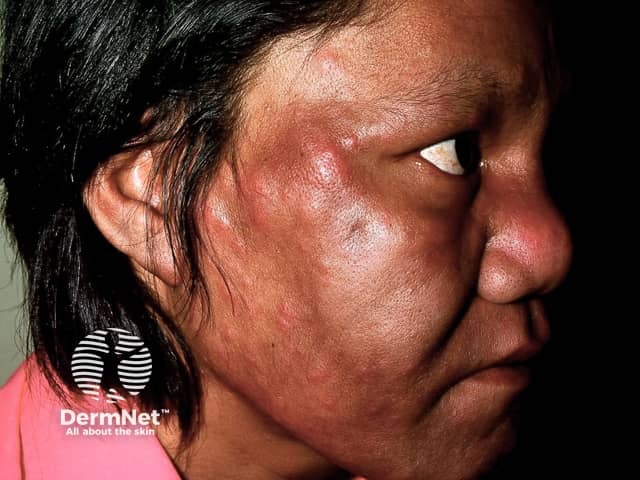
This is a high-resolution clinical photograph of the left lateral midface captured with a standard DSLR camera under color-calibrated lighting, representing dermatology/clinical photography documentation. The left cheek, perinasal region, and periorbital area are the focus, with the ear partially visible for orientation. The patient is in a profile view (sagittal plane) revealing unilateral facial swelling. The image shows acute edema of the facial subcutaneous tissues with diffuse erythema, a shiny taut skin surface, and relative smooth contour despite swelling; there is mild induration but no discrete pustules or vesicles evident. The malar region appears notably puffy, and approximation of the nasolabial fold is altered by edema. The distribution is unilateral, aligning with localized inflammatory or allergic edema, or an early infectious process. Differential diagnoses include facial cellulitis/erysipelas, angioedema, contact dermatitis, and a rosacea-related flare with edema. Diagnostic significance lies in distinguishing infectious versus non-infectious etiologies to determine management: antibiotics for cellulitis, anti-inflammatory measures for inflammatory edema, and consideration of systemic symptoms or fever. Correlate clinically with warmth, tenderness, fever, or creeping spread. This image is relevant for dermatology education, triage in telemedicine, and research on facial edema patterns. Further clinical correlation and systemic evaluation may be required for definitive diagnosis.
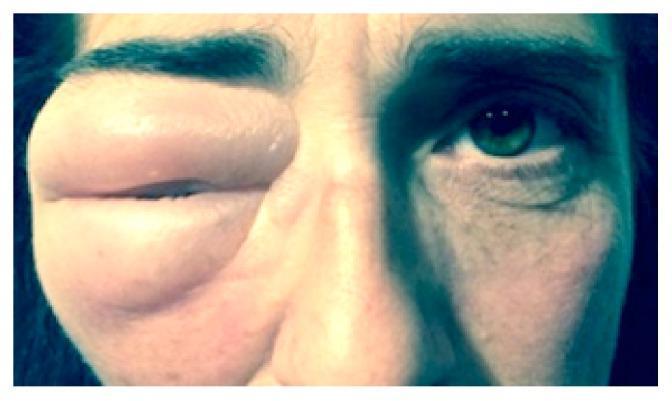
This clinical photograph displays a frontal view of a patient's face, highlighting severe unilateral edema of the right eyelid. The right periorbital region is markedly swollen, causing complete mechanical ptosis as the upper and lower eyelids meet, effectively obscuring the palpebral fissure and the globe. The skin over the edematous area appears stretched, smooth, and tense, but lacks signs of acute inflammation such as erythema or visible cutaneous lesions. In contrast, the left eye appears normal with a fully visible palpebral fissure, iris, and pupil, emphasizing the significant facial asymmetry. This visual presentation is characteristic of localized fluid accumulation or herniation in the orbital area, often requiring diagnostic imaging to differentiate between inflammatory processes, trauma-related cerebrospinal fluid (CSF) leaks, or orbital tumors. This image serves as an educational example for ophthalmological and emergency medicine assessment of periorbital swelling.
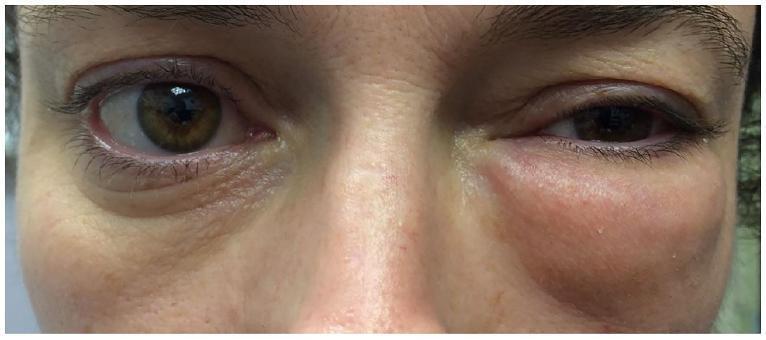
Clinical photograph of a patient's mid-face showing significant, asymmetrical left periorbital swelling. The left orbital region exhibits diffuse edema extending from the upper eyelid to the malar area, causing mechanical ptosis and narrowing of the palpebral fissure. The skin over the swollen area appears mildly erythematous and tense, distorting the natural facial contours. In contrast, the right eye and periorbital tissues appear normal with preserved lid margins and orbital architecture. This visual finding is characteristic of conditions leading to sudden volume increase in the subcutaneous periorbital space, such as orbital emphysema (often following trauma or nose blowing in the setting of an orbital floor fracture) or inflammatory processes. The presentation highlights the clinical signs of unilateral periorbital edema and its impact on ocular adnexa.
Differential Diagnosis: Unilateral Facial Edema in a 7-Year-Old Child
Urgent / Do-Not-Miss Causes
1. Orbital Cellulitis (Postseptal)
- Proptosis (globe displacement)
- Pain on eye movement
- Limited extraocular movements (ophthalmoplegia)
- Decreased visual acuity
- Fever + toxic appearance
- Tintinalli's Emergency Medicine: "A CT scan of the orbits can differentiate between periorbital cellulitis and the often more severe but less common orbital cellulitis"
2. Preseptal (Periorbital) Cellulitis
- Extension from sinusitis (S. pneumoniae, H. influenzae, Moraxella catarrhalis)
- Local spread from conjunctivitis, dacryocystitis, insect bite, or minor trauma
- Hematogenous spread from nasopharyngeal pathogens
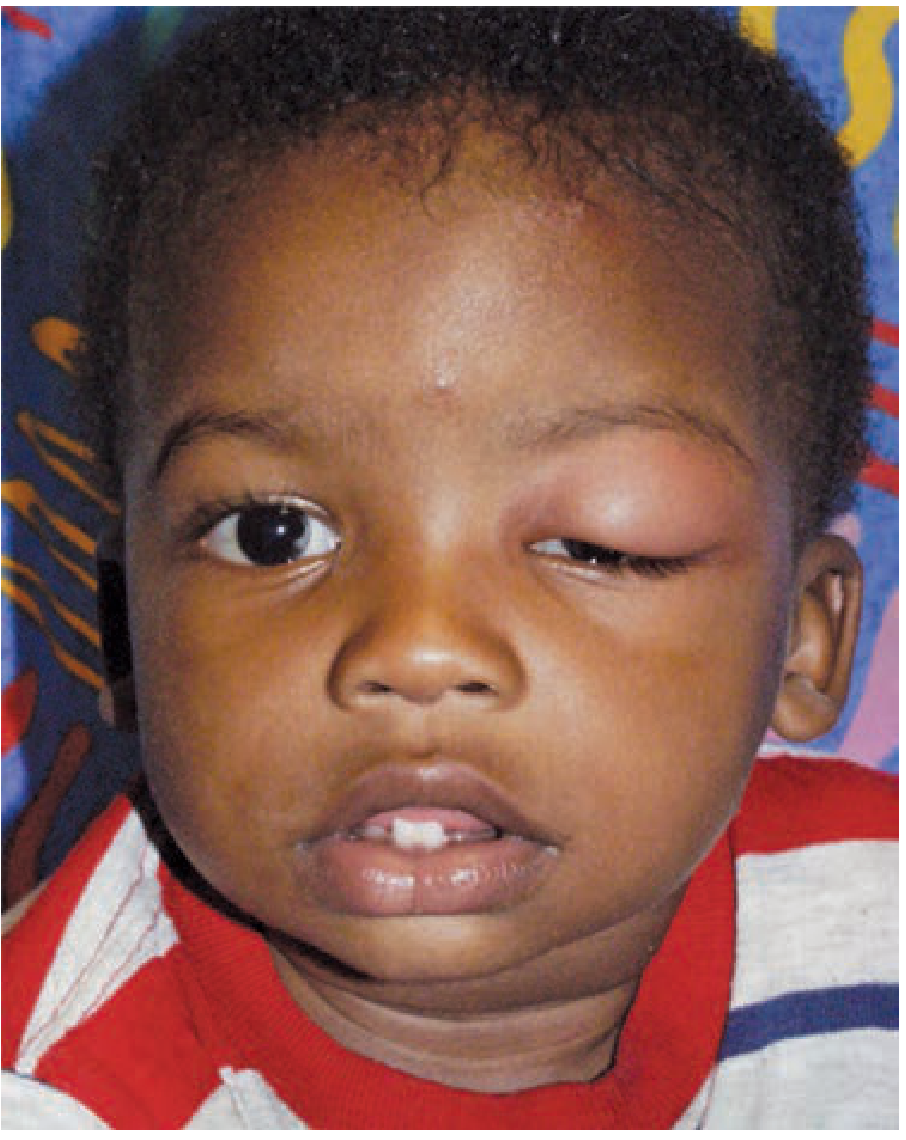
3. Ludwig's Angina / Deep Space Neck Infection
- Tintinalli's: "Control the airway early, because intubation can be extremely difficult late in the clinical course"
Infectious Causes
4. Dental Abscess / Odontogenic Infection
5. Parotitis - Mumps
- Features: Pre/postauricular swelling, earache, trismus, fever, malaise
- Look for: Vaccination history (MMR), contact history, Stensen's duct orifice redness
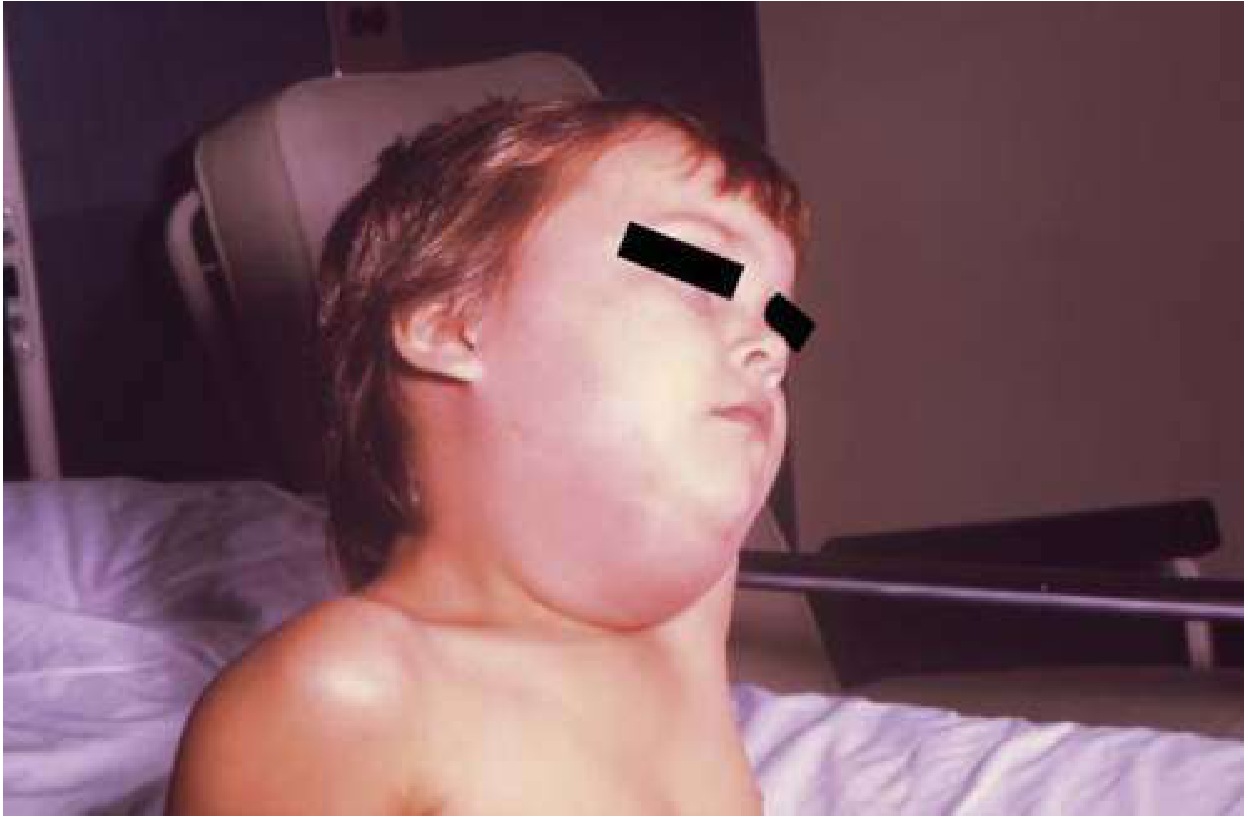
- Goldman-Cecil: Mumps is demonstrated by submandibular swelling with parotitis in a child
6. Suppurative Parotitis / Bacterial Sialadenitis
7. Erysipelas / Facial Cellulitis
8. Romaña Sign - Acute Chagas Disease (endemic areas)
- Painless, soft, pitting unilateral periorbital edema
- Associated with preauricular lymphadenopathy (Parinaud oculoglandular syndrome)
- May have fever, malaise, hepatosplenomegaly, and eosinophilia
- Relevant in Latin American countries or travel history
Allergic / Inflammatory Causes
9. Insect Bite / Contact Dermatitis (Angioedema-like reaction)
10. Hereditary Angioedema (HAE) / Allergic Angioedema
- Tietz Textbook: "Attacks can also occur in the face, hands, feet, or urogenital tract. Attacks of the hands or feet are generally unilateral"
11. Dacryocystitis (Lacrimal Sac Infection)
Neoplastic / Structural Causes
12. Rhabdomyosarcoma
-
Unilateral proptosis or periorbital swelling that is painless and progressive
-
No fever, no signs of infection
-
Does not respond to antibiotics
-
Unilateral nasal obstruction, facial swelling with epistaxis
-
Scott-Brown's Otolaryngology: Rhabdomyosarcoma listed as a "red flag" cause of unilateral facial swelling with nasal symptoms in a younger child
13. Lymphoma / Lymphadenopathy
14. Parotid Tumor (rare at this age)
Other Causes
| Cause | Key Feature |
|---|---|
| Trauma / hematoma | History of injury, bruising, no fever |
| Masticator space abscess | Pericoronitis or dental source, trismus |
| Sinusitis with reactive edema | Periorbital puffiness worse in AM, clears through the day |
| Dermoid cyst (infected) | Pre-existing midline or periorbital lump that becomes inflamed |
| TRAPS (TNF receptor-associated periodic syndrome) | Recurrent periorbital edema with febrile episodes |
Diagnostic Approach Summary
Unilateral facial edema in a 7-year-old
│
├── PERIORBITAL?
│   ├── Fever + proptosis + limited EOM → Orbital cellulitis (CT orbits urgently)
│   ├── Fever + no proptosis + normal EOM → Preseptal cellulitis (IV/PO abx)
│   ├── Painless + afebrile + sudden onset → Insect bite / allergic
│   ├── Painless + progressive + no fever → Consider rhabdomyosarcoma
│   └── Painless + travel to Latin America → Romaña sign (Chagas)
│
├── CHEEK / ANGLE OF JAW?
│   ├── Dental pain + caries → Dental abscess / odontogenic
│   ├── Parotid region + MMR unvaccinated → Mumps parotitis
│   ├── Parotid + pus from Stensen's duct → Suppurative parotitis
│   └── Sharply demarcated erythema → Erysipelas
│
└── SUBMANDIBULAR / FLOOR OF MOUTH?
    └── Rapidly spreading + fever + trismus → Ludwig's angina (AIRWAY)
Key Investigations
- Blood: CBC with differential (leukocytosis - infection; eosinophilia - parasitic/allergic), CRP/ESR, blood cultures if febrile
- Imaging: CT orbits + sinuses with contrast (if periorbital, to differentiate pre vs. postseptal)
- Dental X-ray: If odontogenic source suspected
- Throat swab / Monospot: If lymphadenopathy prominent
- Serology: Bartonella, EBV, T. cruzi (if travel history)
- Complement studies (C3, C4, C1-INH): If recurrent non-inflammatory edema (HAE)
- Biopsy: If mass lesion does not resolve after treatment