
signal transduction based on harsh mohan text book\
signal transduction pathways receptor tyrosine kinase RAS MAP kinase PI3K diagram
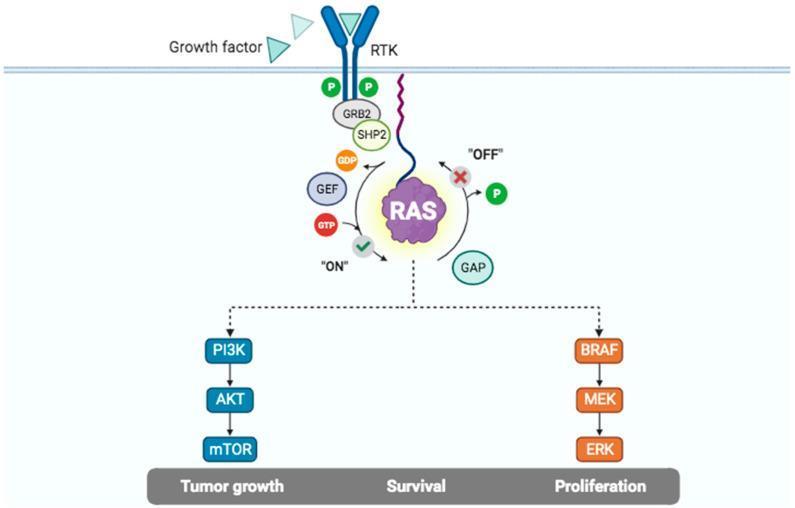
This pathophysiology diagram illustrates the Receptor Tyrosine Kinase (RTK) and RAS signaling pathway, highlighting mechanisms of intracellular signal transduction. The process initiates at the plasma membrane where 'Growth factors' bind to the extracellular domain of an RTK. This triggers intracellular autophosphorylation, represented by green 'P' markers, which recruits adapter proteins GRB2 and SHP2. The central component is the RAS molecular switch, shown cycling between an 'ON' state (GTP-bound) and an 'OFF' state (GDP-bound). Transition to the active 'ON' state is facilitated by Guanine Nucleotide Exchange Factors (GEF), while inactivation is mediated by GTPase-activating proteins (GAP). Activated RAS triggers two primary downstream effector cascades: the PI3K/AKT/mTOR pathway and the BRAF/MEK/ERK (MAPK) pathway. The diagram links these pathways to critical biological outcomes including 'Tumor growth', 'Survival', and 'Proliferation'. This educational visual is designed to explain oncogenic signaling and cellular regulation at a level suitable for medical and biomedical students.
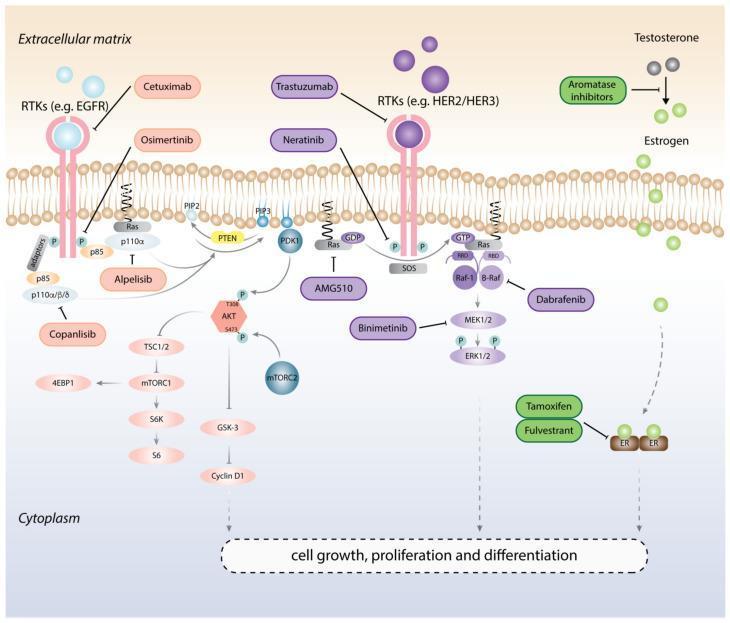
A pathophysiology diagram illustrating intracellular signaling pathways and associated targeted cancer therapies. The diagram is divided into the extracellular matrix, plasma membrane, and cytoplasm. It depicts two primary Receptor Tyrosine Kinase (RTK) pathways: the PI3K/AKT/mTOR pathway and the Ras/Raf/MEK/ERK (MAPK) pathway. Monoclonal antibodies such as Cetuximab and Trastuzumab are shown inhibiting extracellular RTK domains (EGFR, HER2/HER3), while small molecule inhibitors like Osimertinib, Neratinib, and Alpelisib target intracellular kinase domains and downstream effectors. The diagram also includes the hormonal axis, showing Aromatase inhibitors blocking the conversion of Testosterone to Estrogen, and Tamoxifen/Fulvestrant inhibiting Estrogen Receptors (ER). Activation sequences involve phosphorylation ('P'), conversion of PIP2 to PIP3, and GTPase activation of Ras. Key downstream components like TSC1/2, mTORC1, and Cyclin D1 are linked to the final biological outcomes of cell growth, proliferation, and differentiation. T-shaped lines represent pharmacological inhibition, while arrows denote activation pathways.
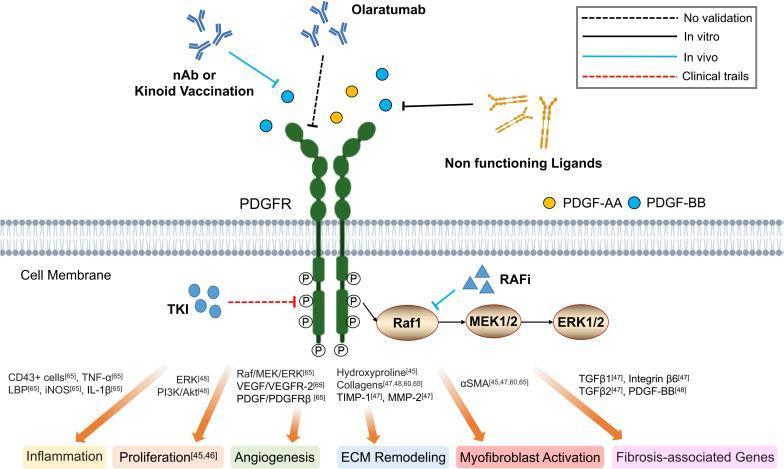
A medical pathophysiology diagram illustrating therapeutic strategies targeting the Platelet-Derived Growth Factor Receptor (PDGFR) pathway to combat tissue fibrosis. The schematic depicts a PDGFR spanning a cell membrane, showing extracellular targeting by neutralizing antibodies (nAb), Kinoid Vaccination, and Olaratumab to block ligand binding (PDGF-AA and PDGF-BB). It also shows non-functioning ligands competing for receptor access. Intracellularly, Tyrosine Kinase Inhibitors (TKIs) and Raf Inhibitors (RAFi) are shown blocking signal transduction. The diagram outlines the Raf/MEK/ERK downstream signaling cascade, which activates six key cellular processes: Inflammation (TNF-̑, IL-1̢), Proliferation (PI3K/Akt), Angiogenesis (VEGF/VEGFR-2), ECM Remodeling (Collagens, MMP-2, TIMP-1), Myofibroblast Activation (̡SMA), and induction of Fibrosis-associated Genes (TGF̢1, TGF̢2). A legend classifies these interventions by developmental stage, including in vitro, in vivo, and clinical trial levels. The diagram is designed for medical education regarding antifibrotic molecular pharmacology and signal transduction pathways.
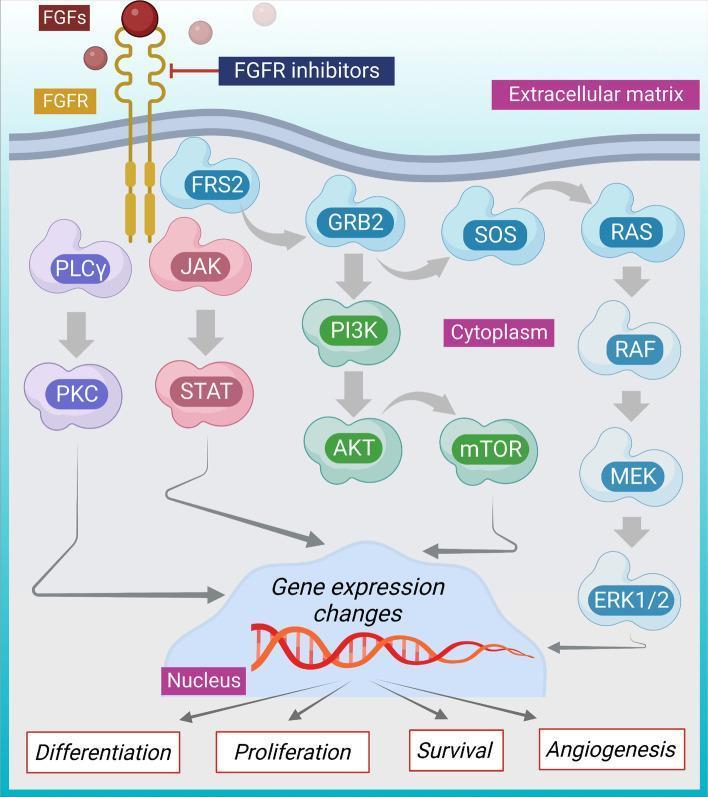
This medical illustration depicts the Fibroblast Growth Factor Receptor (FGFR) signaling pathway, a key mechanism in oncology, particularly breast cancer. The diagram is organized vertically, showing signal transduction from the extracellular matrix, through the cell membrane and cytoplasm, to the nucleus. At the top, Fibroblast Growth Factors (FGFs) bind to the transmembrane FGFR, inducing receptor dimerization. FGFR inhibitors are shown targeting this initial step. Intracellularly, the signal branches into four major cascades: 1. PLCγ leading to Protein Kinase C (PKC) activation. 2. JAK activating STAT proteins. 3. FRS2/GRB2/SOS activating the PI3K/AKT/mTOR pathway. 4. The RAS/RAF/MEK/ERK1/2 (MAPK) pathway. All four pathways converge on the nucleus to induce 'Gene expression changes,' illustrated by a DNA double helix. These genomic changes drive downstream oncogenic cellular responses including differentiation, proliferation, survival, and angiogenesis. The diagram uses arrows to indicate activation and T-bars to represent therapeutic inhibition, serving as an educational model for targeted cancer therapy.
Signal Transduction
What is Signal Transduction?
- Receptor cross-linking (ligand-induced clustering)
- Conformational change in the receptor structure
Types of Cell-Surface Receptors and Their Signaling
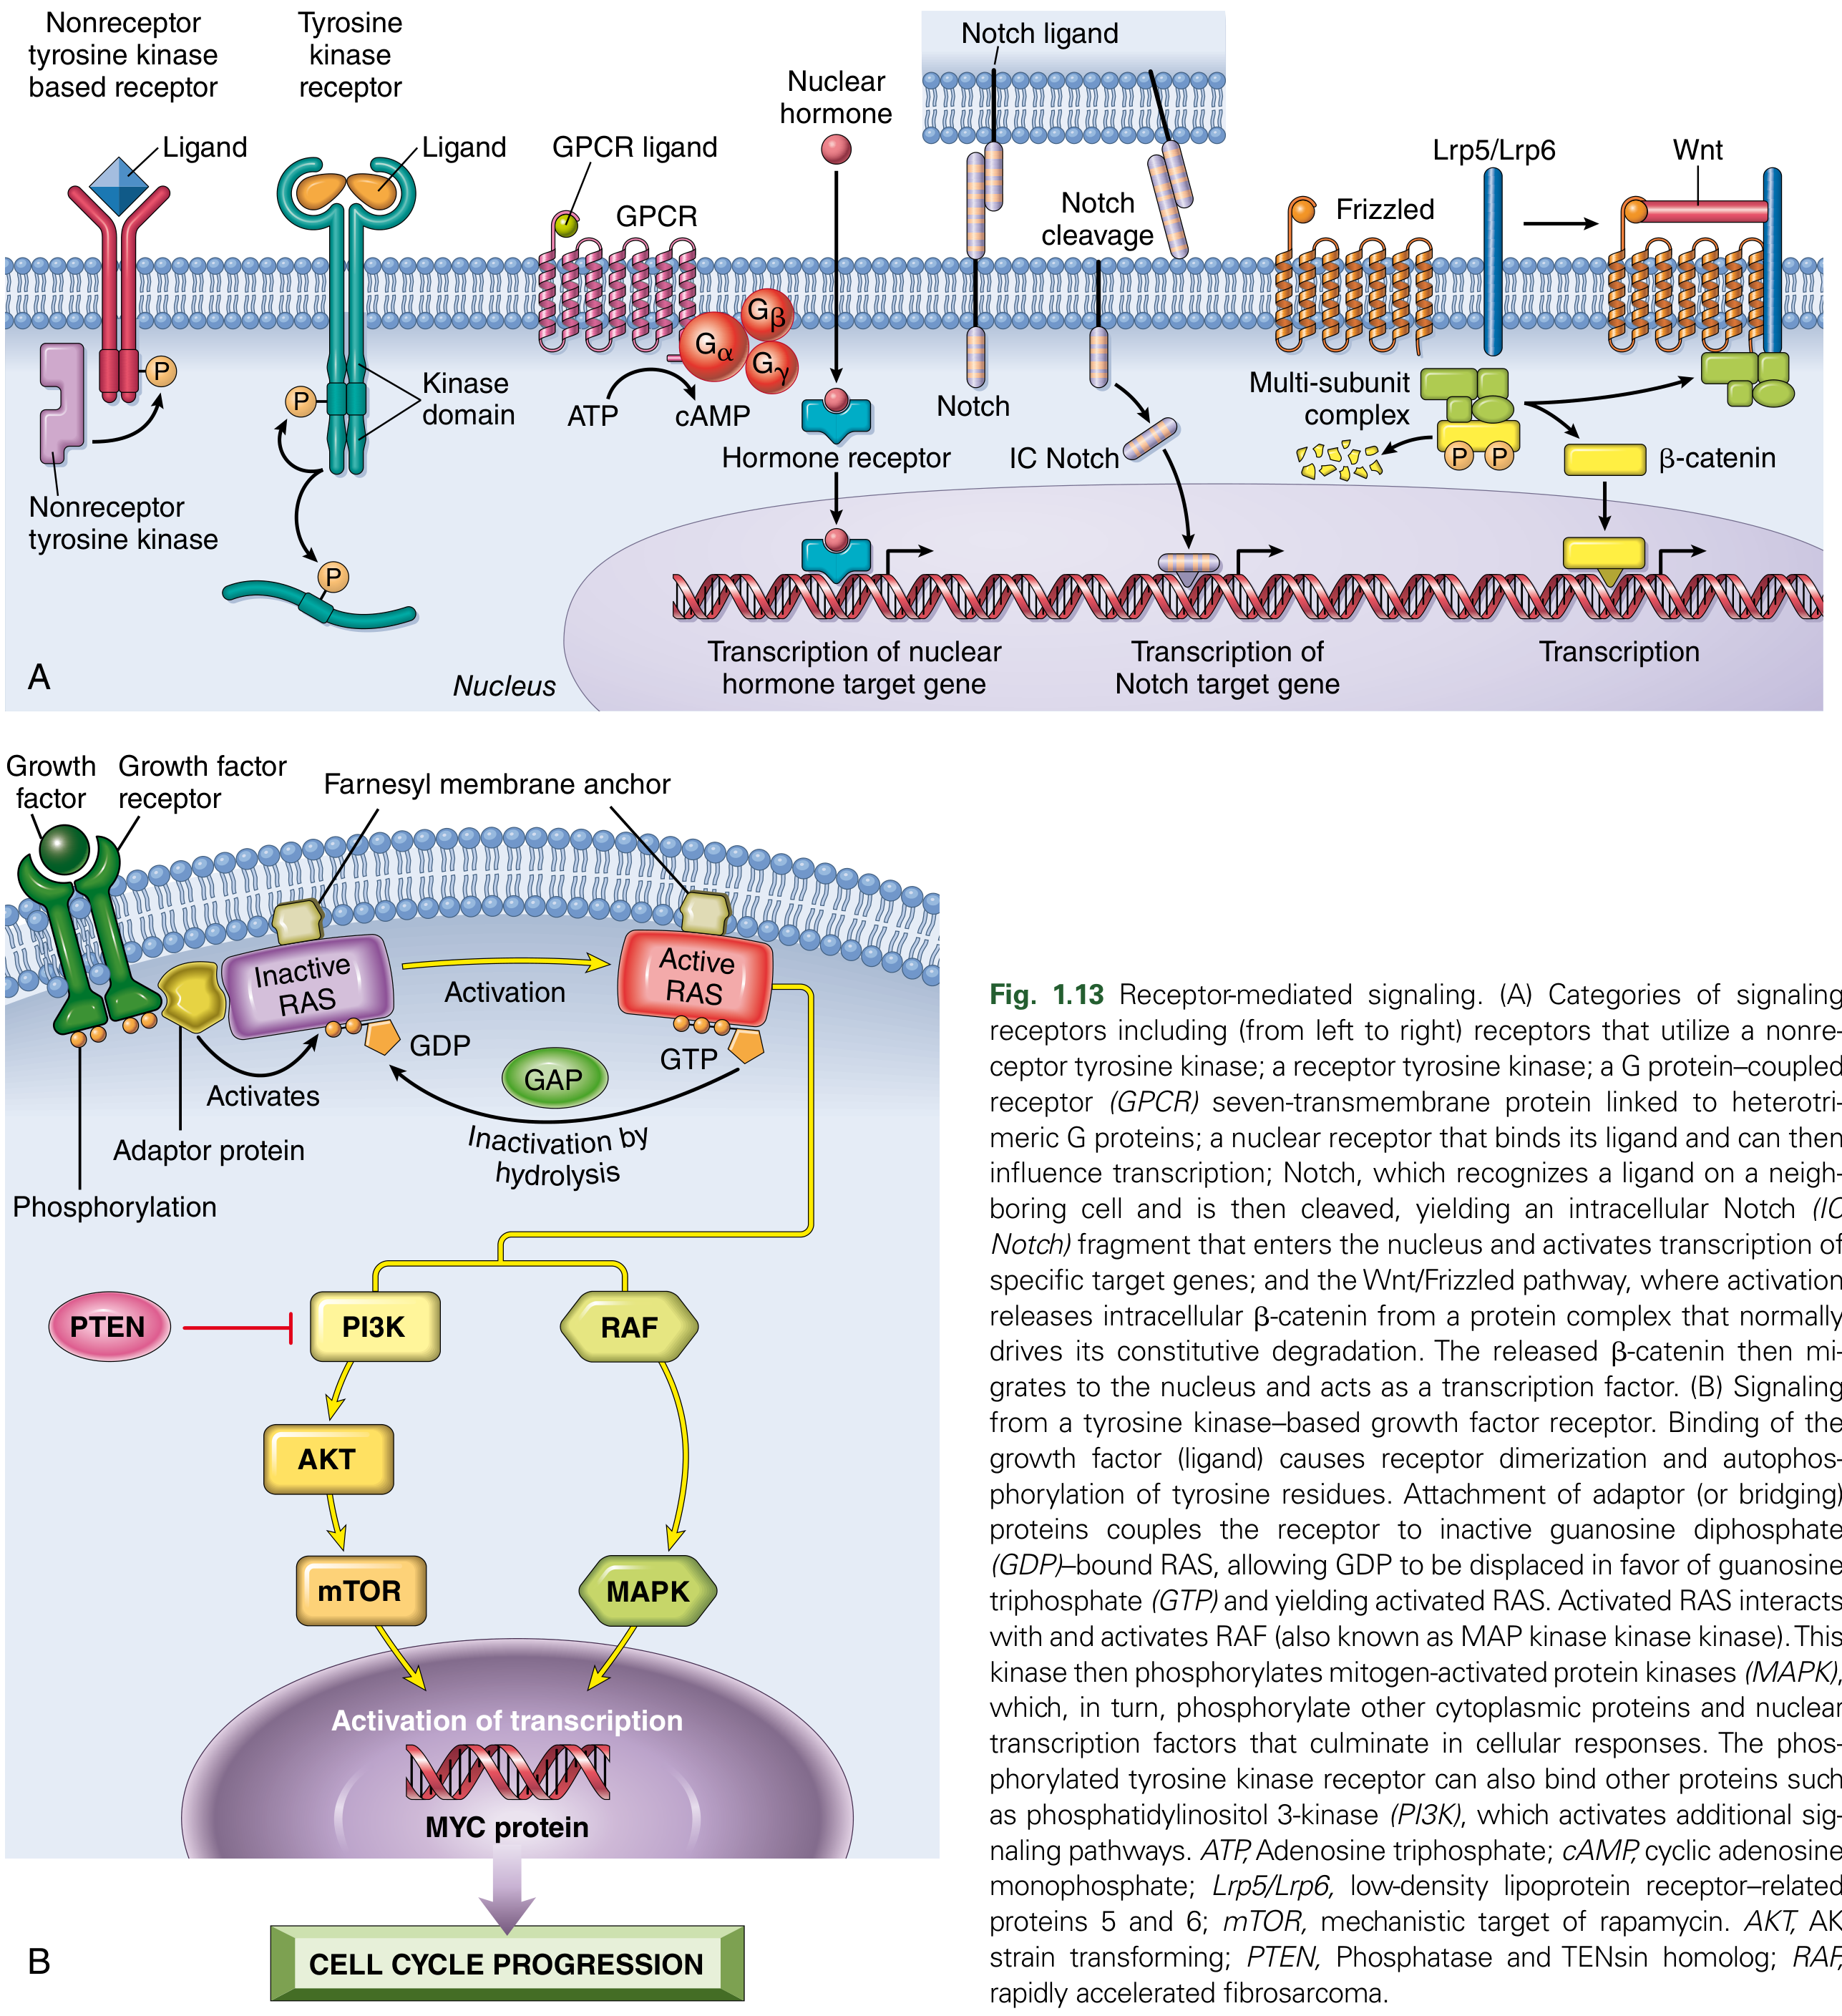
1. Ion-Channel Receptors (Ionotropic Receptors)
- Signal transduction = conformational change upon ligand binding → change in ion flux
- Alter membrane potential; propagate or inhibit action potentials
- Example: nicotinic acetylcholine receptor
- Used by most small-molecule neurotransmitters
2. Receptors with Kinase Activity (RTKs)
- Integral membrane proteins with an extracellular ligand-binding domain and an intracellular tyrosine kinase domain
- Ligand binding → receptor dimerization → autophosphorylation of tyrosine residues on cytoplasmic tails
- Phosphotyrosine residues recruit adaptor proteins (e.g., Grb2) via SH2 domains
- Receptors like immune receptors, some cytokine receptors, and integrins have no intrinsic catalytic activity
- They recruit separate intracellular proteins (nonreceptor tyrosine kinases) after ligand binding
- Src is the prototype; contains SH2 domains (bind phosphotyrosine residues) and SH3 domains (bind proline-rich sequences)
3. G Protein-Coupled Receptors (GPCRs) / Seven-Transmembrane Receptors
- Traverse the plasma membrane 7 times ("serpentine receptors"); >1500 identified
- After ligand binding, GPCR associates with an intracellular G protein (GDP-bound)
- GDP is exchanged for GTP → G protein activates
- Downstream pathways:
- cAMP generation (via adenylyl cyclase → PKA activation)
- IP3 generation (via PLCβ → IP3 + DAG) → IP3 releases Ca²⁺ from ER; DAG activates PKC
4. Nuclear Receptors
- Bind lipid-soluble ligands (steroids, thyroid hormone, retinoic acid, vitamin D) that diffuse directly into the cell
- Ligand-receptor complex binds to nuclear DNA (hormone response elements) → directly activates or represses gene transcription
- No second messenger required
5. Notch Receptors
- Recognizes ligand on a neighboring cell
- Ligand binding → proteolytic cleavage of Notch receptor → intracellular Notch (IC Notch) fragment translocates to nucleus
- Forms a transcription complex and activates target genes
- Important in cell fate determination
6. Wnt / Frizzled Pathway (β-catenin pathway)
- Wnt ligands bind Frizzled receptors (a distinct family of GPCRs) + co-receptors Lrp5/Lrp6
- Recruits intracellular protein Dishevelled → disrupts the β-catenin degradation complex
- Normally β-catenin is continuously targeted for ubiquitin-directed proteasomal degradation
- Wnt signaling stabilizes β-catenin → it translocates to nucleus → forms transcription complex
- Mutational activation of this pathway is seen in colorectal carcinoma (APC mutations)
Key Downstream Signal Transduction Pathways
A. RAS - MAP Kinase Pathway
- Ligand binds RTK → receptor dimerization and autophosphorylation of tyrosine residues
- Adaptor protein Grb2 (contains SH2 domain) binds to phosphotyrosine residues on the activated receptor
- Grb2 recruits SOS (guanine nucleotide exchange factor / GEF) via SH3 domain
- SOS catalyzes exchange of GDP → GTP on RAS (a membrane-anchored monomeric G protein via farnesyl anchor) → RAS becomes active
- Active RAS binds and activates RAF (= MAPKKK = mitogen-activated protein kinase kinase kinase)
- RAF phosphorylates MEK (= MAPKK)
- MEK phosphorylates ERK (= MAPK)
- ERK translocates to nucleus → phosphorylates transcription factors (e.g., MYC, FOS, JUN) → gene expression changes → cell proliferation and survival
Oncology relevance: RAS mutations (especially KRAS) are found in ~30% of all cancers. Mutant RAS is locked in the GTP-bound (active) state, constitutively driving cell proliferation.
B. PI3K - AKT - mTOR Pathway
- Activated RTK → PI3K (Phosphatidylinositol 3-kinase) binds to phosphotyrosine via SH2 domain → PI3K is activated
- PI3K phosphorylates PIP2 → PIP3 (in the inner plasma membrane leaflet)
- PIP3 recruits proteins with Pleckstrin Homology (PH) domains → including AKT (Protein Kinase B)
- AKT is activated → activates mTOR and other survival signals
- mTOR promotes cell growth, protein synthesis, and proliferation
C. Phosphatidylinositol / IP3-DAG-Ca²⁺ Pathway (Second Messenger Pathway)
- PLCγ (activated by RTKs) or PLCβ (activated by GPCRs) cleaves PIP2 into two second messengers:
- IP3 (Inositol 1,4,5-trisphosphate) → diffuses to ER → opens Ca²⁺ channels → raises intracellular Ca²⁺ → activates calmodulin and other Ca²⁺-dependent enzymes
- DAG (Diacylglycerol) → remains in plasma membrane → activates PKC (Protein Kinase C) → phosphorylates multiple downstream targets → gene expression, cell proliferation
D. JAK-STAT Pathway
- Cytokine binding → receptor dimerization/aggregation
- JAK (Janus Kinase) - constitutively associated with cytoplasmic receptor tail - becomes activated
- JAK phosphorylates STAT (Signal Transducer and Activator of Transcription) proteins on tyrosine residues
- Phosphorylated STATs dimerize and translocate to the nucleus
- STATs act as gene-specific transcription factors → alter expression of immune/proliferative genes
E. TGF-β / SMAD Pathway
- TGF-β binding brings together type I and type II serine/threonine kinase receptors
- Type II receptor phosphorylates and activates Type I receptor
- Activated Type I receptor phosphorylates SMAD proteins
- SMADs (like STAT) translocate to nucleus as gene-specific transcription factors
- TGF-β signaling generally suppresses cell growth (tumor suppressor role early in carcinogenesis) but can promote epithelial-mesenchymal transition (EMT) late in cancer
Modular Signaling: Hubs, Nodes, and Adaptors
- Any single phosphorylation event can lead to: enzyme activation/inhibition, nuclear/cytoplasmic localization of transcription factors, actin polymerization, protein degradation, or feedback loop activation
- Adaptor proteins (e.g., Grb2, IRS-1) link different enzymes and assemble multiprotein complexes
- Signal networks function like computer networks - protein complexes are "nodes," and biochemical flows are "hubs"
- This systems-level complexity is studied by systems biology / computational biology
Transcription Factors - The Final Effectors
- MYC, JUN - growth-promoting genes, activated by RTK/RAS pathways
- TP53 - cell cycle-inhibiting gene (tumor suppressor)
- Transcription factor activity is regulated by posttranslational modifications (phosphorylation), nuclear translocation, and protein half-life
Summary Table
| Receptor Type | Ligand Examples | Key Pathway | Key Effector |
|---|---|---|---|
| RTK | EGF, PDGF, FGF, insulin | RAS-MAPK, PI3K-AKT | MYC, ERK, AKT |
| Nonreceptor TK | Integrins, immune receptors | Src-family kinases | Multiple TFs |
| GPCR | Adrenaline, glucagon | cAMP-PKA, IP3-DAG | PKA, PKC, Ca²⁺ |
| Nuclear receptor | Steroids, thyroid hormone | Direct DNA binding | Gene transcription |
| Notch | Delta, Jagged (cell contact) | Proteolytic cleavage | IC Notch transcription |
| Wnt/Frizzled | Wnt proteins | β-catenin stabilization | β-catenin TF |
| Cytokine receptor | IL, IFN, EPO | JAK-STAT | STAT TFs |
| TGF-β receptor | TGF-β, BMP | SMAD | SMAD TFs |
Pathological Relevance (as emphasized in Harsh Mohan)
| Pathway | Cancer Relevance |
|---|---|
| RAS-MAPK | KRAS/NRAS mutations in colorectal, pancreatic, lung cancer |
| PI3K-AKT-mTOR | PTEN loss in prostate, endometrial, glioblastoma |
| Wnt/β-catenin | APC mutations in colorectal cancer; aberrant β-catenin |
| Notch | Notch mutations in T-cell ALL, breast cancer |
| JAK-STAT | JAK2 V617F in myeloproliferative neoplasms |
| TGF-β/SMAD | SMAD4 loss in pancreatic, colorectal cancer |
cerebral malaria based on harsh mohan textbook
cerebral malaria brain pathology Durck granuloma ring hemorrhage sequestration parasitized erythrocytes
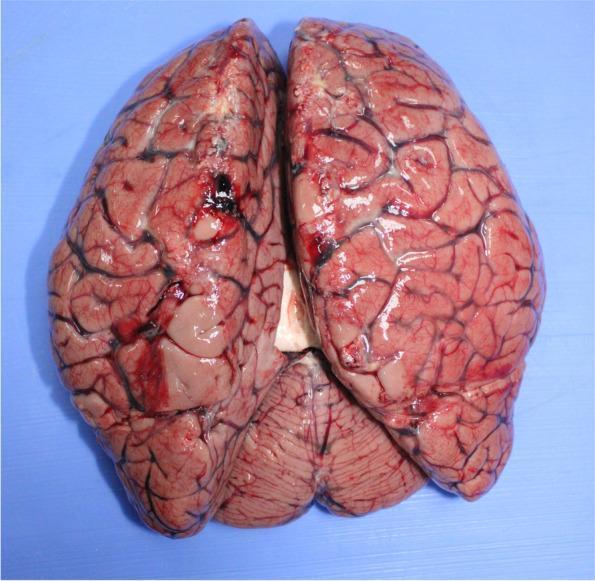
This clinical photograph displays a superior-posterior view of a human brain at autopsy, showcasing macro-pathological signs of severe cerebral congestion and edema, secondary to a fatal case of cerebral malaria (Plasmodium falciparum). The cortical surface exhibits a generalized dusky red-to-pink discoloration, characteristic of massive vascular congestion. Significant cerebral edema is evidenced by the marked flattening of the gyri and the narrow, compressed appearance of the sulci. The brain appears enlarged, with visible engorgement of the pial vessels, which are prominent and dark. Focal areas of surface hemorrhage and dusky discoloration are visible, particularly along the left cerebral hemisphere. The cerebellum is visible in the lower portion of the frame, also demonstrating vascular prominence. This image is a key educational resource for understanding the macroscopic manifestations of malaria-related brain injury, highlighting the physiological consequences of parasitized erythrocyte sequestration in cerebral capillaries which leads to increased intracranial pressure and vascular compromise.
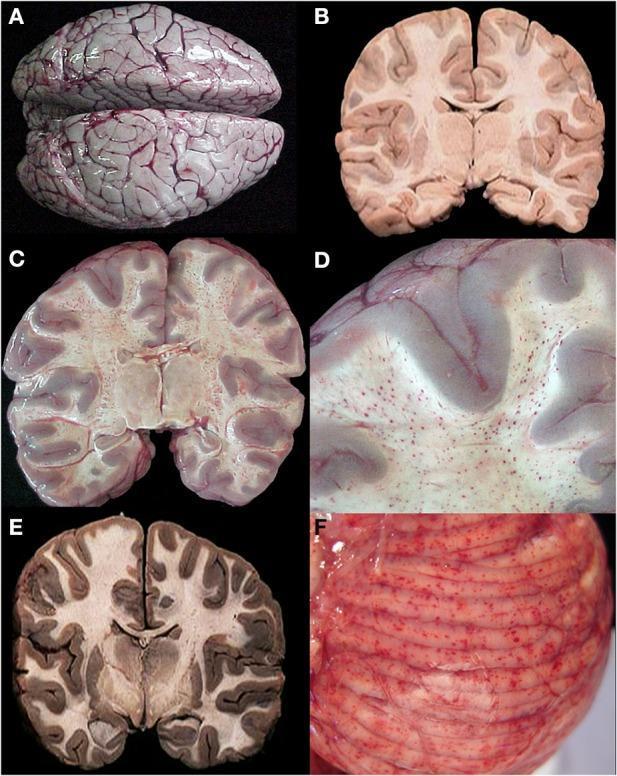
This composite of six clinical pathology photographs (A-F) illustrates the gross anatomical features of the brain in cases of fatal cerebral malaria. Panel A shows an external view of a whole brain demonstrating significant cerebral edema, characterized by flattened gyri and narrowed sulci, with a classic 'slate gray' to purple discoloration due to intravascular malarial pigment. Panels B, C, and E present coronal brain slices showing varying presentations: (B) is a control with normal color and no lesions; (C) reveals diffuse petechial 'ring' hemorrhages concentrated in the white matter; and (E) shows intense gray-brown discoloration and swelling without hemorrhages. Panel D is a higher magnification of the cerebral cortex, highlighting the sharp demarcation between the hemorrhagic white matter and the unaffected cortical gray matter. Panel F shows a gross external view of the cerebellum with prominent, diffuse petechial hemorrhages visible on the surface of the folia. This sequence educates on the histopathological variations of cerebral malaria (CM1 and CM2), emphasizing sequestration, vascular congestion, and microvascular injury.
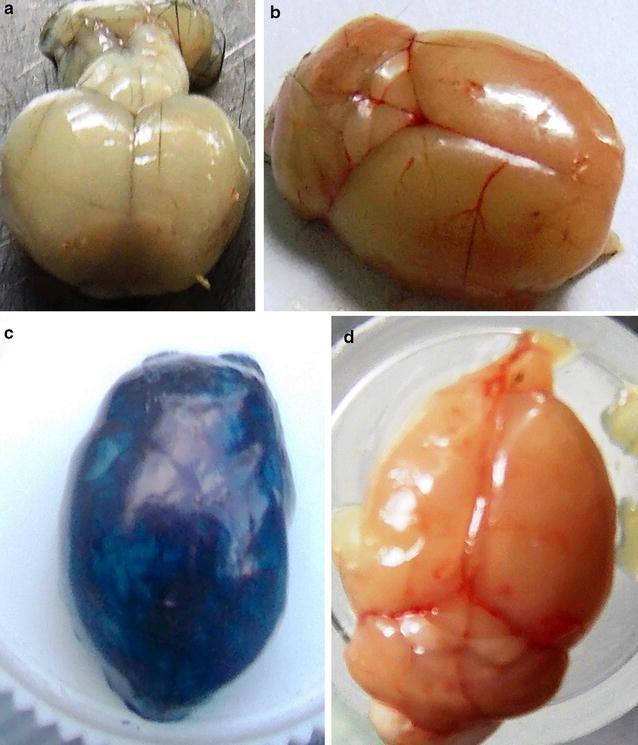
This set of clinical specimen photographs demonstrates an experimental mouse model of cerebral malaria and the evaluation of blood-brain barrier (BBB) integrity using Evans Blue dye. Image (a) shows a brain from an infected, non-stained C57BL/6 mouse exhibiting significant tissue whitening, indicative of cerebral hypoxia and reduced blood flow due to parasitized red blood cell sequestration. Image (b) presents a healthy, uninfected control brain with normal pinkish-tan coloration and visible surface vasculature, reflecting an intact BBB. Image (c) displays an infected brain after intravenous administration of Evans Blue dye; the deep blue staining of the parenchyma indicates substantial leakage of the dye through a compromised BBB, a hallmark of experimental cerebral malaria. Image (d) illustrates a brain from an infected mouse 60 days post-treatment with trioxaquine, showing a return to normal gross morphology, visible vasculature, and an absence of blue staining, confirming clinical recovery and restoration of BBB integrity. This comparison serves as an educational tool for understanding pathophysiology in neuro-parasitology and pharmacological efficacy in treating vascular neurological complications.
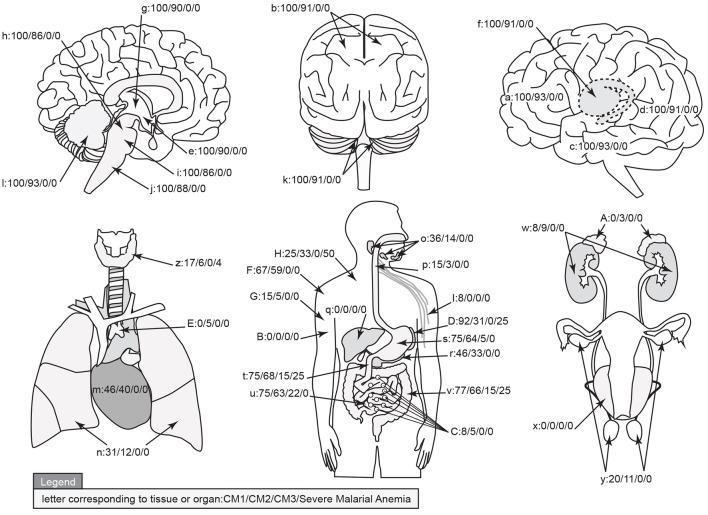
This medical infographic presents a graphical map of parasite sequestration distribution across human organs in four diagnostic categories of malaria: CM1, CM2, CM3 (Cerebral Malaria subtypes), and Severe Malarial Anemia (SMA). The visual consists of anatomical diagrams illustrating the brain (sagittal, coronal, and lateral views), respiratory system, gastrointestinal tract, and renal/reproductive systems. Each organ and tissue site is labeled with a letter key followed by a four-part percentage string (e.g., 100/90/0/0), representing the prevalence of sequestration for CM1, CM2, CM3, and SMA, respectively. Sequestration is defined by high levels of parasitized red blood cells or cytoadherent layers within the microvasculature. Key findings shown include 100% sequestration in all brain regions for CM1, and slightly lower rates (86-93%) for CM2. Significant non-cerebral sequestration is noted in the stomach (75%), large intestine (77%), and small intestine (75%) for CM1. Conversely, CM3 and SMA show minimal to zero sequestration in most organs, except for low levels in the gastrointestinal tract and spleen. This diagram serves as a comparative anatomical study of Plasmodium falciparum pathogenesis and diagnostic classification.
malaria pigment hemozoin brain histology microscopy
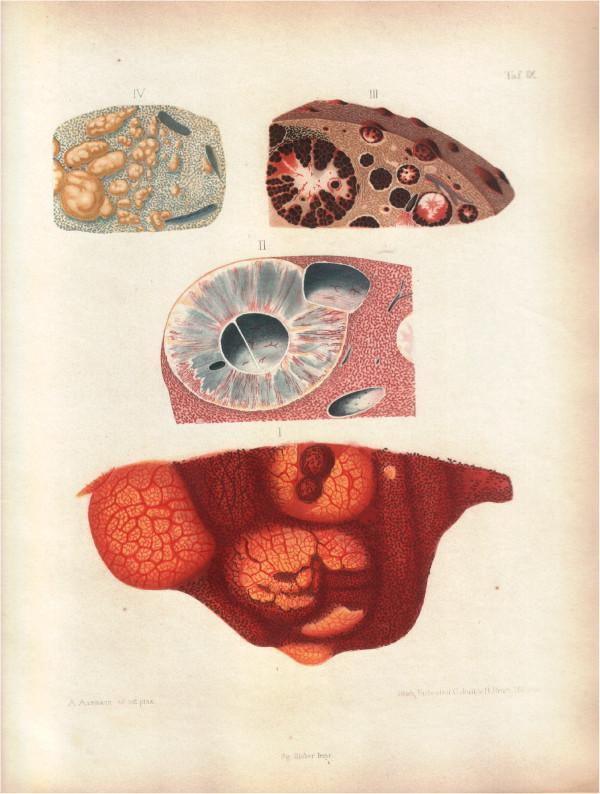
A historical medical illustration consisting of four numbered anatomical drawings (I-IV) by Friedrich Theodor von Frerichs, depicting the gross and microscopic deposition of malarial pigment (hemozoin) in human internal organs. Section I shows a reddish-brown organ (likely liver) with a lobular architecture and dark, reticular staining patterns. Section II illustrates a cross-section of a layered structure, possibly an eye or blood vessel, showing central dark pigmentation and peripheral radiating lines. Section III displays a brown-pigmented organ section containing multiple circular inclusions; these structures exhibit a combination of black pigment arranged in concentric patterns and lighter reddish areas, representing the accumulation of hematin-derived crystals in tissue. Section IV presents a microscopic view of light gray tissue with scattered, irregular, dark-staining oval structures and brown inclusions. The plate serves as an early pathological study of how malaria affects systemic organs through the deposition of breakdown products from erythrocytes, supporting the 19th-century transition toward understanding malaria as a hematological disease.
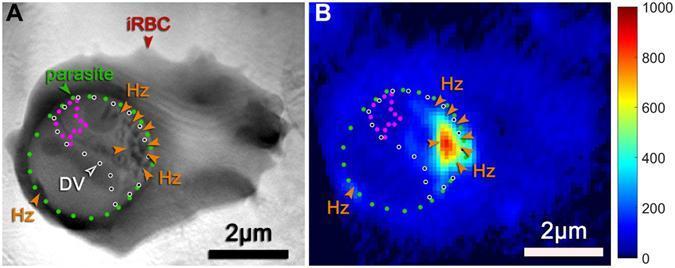
A correlative microscopy study of a human red blood cell infected with Plasmodium falciparum (malaria parasite), featuring two side-by-side images. Image (A) is a soft X-ray tomography (SXT) projection demonstrating high-contrast visualization of carbon-dense structures. Dotted lines delineate the parasite (green), the digestive vacuole (white/black), and a region free of hemozoin (magenta). Hemozoin crystals (Hz) appear as dark-grey, highly absorbent spots pointed out by orange arrows. Image (B) is a corresponding iron X-ray fluorescence (XRF) map of the same cell, aligned to the tomography dataset. This map uses a pseudocolor gradient (blue to red) to represent iron concentration intensity. High iron fluorescence (red/orange) corresponds precisely to the locations of hemozoin crystals identified in image A, illustrating the sequestration of iron within the parasite's digestive vacuole as a byproduct of hemoglobin digestion. Both images include a 2μm scale bar, highlighting the morphological and chemical features of a trophozoite-stage infection.
This composite of six clinical pathology photographs (A-F) illustrates the gross anatomical features of the brain in cases of fatal cerebral malaria. Panel A shows an external view of a whole brain demonstrating significant cerebral edema, characterized by flattened gyri and narrowed sulci, with a classic 'slate gray' to purple discoloration due to intravascular malarial pigment. Panels B, C, and E present coronal brain slices showing varying presentations: (B) is a control with normal color and no lesions; (C) reveals diffuse petechial 'ring' hemorrhages concentrated in the white matter; and (E) shows intense gray-brown discoloration and swelling without hemorrhages. Panel D is a higher magnification of the cerebral cortex, highlighting the sharp demarcation between the hemorrhagic white matter and the unaffected cortical gray matter. Panel F shows a gross external view of the cerebellum with prominent, diffuse petechial hemorrhages visible on the surface of the folia. This sequence educates on the histopathological variations of cerebral malaria (CM1 and CM2), emphasizing sequestration, vascular congestion, and microvascular injury.
Cerebral Malaria
Note: Harsh Mohan's Textbook of Pathology is not in the library. This answer is drawn from Robbins & Kumar Basic Pathology and Robbins, Cotran & Kumar Pathologic Basis of Disease, which are the primary references for Harsh Mohan's malaria coverage, along with Sherris & Ryan's Medical Microbiology.
Definition
Causative Organism
- Plasmodium falciparum - the only species responsible for cerebral malaria
- Transmitted by the bite of a female Anopheles mosquito
- Humans are the only natural reservoir
- Also called malignant tertian malaria (febrile paroxysms every 48 hours)
Life Cycle (Relevant to Pathogenesis)
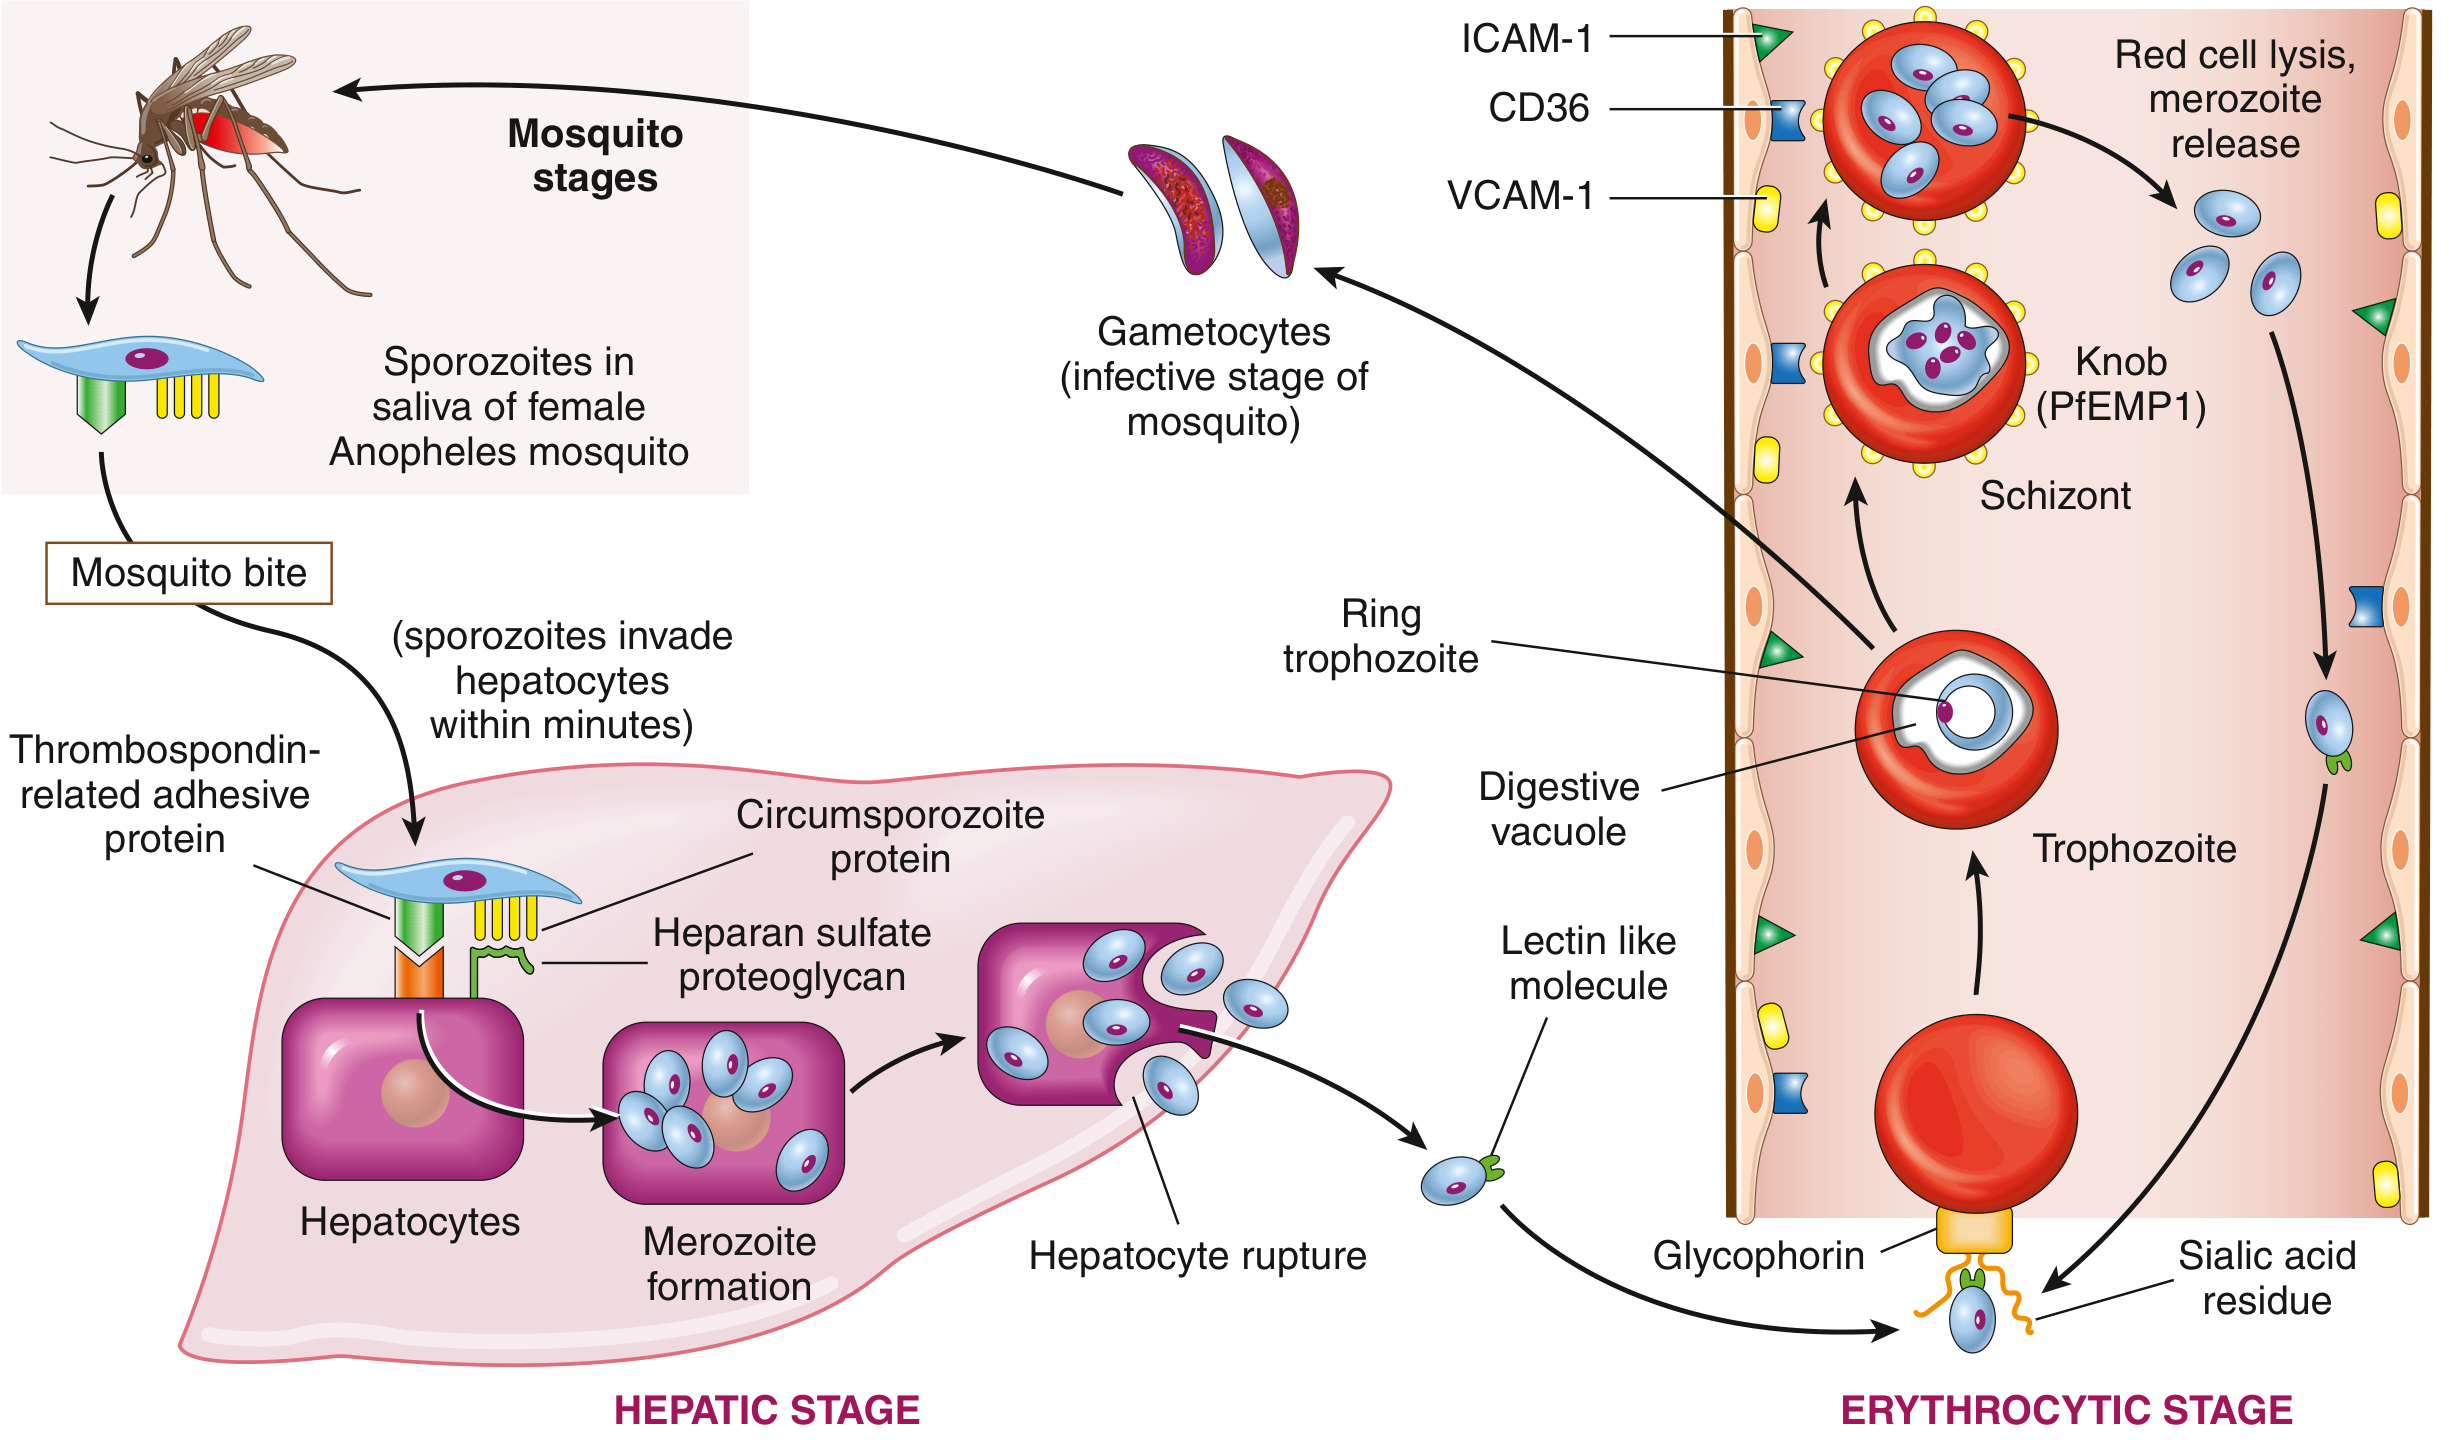
- Mosquito bite → sporozoites introduced into blood
- Sporozoites travel to liver → bind hepatocytes via thrombospondin-related adhesive protein and circumsporozoite protein interacting with heparan sulfate proteoglycans
- Sporozoites → differentiate into merozoites in hepatocytes
- Hepatocytes rupture → release merozoites into bloodstream (incubation 1-4 weeks)
- Merozoite surface lectin-like molecule binds sialidated glycophorin on RBCs → RBC invasion
- Inside RBC: merozoite → ring trophozoite → schizont (expressing PfEMP1) → either gametocytes (sexual cycle) or more merozoites
- Schizont rupture → red cell lysis → merozoite release → next cycle (every 48 hrs)
Pathogenesis of Cerebral Malaria
1. Cytoadherence and Sequestration (Central Mechanism)
- Schizonts express PfEMP1 (Plasmodium falciparum Erythrocyte Membrane Protein 1) on knob-like projections on the infected RBC surface
- PfEMP1 binds to adhesion molecules on cerebral vascular endothelium:
- ICAM-1 (Intercellular Adhesion Molecule-1)
- VCAM-1 (Vascular Cell Adhesion Molecule-1)
- CD36
- This causes parasitized RBCs to arrest in cerebral capillaries - a process called sequestration
- Normally RBCs have negatively charged surfaces that repel endothelium - PfEMP1 overcomes this
- Sequestration leads to microvascular obstruction, reduced cerebral blood flow, hypoxia, and ischemia
2. Rosette Formation and Auto-agglutination
- Parasitized RBCs also bind to unparasitized RBCs (rosetting) and to other parasitized cells (auto-agglutination), further aggravating vascular obstruction
3. Role of Cytokines (TNF, IL-1)
- At schizont rupture, TNF and IL-1 are released
- TNF upregulates endothelial adhesion molecules (ICAM-1, VCAM-1) on cerebral endothelium → increases sequestration
- High TNF concentrations can directly cause:
- Hypoglycemia (a major complication)
- Lactic acidosis
- Endothelial injury and blood-brain barrier disruption
4. Blood-Brain Barrier Disruption
- Sequestration + cytokine-mediated endothelial activation → disruption of the blood-brain barrier
- Leads to cerebral edema, raised intracranial pressure, and herniation
5. Metabolic Derangements
- Hypoglycemia (from TNF effects + high parasite glucose consumption + quinine-stimulated insulin release)
- Lactic acidosis (from anaerobic glycolysis due to impaired perfusion)
- Both contribute to coma and neuronal injury
Morphology (Pathological Features)
Gross Appearance
- Brain appears enlarged (cerebral edema)
- Flattened gyri and narrowed sulci (raised ICP)
- Slate-gray to purple discoloration of cortex due to malarial pigment (hemozoin/hematin) deposited within vessels and macrophages
- Petechial ("ring") hemorrhages scattered throughout white matter and gray matter
- Congestion and engorgement of pial and cortical vessels
- Dusky red-pink discoloration from vascular congestion
Microscopic Features
- Sequestration - cerebral capillaries and venules are packed with parasitized RBCs adherent to the endothelium
- Malarial pigment (hemozoin) - brown-black granular pigment within parasitized RBCs, macrophages, and vessel walls (derived from hemoglobin degradation)
- Dürck's granulomas (ring hemorrhages) - pathognomonic lesion of cerebral malaria:
- A central necrotic area around a thrombosed/blocked small vessel
- Surrounded by a ring of hemorrhage
- Surrounded peripherally by microglial cells and astrocytes
- Cerebral edema - perivascular and interstitial
- Vascular congestion - capillary engorgement with parasitized RBCs
- Microglial nodules scattered throughout white matter
- In systemic organs:
- Spleen - massively enlarged (splenomegaly) due to mononuclear phagocyte hyperplasia; gray-black pigmentation ("malarial spleen")
- Liver - hepatomegaly, Kupffer cell hyperplasia with malarial pigment
- Bone marrow, lymph nodes - brown discoloration from hematin
Clinical Features
| Feature | Details |
|---|---|
| Onset | Rapid progression, within days to weeks |
| Fever | Paroxysmal, every 48 hrs (malignant tertian) |
| Neurological | Delirium, confusion, convulsions (focal/generalized), coma |
| Motor signs | Focal neurological deficits, abnormal posturing |
| Eyes | Malarial retinopathy (retinal whitening, vessel changes, hemorrhages) |
| Hypoglycemia | Common, especially in children and with quinine treatment |
| Anemia | Severe hemolytic anemia |
| Pulmonary | Acute pulmonary insufficiency (ARDS) frequently accompanies |
| Renal | Hemoglobinuria ("blackwater fever"), acute renal failure |
| Mortality | Untreated: ~100%; treated: ~15-25% |
- Unarousable coma (Glasgow Coma Scale <11 or Blantyre Coma Scale <3 in children)
- P. falciparum parasitemia on blood smear
- Exclusion of other causes of coma
Long-term Sequelae
- Cognitive deficits
- Language and behavioral problems
- Epilepsy
- Up to 20% of affected children have long-term cognitive deficits
Complications
- Hypoglycemia - most important metabolic complication
- Blackwater fever - massive intravascular hemolysis → hemoglobinemia + hemoglobinuria + jaundice + renal failure
- Acute pulmonary edema / ARDS
- Acute renal failure
- Thrombocytopenia - due to splenic pooling and shortened platelet lifespan
- Glomerulonephritis - immune complex deposition (more in P. malariae)
- Severe anemia
Immunity
- Host mounts a stage-, species-, and strain-specific immune response that limits but does not eliminate infection
- Both T and B lymphocytes are required for recovery
- Antiplasmodial antibodies develop within 2 weeks; ↑ antibody levels → ↓ parasitemia
- Passive transfer of antibodies from immune mothers (transplacental) explains relative protection in young infants
- Sickle cell trait (HbAS), G6PD deficiency, and HbF are naturally protective
Diagnosis
| Test | Finding |
|---|---|
| Peripheral blood smear (Giemsa stain) | Multiple ring forms in one RBC, gametocytes; >5% infected RBCs indicates severity |
| Thick film | High sensitivity for detecting parasites |
| RDT (Rapid diagnostic test) | Detects HRP2 antigen of P. falciparum |
| Lumbar puncture | To exclude meningitis; CSF usually normal in cerebral malaria |
| Blood glucose | Mandatory - hypoglycemia common |
| Retinal examination | Malarial retinopathy is specific for cerebral malaria |
Treatment
- IV artesunate - drug of choice for severe/cerebral malaria (superior to quinine in clinical trials)
- IV quinine (+ doxycycline) - alternative
- Supportive: antipyretics, anticonvulsants, correction of hypoglycemia, transfusion for severe anemia
- Dexamethasone is contraindicated (shown to worsen outcome in cerebral malaria)
- Drug-resistant P. falciparum strains are an increasing problem
Prevention
- Insecticide-treated bed nets
- Elimination of mosquito breeding sites (removal of stagnant water)
- Chemoprophylaxis (chloroquine in sensitive areas; mefloquine/atovaquone-proguanil elsewhere)
- RTS,S/AS01 vaccine (Mosquirix) - contains sporozoite antigens; partial protection; reduces fatal cerebral malaria cases in children when deployed