
Explain ecg basics with pictures in detail and put a schedule for me like what should I learn each day (for learning ecg)
Reading File
Finding Sources
Finding Sources
Searching Images
ECG electrocardiogram waveform P wave QRS complex T wave diagram
Finding Sources
Finding Sources
Searching Images
cardiac conduction system SA node AV node bundle of His Purkinje diagram
Reading File
Reading File
Searching Images
12 lead ECG placement chest leads limb leads
Loading Image
Loading Image
Loading Image
Loading Image
Searching Images
ECG axis deviation normal axis left right axis
Searching Images
ECG paper grid measurement rate calculation small big boxes
Searching Images
normal sinus rhythm 12 lead ECG all leads
Reading File
Loading Image
Loading Image
Now I have everything I need. Let me compile the full ECG basics guide with pictures and the learning schedule.---
ECG Basics — Complete Guide with Pictures
1. What Is an ECG?
An ECG (electrocardiogram) is a graphic recording of the time-dependent electrical activity of the heart. It measures rate, rhythm, conduction velocity, and the direction of electrical vectors — all from electrodes placed on the skin.
2. The Cardiac Conduction System
Before reading ECGs, you must understand why each wave appears. The heart generates electricity in a predictable sequence:
SA Node → Atria → AV Node (delay) → Bundle of His → Left + Right Bundle Branches → Purkinje Fibers → Ventricular Myocardium
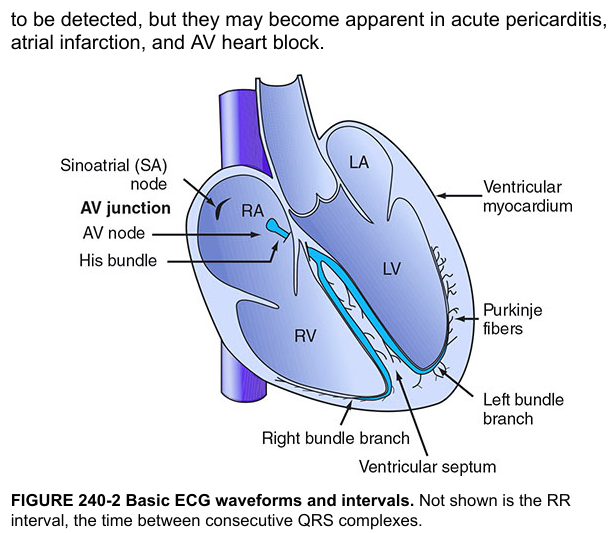
Fig: The conduction pathway traced in yellow — SA node → AV node → His bundle → bundle branches → Purkinje fibers. Each step produces a corresponding wave on the ECG. — Harrison's Principles of Internal Medicine, 21st Ed.
| Structure | Function | ECG Correlate |
|---|---|---|
| SA node | Primary pacemaker (60–100/min) | Sets heart rate |
| AV node | Delays signal (0.12–0.20 s) | PR interval |
| Bundle of His + branches | Fast conduction to ventricles | QRS onset |
| Purkinje fibers | Spread throughout ventricular wall | QRS duration |
3. The ECG Waveforms — One Beat at a Time
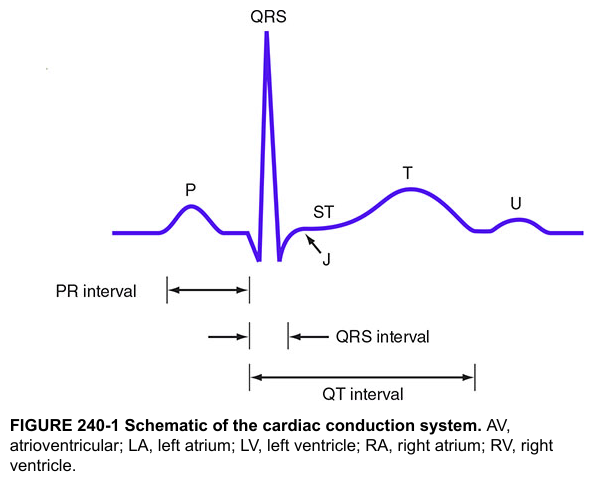
Fig: Standard ECG schematic showing P wave, QRS complex, ST segment, T wave, U wave, with PR interval, QRS interval, QT interval labeled. — Harrison's Principles of Internal Medicine, 21st Ed.
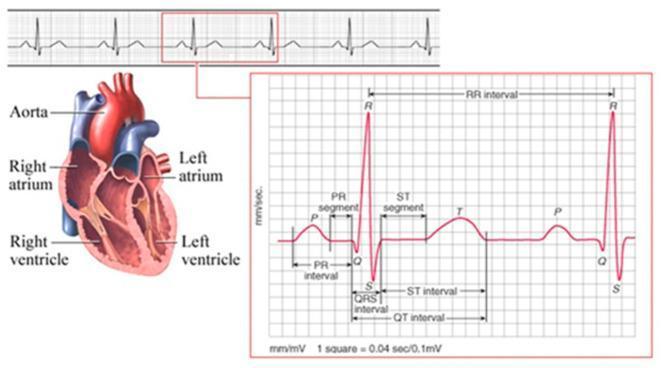
Fig: Each segment correlated with cardiac anatomy — PR segment, QRS interval, ST segment, QT interval, RR interval.
Wave-by-Wave Breakdown
🔵 P Wave — Atrial Depolarization
- Small, rounded, upward deflection
- Duration: < 0.12 s (3 small boxes)
- Amplitude: < 2.5 mm
- Meaning: The SA node fires; both atria contract
🔴 QRS Complex — Ventricular Depolarization
- Q wave: First downward deflection (if present)
- R wave: First upward deflection (tall, sharp spike)
- S wave: Downward deflection after R
- Duration: 0.06–0.10 s (1.5–2.5 small boxes). If ≥ 0.12 s → bundle branch block
- Meaning: Both ventricles depolarize and contract
🟢 T Wave — Ventricular Repolarization
- Broad, rounded, same direction as QRS (concordant)
- Meaning: Ventricles recharge for the next beat
🟡 U Wave — (sometimes visible)
- Small deflection after T wave
- Associated with hypokalemia, bradycardia
4. The Intervals and Segments
| Interval/Segment | From → To | Normal Duration | Clinical Significance |
|---|---|---|---|
| PR interval | Start of P → Start of QRS | 0.12–0.20 s (3–5 small boxes) | AV node conduction time; prolonged = heart block |
| QRS duration | Start → End of QRS | 0.06–0.10 s (< 3 small boxes) | Ventricular conduction; wide = BBB or VT |
| ST segment | End of QRS (J point) → Start of T | Isoelectric (flat) | Elevated = STEMI; depressed = ischemia/NSTEMI |
| QT interval | Start of QRS → End of T | 0.35–0.45 s (varies with rate) | Prolonged = risk of torsades de pointes |
| RR interval | R peak → next R peak | Depends on heart rate | Used to calculate rate |
5. The ECG Paper and Grid
ECG paper is standardized worldwide:
| Box Size | Time | Voltage |
|---|---|---|
| 1 small box (1 mm) | 0.04 seconds | 0.1 mV |
| 1 large box (5 mm) | 0.20 seconds | 0.5 mV |
| 5 large boxes | 1.0 second | — |

Calculating Heart Rate (Quick Method)
Count the large boxes between two consecutive R waves (R–R interval), then:
Heart Rate = 300 ÷ (number of large boxes)
| Large boxes between R–R | Heart Rate |
|---|---|
| 1 | 300 bpm |
| 2 | 150 bpm |
| 3 | 100 bpm |
| 4 | 75 bpm |
| 5 | 60 bpm |
| 6 | 50 bpm |
Mnemonic: 300 – 150 – 100 – 75 – 60 – 50
6. The 12-Lead ECG — What Are All Those Leads?
A standard ECG uses 10 electrodes to produce 12 different "views" of the heart's electrical activity.
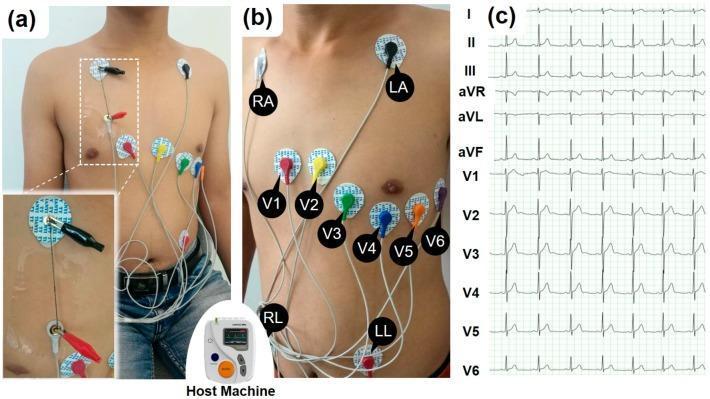
Fig: (a/b) Electrode placement — 4 limb leads (RA, LA, RL, LL) + 6 precordial leads (V1–V6). (c) Resulting 12-lead ECG tracing.
The 12 Leads Grouped
Limb leads (frontal plane):
- I, II, III — Standard bipolar limb leads
- aVR, aVL, aVF — Augmented unipolar limb leads
Precordial leads (horizontal plane):
- V1 — Right sternal border, 4th intercostal space
- V2 — Left sternal border, 4th intercostal space
- V3 — Between V2 and V4
- V4 — 5th intercostal space, midclavicular line
- V5 — Anterior axillary line
- V6 — Midaxillary line
Which Leads "Look At" Which Part of the Heart?
| Leads | Territory | Artery |
|---|---|---|
| II, III, aVF | Inferior wall | RCA |
| I, aVL, V5, V6 | Lateral wall | LCx |
| V1–V4 | Anterior/Septal wall | LAD |
| aVR | Cavity view (right side) | — |
7. Normal Sinus Rhythm — What It Looks Like
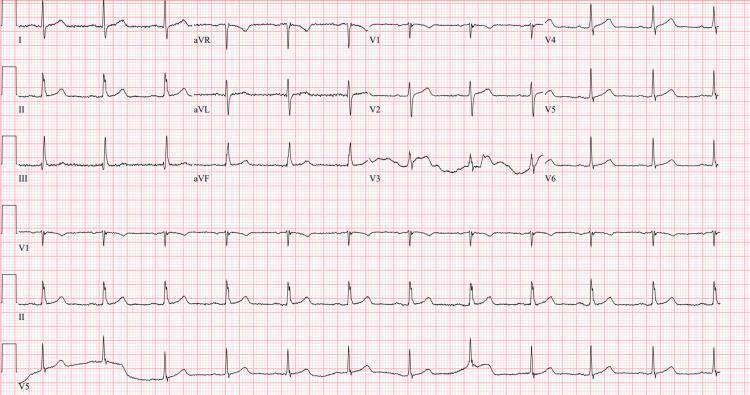
Fig: Normal sinus rhythm — regular P waves before every QRS, narrow QRS complexes, isoelectric ST segments, upright T waves in most leads, T inverted in aVR (normal).
Criteria for Normal Sinus Rhythm:
- Rate 60–100 bpm
- Regular rhythm (equal R–R intervals)
- P wave before every QRS, QRS after every P
- PR interval 0.12–0.20 s
- QRS duration < 0.12 s
- Normal axis (−30° to +90°)
8. The Systematic Approach to Reading Any ECG
Never eyeball an ECG randomly. Use this 7-step system every time:
| Step | What to Assess | What to Look For |
|---|---|---|
| 1 | Rate | 60–100 bpm = normal; <60 = brady; >100 = tachy |
| 2 | Rhythm | Regular? P before every QRS? |
| 3 | P wave | Present? Upright in II? One per QRS? |
| 4 | PR interval | 0.12–0.20 s? (prolonged = block) |
| 5 | QRS | Narrow (<0.12 s)? Wide = BBB or VT |
| 6 | ST segment | Elevated? Depressed? Flat (ischemia)? |
| 7 | T wave & QT | Inverted? QT prolonged? |
📅 ECG Learning Schedule — Day by Day
This is a structured 4-week plan that takes you from complete beginner to confident ECG reader. Each day = ~30–45 minutes of focused study + practice.
🗓️ Week 1 — The Foundation
| Day | Topic | What to Do |
|---|---|---|
| Day 1 (Sat) | Why ECGs exist + cardiac anatomy basics | Read about the heart's chambers, valves, coronary arteries. Understand why electrical activity happens. |
| Day 2 (Sun) | Cardiac conduction system | SA node → AV node → His → Purkinje. Draw it from memory. Memorize what each part does. |
| Day 3 (Mon) | ECG paper + grid | Learn small box (0.04s) and large box (0.20s). Practice calculating heart rate from R–R intervals using the 300 rule. |
| Day 4 (Tue) | P wave, QRS complex | What generates each? Normal duration/amplitude. Practice identifying them on rhythm strips. |
| Day 5 (Wed) | T wave, U wave, intervals | PR interval, QRS duration, QT interval — normal ranges. Practice measuring with a ruler. |
| Day 6 (Thu) | Normal sinus rhythm | Identify all 7 criteria. Practice on 10 rhythm strips (use ECGwave-maven or Litfl). |
| Day 7 (Fri) | Week 1 Review + Quiz | Draw one complete cardiac cycle with all labels from memory. Do a self-quiz on intervals and waves. |
🗓️ Week 2 — The 12 Leads
| Day | Topic | What to Do |
|---|---|---|
| Day 8 (Sat) | 12-lead anatomy — limb leads | Learn I, II, III, aVR, aVL, aVF and what they "see." Draw Einthoven's triangle. |
| Day 9 (Sun) | 12-lead anatomy — chest leads V1–V6 | Memorize electrode positions on the chest (4th/5th ICS landmarks). |
| Day 10 (Mon) | Territory mapping | Which leads = inferior, lateral, anterior, septal. Correlate with coronary arteries (RCA, LAD, LCx). |
| Day 11 (Tue) | ECG axis — normal | Learn the hexaxial reference system. Normal axis = −30° to +90°. Quick method: Lead I + aVF trick. |
| Day 12 (Wed) | ECG axis — left and right deviation | LAD causes, RAD causes. Practice identifying axis from a 12-lead. |
| Day 13 (Thu) | R-wave progression | V1 (rS pattern) → V4–V5 (RS transition) → V6 (qR pattern). Poor R-wave progression = anterior MI clue. |
| Day 14 (Fri) | Week 2 Review | Read 5 normal 12-lead ECGs. Identify axis, territory mapping, R-wave progression for each. |
🗓️ Week 3 — Arrhythmias & Conduction Abnormalities
| Day | Topic | What to Do |
|---|---|---|
| Day 15 (Sat) | Sinus bradycardia & tachycardia | Rate criteria, causes, ECG appearance. |
| Day 16 (Sun) | Atrial arrhythmias — AF & flutter | AF: irregularly irregular, no P waves, fibrillatory baseline. Flutter: sawtooth P waves at 300/min. |
| Day 17 (Mon) | Heart blocks (AV blocks) | 1st degree (long PR), 2nd degree Mobitz I/II (dropped beats), 3rd degree (complete dissociation). |
| Day 18 (Tue) | Bundle branch blocks (BBB) | RBBB: rSR' in V1 ("bunny ears"), wide S in V6. LBBB: broad notched R in V5–V6, William Morrow mnemonic. |
| Day 19 (Wed) | Ventricular arrhythmias — PVCs, VT | PVC: wide bizarre QRS without P. VT: wide QRS tachycardia >100 bpm. |
| Day 20 (Thu) | Ventricular fibrillation + WPW | VF: chaotic, no recognizable QRS. WPW: delta wave, short PR. |
| Day 21 (Fri) | Week 3 Review + Arrhythmia Quiz | Do 10 arrhythmia strips (aim for 80%+ accuracy). |
🗓️ Week 4 — Ischemia, Hypertrophy & Clinical Integration
| Day | Topic | What to Do |
|---|---|---|
| Day 22 (Sat) | Ischemia vs. injury vs. infarction | T-wave changes (ischemia) → ST elevation (injury) → Q waves (infarction). The sequence explained. |
| Day 23 (Sun) | STEMI — territory localization | Inferior STEMI (II/III/aVF), Anterior STEMI (V1–V4), Lateral STEMI (I/aVL/V5–V6). Reciprocal changes. |
| Day 24 (Mon) | NSTEMI + UA | ST depression, T-wave inversion, no Q waves. Difference from STEMI. |
| Day 25 (Tue) | LVH + RVH | LVH: Sokolow-Lyon criteria (S in V1 + R in V5/V6 > 35 mm). RVH: right axis deviation, dominant R in V1. |
| Day 26 (Wed) | Electrolyte abnormalities on ECG | Hyper/hypokalemia (peaked T / U waves / wide QRS), hypercalcemia (short QT), hypocalcemia (long QT). |
| Day 27 (Thu) | Pericarditis + PE on ECG | Pericarditis: diffuse saddle-shaped ST elevation. PE: S1Q3T3 pattern, sinus tachycardia. |
| Day 28 (Fri) | Final Review + Full ECG Practice | Read 10 full 12-lead ECGs using all 7 steps systematically. Time yourself. Aim for 3–5 min per ECG. |
📚 Recommended Free Resources
| Resource | Best For |
|---|---|
| LITFL ECG Library | Comprehensive reference + cases |
| ECGwave-maven (Harvard) | Interactive practice strips |
| Auscultation Assistant | Rhythm practice |
| Dr. Smith's ECG Blog | Advanced STEMI cases |
| Clinical Electrocardiography — Goldberger | Best beginner textbook |
Tips for Retention
- Always use the 7-step system — never skip steps, even for "obvious" ECGs
- Read 1–2 ECGs daily after week 1 (even if just for 5 minutes)
- Draw waves from memory every few days — active recall beats passive reading
- Correlate with patients — whenever a patient gets an ECG, try to read it before the attending
- Flashcards work well for interval values and criteria (Anki is ideal)
*Sources: Harrison's Principles of Internal Medicine, 21st Ed.; Medical Physiology (Boron & Boulpaep); Fuster & Hurst's The Heart, 15th Ed.*Here's a summary of everything covered:
What You Got
ECG Basics (with pictures from Harrison's & medical literature):
- Cardiac conduction system — SA → AV → His → Purkinje, with labeled heart diagram
- ECG waveforms — P wave, QRS complex, T wave, U wave — what each represents physiologically
- Intervals & segments — PR, QRS, QT, ST with normal values and clinical meaning
- ECG paper — the 0.04s/0.20s grid rules, heart rate calculation (300 rule + table)
- 12-lead ECG — electrode placement photo, which leads view which territory, coronary artery correlation
- Normal sinus rhythm — full 12-lead example with criteria checklist
- Systematic 7-step reading method — use this every single time
28-Day Learning Schedule:
- Week 1 — Foundation (waves, intervals, normal sinus rhythm)
- Week 2 — The 12 leads (axis, territory, R-wave progression)
- Week 3 — Arrhythmias & conduction blocks (AF, heart block, BBB, VT)
- Week 4 — Clinical pathology (STEMI, ischemia, LVH, electrolytes, pericarditis)
Since today is Saturday, you start on Day 1 right now — cardiac anatomy and the conduction system. Good timing!
This is a shared conversation. Sign in to Orris to start your own chat.