
Monitoring of patient on ventilator topic in simple language with dictionary for hard words and medical terms
mechanical ventilator monitoring parameters settings
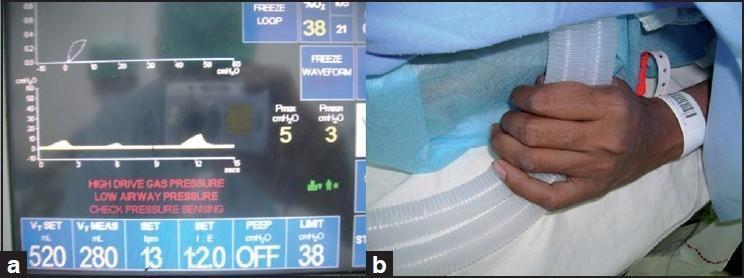
This composite clinical figure illustrates a case of intraoperative awareness and inadequate depth of anesthesia leading to mechanical ventilation complications. Figure 1a is a diagnostic image showing a ventilator monitor display with critical alarms: 'HIGH DRIVE GAS PRESSURE', 'LOW AIRWAY PRESSURE', and 'CHECK PRESSURE SENSING'. Ventilator parameters indicate a significant discrepancy between the set tidal volume (Vt SET: 520 mL) and measured tidal volume (Vt MEAS: 280 mL), with low maximum (Pmax: 5 cmH2O) and mean (Pmean: 3 cmH2O) airway pressures. Figure 1b is a clinical photograph demonstrating the cause of the ventilator abnormality: the patient's hand is visible beneath surgical drapes, tightly gripping and squeezing the corrugated anesthesia breathing circuit tubes. This physical obstruction, caused by the patient's involuntary motor response during light anesthesia, explains the altered pressure waveforms and volumes shown on the monitor. The image serves as an educational tool for anesthesiology, highlighting the importance of monitoring anesthetic delivery systems and recognizing physical causes for ventilator malfunctions.
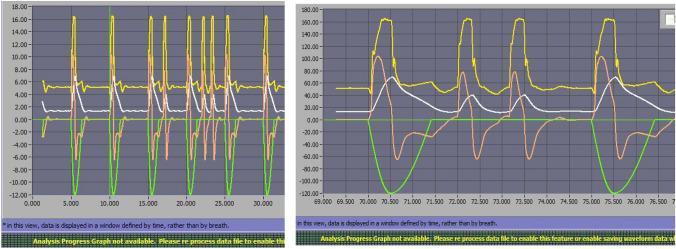
This diagnostic graphic displays mechanical ventilation waveforms from a Hamilton C3 ventilator during Pressure Support Ventilation (PSV 10), illustrating ventilator asynchrony under restrictive lung patterns with air leaks. Two side-by-side time-series graphs plot respiratory parameters: Airway Pressure (Paw, yellow), Delivered Volume (white), Flow (red/orange), and Muscular Pressure (green). The green line represents patient effort (negative deflection indicates inspiration), while the yellow and white lines represent ventilator response. The image specifically highlights 'Auto-triggering' (AT), a form of patient-ventilator asynchrony where the ventilator delivers a breath without an antecedent drop in muscular pressure. This is evident where peaks in airway pressure (yellow) and flow (red/orange) occur in the absence of a corresponding green negative deflection. The graph on the right provides a high-resolution view of these cycles, demonstrating the synchronization failure between the patient's intrinsic respiratory drive and the ventilator's trigger sensitivity (set at 1 lpm). This material is intended for advanced clinical education regarding mechanical ventilation monitoring and the identification of asynchronies in restrictive respiratory conditions.
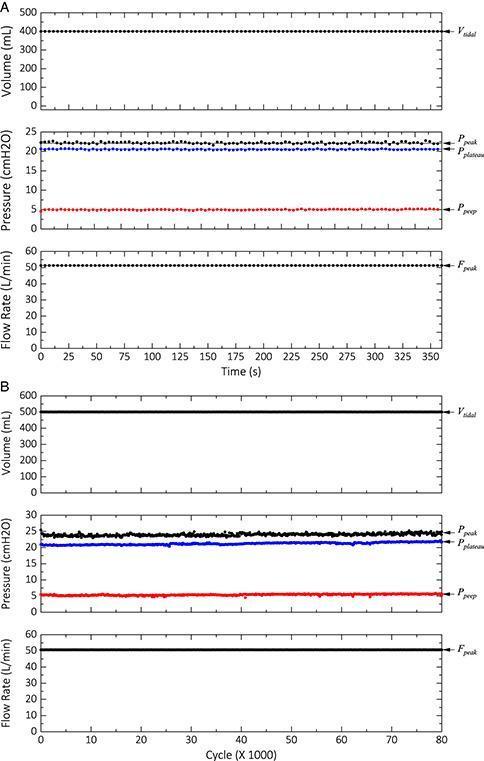
This infographic presents two sets of longitudinal data (A and B) evaluating the mechanical performance and reliability of a medical ventilator system across different time scales. Panel A illustrates the short-term performance over 100 cycles (approximately 350 seconds), showing consistent tidal volume (Vtidal) at 400 mL, peak inspiratory pressure (Ppeak) around 22 cmH2O, plateau pressure (Pplateau) at 20 cmH2O, and positive end-expiratory pressure (PEEP) stable at 5 cmH2O, with a peak flow rate (Fpeak) of 50 L/min. Panel B displays a long-term cycle life test over 80,000 cycles. While Vtidal (500 mL) and Fpeak (50 L/min) remain highly consistent, a subtle upward drift is visible in the PEEP, Ppeak, and Pplateau values toward the end of the 80,000-cycle period. These plots are essential for understanding ventilator mechanics, pulmonary compliance monitoring, and the durability of respiratory therapy equipment used in critical care settings, such as during COVID-19 management. The data demonstrates the precision and repeatability of respiratory parameters in a digitally controlled mechanical ventilation system.
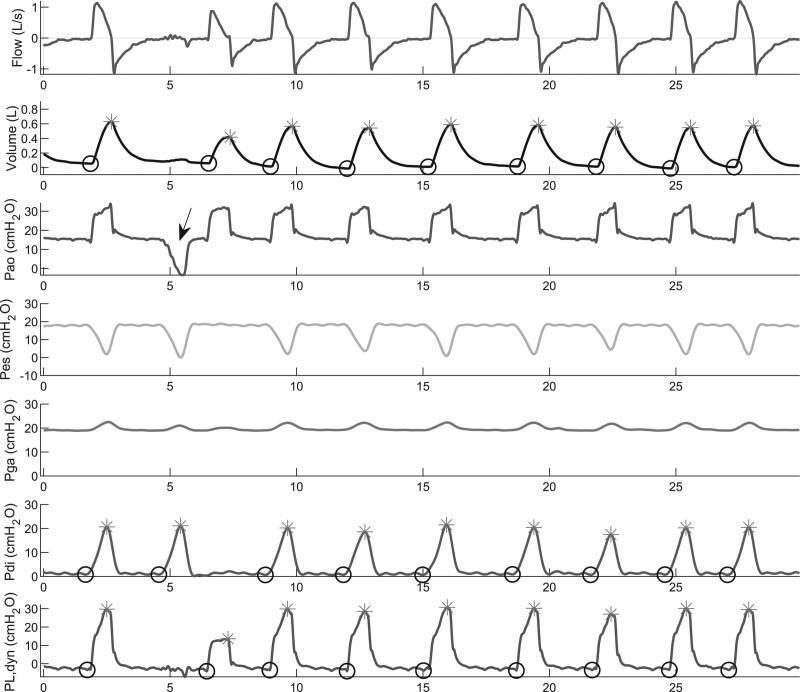
This physiological tracing displays a multi-panel time-series graph of respiratory mechanics during mechanical ventilation. The x-axis represents time in seconds (0-30s), while the y-axes represent various parameters: Flow (L/s), Volume (L), Airway Opening Pressure (Pao, cmH2O), Esophageal Pressure (Pes, cmH2O), Gastric Pressure (Pga, cmH2O), Transdiaphragmatic Pressure (Pdi, cmH2O), and Dynamic Transpulmonary Pressure (PL,dyn, cmH2O). The flow signal shows typical cyclical inspiratory and expiratory phases. The volume, Pdi, and PL,dyn panels feature automated markers: circles indicate the minimum values (end-expiration) and asterisks indicate maximum values (end-inspiration) for each breath. An end-expiratory occlusion maneuver is visible at approximately 5 seconds, indicated by a downward deflection in Pao and Pes to confirm catheter placement. This diagnostic visualization is used in critical care settings to assess patient-ventilator synchrony, work of breathing, and diaphragm-protective ventilation strategies by calculating pressure swings (delta) and transdiaphragmatic effort.
ventilator waveforms pressure volume flow monitoring ICU
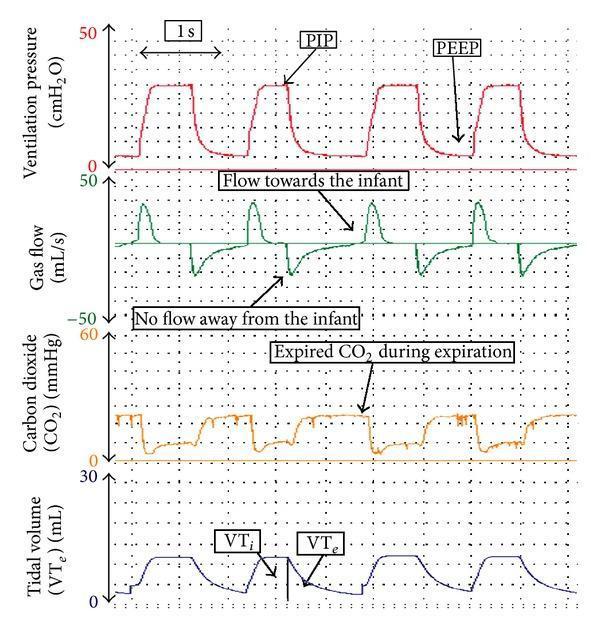
This diagnostic graphic displays synchronous respiratory function monitoring waveforms from a neonatal ventilator. It consists of four vertically stacked temporal traces: ventilation pressure (cmH2O), gas flow (mL/s), carbon dioxide (mmHg), and tidal volume (mL). The top pressure waveform illustrates positive pressure ventilation (PPV), identifying the Peak Inspiratory Pressure (PIP) during inflation and the Positive End-Expiratory Pressure (PEEP) at baseline. The gas flow waveform shows positive deflection during inspiration (flow towards the infant) and negative deflection during expiration (flow away). A capnography trace indicates expired CO2 peaks coinciding with the expiratory phase. The bottom waveform displays Tidal Volume (VT), showing increasing volume during inspiration (VTi) and decreasing volume during expiration (VTe). The return of the VT wave to the baseline without a residual offset indicates the absence of an endotracheal tube leak. This visualization is used in neonatal critical care to monitor lung mechanics, gas exchange efficiency, and circuit integrity during transport or bedside management.
![This Comparison Chart displays synchronized respiratory waveforms over 40 seconds during volume-controlled mechanical ventilation. From top to bottom, the four graphs include: 1) Flow [l/min], showing inspiratory and expiratory phases with zero-flow plateaus during maneuvers. 2) Airway pressure (Paw [cmH2O]), highlighting 'Set PEEP', 'PEEPtot' during an expiratory pause, and 'Airway plateau pressure' and 'Airway driving pressure' during an inspiratory hold. 3) Esophageal pressure (Pes [cmH2O]), used as a surrogate for pleural pressure, showing end-expiratory/end-inspiratory values and minor cardiac artifacts. 4) Transpulmonary pressure (Plung [cmH2O]), calculated as Paw minus Pes, illustrating 'Transpulmonary driving pressure' and 'End-inspiratory transpulmonary pressure'. The visual illustrates critical bedside monitoring for Acute Respiratory Distress Syndrome (ARDS), focusing on lung mechanics, intrinsic PEEP, and the prevention of ventilator-induced lung injury (VILI) by quantifying driving pressures and plateau pressures through hold maneuvers.](https://cdn.orris.care/cdss_images/pmc_clinical_VQA_1099345286f128aad8b7d3b682adc5a15737e3b737170091be774aed96d94975.jpg)
This Comparison Chart displays synchronized respiratory waveforms over 40 seconds during volume-controlled mechanical ventilation. From top to bottom, the four graphs include: 1) Flow [l/min], showing inspiratory and expiratory phases with zero-flow plateaus during maneuvers. 2) Airway pressure (Paw [cmH2O]), highlighting 'Set PEEP', 'PEEPtot' during an expiratory pause, and 'Airway plateau pressure' and 'Airway driving pressure' during an inspiratory hold. 3) Esophageal pressure (Pes [cmH2O]), used as a surrogate for pleural pressure, showing end-expiratory/end-inspiratory values and minor cardiac artifacts. 4) Transpulmonary pressure (Plung [cmH2O]), calculated as Paw minus Pes, illustrating 'Transpulmonary driving pressure' and 'End-inspiratory transpulmonary pressure'. The visual illustrates critical bedside monitoring for Acute Respiratory Distress Syndrome (ARDS), focusing on lung mechanics, intrinsic PEEP, and the prevention of ventilator-induced lung injury (VILI) by quantifying driving pressures and plateau pressures through hold maneuvers.
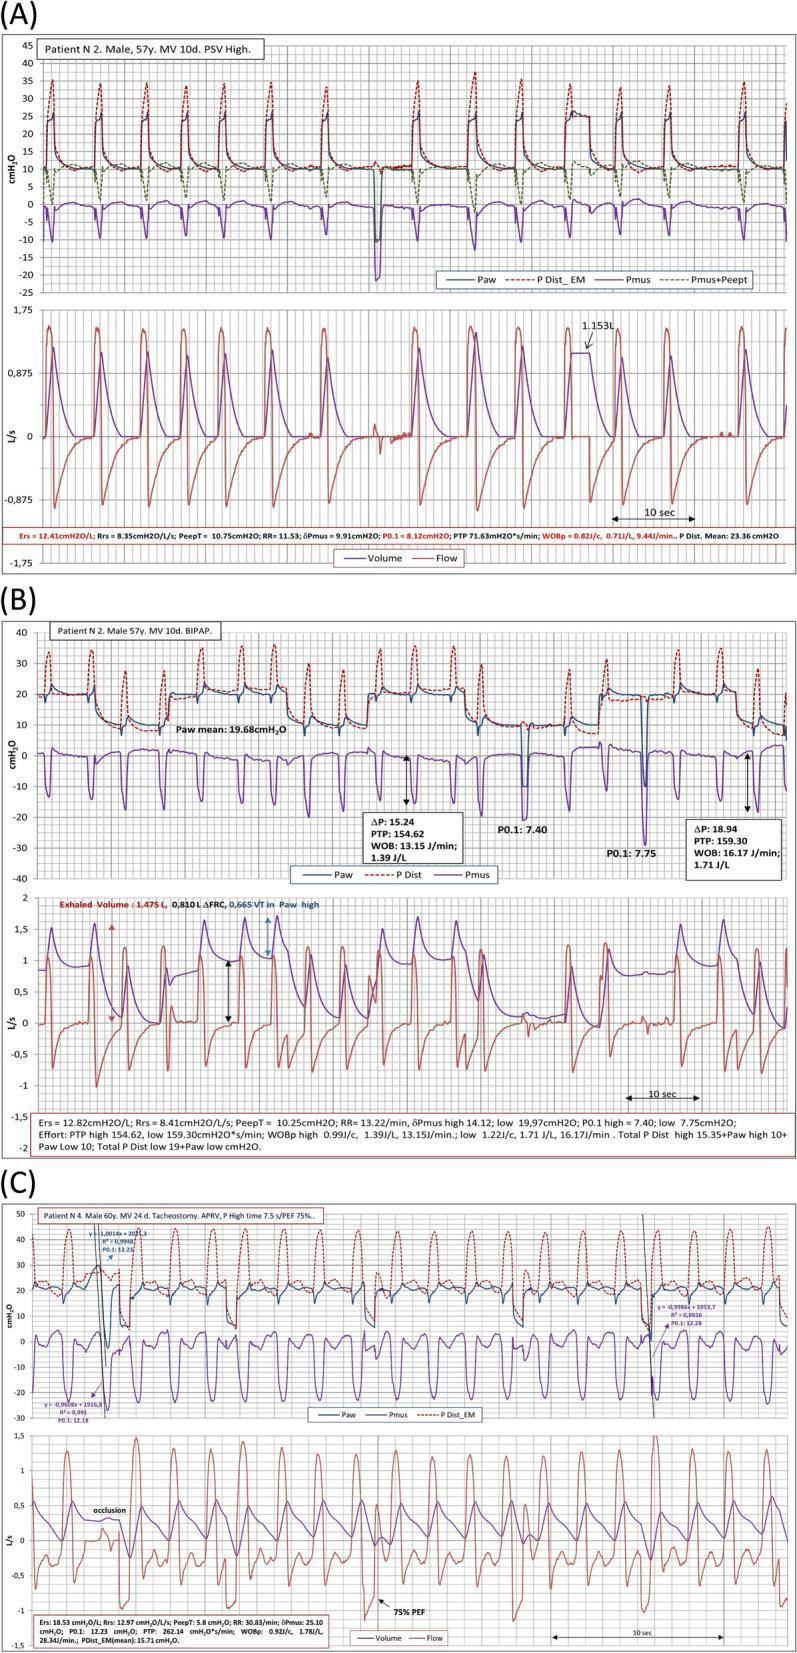
This physiological monitoring graphic displays mechanical ventilation waveforms across three distinct modes: Pressure Support Ventilation (PSV) in panel A, Biphasic Positive Airway Pressure (BIPAP) in panel B, and Airway Pressure Release Ventilation (APRV) in panel C. Each panel illustrates time-synced tracings of airway pressure (Paw), muscle pressure (Pmus), distending pressure (PDist_EM), flow (L/s), and tidal volume (L). In PSV (A), the waveforms show regular, patient-triggered breaths with stable tidal volumes and consistent Pmus deflections. BIPAP (B) reveals two levels of baseline pressure with significant spontaneous effort (negative Pmus) during the lower pressure phase, resulting in more variable flow and volume patterns. APRV (C) demonstrates prolonged high-pressure phases with brief releases, characterized by high respiratory drive and frequent, irregular spontaneous breathing efforts superimposed on the ventilator cycle. Key metrics provided below the graphs include respiratory system elastance (Ers), airway occlusion pressure (P0.1), and patient work of breathing (WOBp), used to analyze patient-ventilator synchrony and inspiratory effort in critically ill patients, such as those with COVID-19 ARDS.
Monitoring of a Patient on a Ventilator
📖 Dictionary of Hard Words (Quick Reference)
| Term | Simple Meaning |
|---|---|
| Mechanical ventilation | A machine (ventilator) that breathes for a patient who cannot breathe properly on their own |
| Tidal volume (VT) | The amount of air pushed into the lungs with each breath (like how much water fills a cup each pour) |
| PEEP (Positive End-Expiratory Pressure) | A small amount of pressure kept in the lungs even after breathing out, to keep the tiny air sacs open |
| Peak airway pressure (P-peak) | The highest pressure in the airway at the moment the breath is delivered |
| Plateau pressure (P-plateau) | The pressure in the lungs when air is held still for a moment; tells you about lung stiffness |
| Compliance | How easily the lungs stretch/expand. Low compliance = stiff lungs (hard to inflate) |
| Airway resistance | How much the airways fight against airflow (like a blocked pipe has high resistance) |
| SpO2 | Oxygen saturation measured by a small probe clipped to the finger (pulse oximetry reading) |
| SaO2 | Oxygen saturation measured from an arterial blood sample |
| FiO2 | Fraction of inspired oxygen - the percentage of oxygen in the air the ventilator gives (room air = 21%, pure oxygen = 100%) |
| PaO2 | Partial pressure of oxygen dissolved in the blood (from blood gas test) |
| PaCO2 | Partial pressure of carbon dioxide in the blood; tells you if the patient is breathing enough |
| ABG (Arterial Blood Gas) | A blood test taken from an artery to measure oxygen, carbon dioxide, and acid-base balance |
| pH | Measure of how acidic or basic the blood is (normal: 7.35-7.45) |
| Capnography / EtCO2 | A machine that measures carbon dioxide in the air the patient breathes out; confirms the breathing tube is in the right place |
| ARDS (Acute Respiratory Distress Syndrome) | A severe lung condition where fluid fills the air sacs, making breathing very difficult |
| VILI (Ventilator-Induced Lung Injury) | Damage to the lungs caused by the ventilator itself if pressures or volumes are too high |
| Weaning | Slowly reducing ventilator support so the patient can start breathing on their own again |
| Endotracheal tube (ETT) | A plastic tube inserted through the mouth into the windpipe to connect the patient to the ventilator |
| Pneumothorax | Air trapped outside the lung in the chest cavity, which can collapse the lung |
| Bronchospasm | Sudden tightening of the airway muscles, narrowing the airways (like in an asthma attack) |
| Atelectasis | Collapse of a part of the lung |
| Pulmonary edema | Fluid in the lungs |
| Heart rate (HR) | Number of heartbeats per minute |
| Blood pressure (BP) | Force of blood pushing on artery walls |
| Respiratory rate (RR) | Number of breaths per minute |
| NMB | Neuromuscular blockade - medications that paralyze muscles temporarily |
| Hemoglobin (Hgb) | The protein in red blood cells that carries oxygen |
What Is Ventilator Monitoring?
- Make sure the patient is getting enough oxygen
- Make sure carbon dioxide (CO2) is being removed properly
- Prevent lung injury from the machine itself
- Guide when the patient is ready to breathe on their own again (weaning)
The 5 Big Areas to Monitor
1. 🫁 Breathing (Respiratory) Parameters
A. Respiratory Rate (RR)
- Normal: 12-20 breaths per minute in adults
- Too fast: patient is working too hard or there is pain/anxiety
- Too slow: patient may be over-sedated
B. Tidal Volume (VT)
- The amount of air per breath
- Target: 6 mL per kg of ideal body weight (low-volume strategy to protect the lungs)
- Too much volume = risk of VILI (lung damage from over-stretching)
C. Airway Pressures - VERY IMPORTANT
- The highest pressure when air is being pushed in
- Normal target: < 40 cmH2O (centimeters of water)
- Measured by briefly holding the breath in the lungs
- Target: < 30 cmH2O
- Tells you about lung stiffness (compliance)
| What You See | What It Means |
|---|---|
| Both P-peak AND P-plateau are HIGH | Lungs are stiff (ARDS, fluid overload, pneumothorax, abdominal bloating) |
| P-peak is HIGH, P-plateau is NORMAL | Airways are blocked (bronchospasm, kinked tube, secretions) |
| Both P-peak AND P-plateau are LOW | Disconnected circuit - emergency! |
From Schwartz's Principles of Surgery: "In a large multicenter randomized trial of patients with ARDS, limiting plateau airway pressure to less than 30 cmH2O and tidal volume to less than 6 mL/kg reduced 28-day mortality by 22%."
D. PEEP (Positive End-Expiratory Pressure)
- Usually set between 5-10 cmH2O in most patients
- Higher in ARDS
- Keeps tiny air sacs (alveoli) from collapsing at end of breath-out
- Too much PEEP reduces blood return to the heart
E. FiO2 (Oxygen Level Being Given)
- Aim for lowest FiO2 that keeps SpO2 ≥ 94%
- High FiO2 for long periods can itself damage the lungs (oxygen toxicity)
2. 🩸 Oxygen Monitoring
A. Pulse Oximetry (SpO2)
- A small probe clipped to the finger or ear
- Shows oxygen saturation continuously
- Target: SpO2 94-98% in most patients (88-92% in COPD patients)
- Limitations: unreliable if the patient has poor blood circulation to fingers, carbon monoxide poisoning, nail polish, or very dark skin pigmentation
- Accuracy starts to drop below SpO2 of 92%
B. Arterial Blood Gas (ABG)
- A blood test from an artery (usually the wrist)
- Gold standard for checking both oxygen AND carbon dioxide
- Measured after starting ventilation and whenever settings are changed
- Checks: pH, PaO2, PaCO2, HCO3 (bicarbonate = the buffer for acid)
| Parameter | Normal Range |
|---|---|
| pH | 7.35 - 7.45 |
| PaO2 | 80 - 100 mmHg |
| PaCO2 | 35 - 45 mmHg |
| SpO2 | 94 - 98% |
3. 💨 Carbon Dioxide (CO2) Monitoring
Capnography / EtCO2 (End-Tidal CO2)
- A sensor measures CO2 in each breath the patient breathes out
- Normal EtCO2: 35-45 mmHg
- Very useful for:
- Confirming the breathing tube is in the right place (lung, not stomach) right after insertion
- Detecting if breathing circuit gets disconnected
- Detecting reduced blood flow to the lungs
- EtCO2 is usually slightly lower than PaCO2 from a blood test
From Miller's Anesthesia: "Capnography is the primary quantitative method to assess ventilation in the perioperative period. It is important for verifying endotracheal tube positioning and determining the integrity of the breathing circuit."
4. ❤️ Heart and Circulation (Cardiovascular) Monitoring
| Parameter | What to Watch For |
|---|---|
| Heart rate (HR) | Tachycardia (fast HR) = pain, anxiety, low oxygen |
| Blood pressure (BP) | Hypotension (low BP) = too much PEEP, too high sedation, pneumothorax |
| SpO2 waveform | A good waveform shape means good blood flow |
| Urine output | Indirectly shows how well the heart is pumping; target > 0.5 mL/kg/hour |
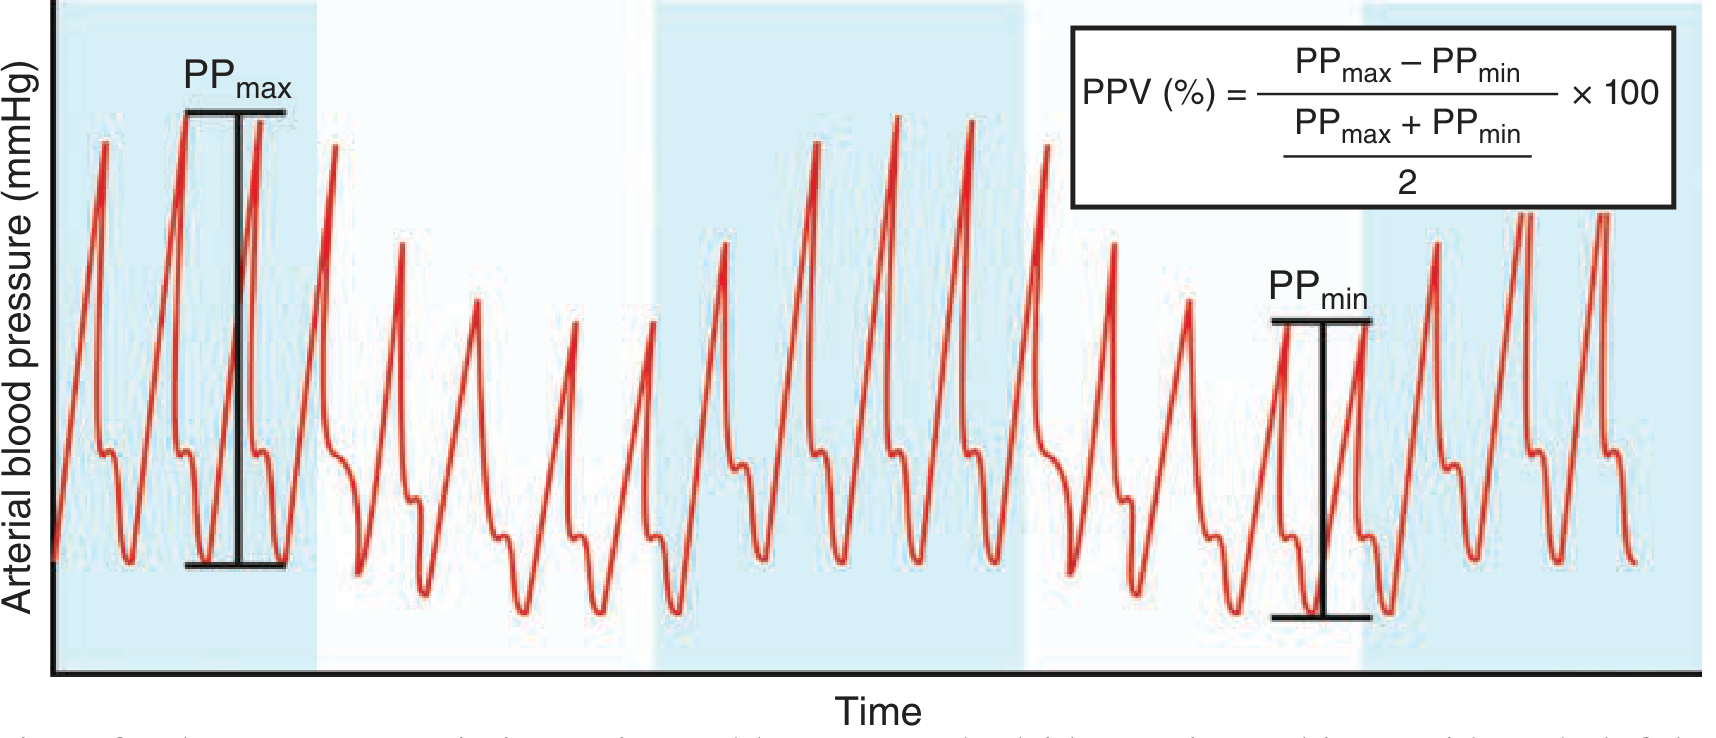
Pulse Pressure Variation (PPV)
- Measured from the arterial line waveform on the bedside monitor
- Tells you if the patient will respond to giving IV fluids
- Only useful in patients who are fully sedated/paralyzed and have no spontaneous breathing
5. 🔍 Patient-Ventilator Interaction (Synchrony)
- Patient looks distressed, muscles of the neck straining
- The ventilator waveforms look irregular or "double-triggered"
- The patient is breathing against the machine
🚨 Ventilator Alarms - What They Mean
| Alarm | Likely Cause | Action |
|---|---|---|
| High pressure alarm | Secretions, bronchospasm, kinked tube, patient biting tube, pneumothorax | Suction airway, check tube position, assess chest |
| Low pressure / disconnect alarm | Tube fell out, circuit disconnected | Check connections, look at patient |
| Low SpO2 | Low oxygen, tube in wrong position | Increase FiO2, check tube, listen to chest |
| High respiratory rate | Patient distress, pain, fever, anxiety | Treat the cause, consider sedation |
| Low tidal volume | Leak in circuit, patient breathing too shallow | Check for leaks, adjust settings |
🩺 Physical Assessment - Do Not Forget the Basics!
- Chest movement: Should be equal on both sides. Unequal = pneumothorax or tube in wrong position
- Breath sounds: Listen with stethoscope - absent sounds = blocked tube, pneumothorax
- Color: Pale/bluish (cyanosis) = not getting enough oxygen
- Agitation or distress: May mean pain, fear, low oxygen, or fighting the ventilator
- Secretions: Suctioning needed if crackles/gurgles heard
🔄 Weaning Monitoring
- SpO2: Should stay ≥ 94%
- Respiratory rate: Should stay < 30 breaths/min
- Heart rate and BP: Should stay stable
- Patient's work of breathing: Should not look exhausted
- ABG: Check after 30-60 minutes of breathing trial
Summary Table: Key Numbers to Remember
| Parameter | Target |
|---|---|
| SpO2 | 94-98% |
| FiO2 | Lowest to achieve SpO2 target |
| Tidal Volume | 6 mL/kg ideal body weight |
| Plateau Pressure | < 30 cmH2O |
| Peak Pressure | < 40 cmH2O |
| PEEP | 5-10 cmH2O (higher in ARDS) |
| EtCO2 | 35-45 mmHg |
| Respiratory Rate | 12-20/min |
| pH (ABG) | 7.35-7.45 |
| PaCO2 | 35-45 mmHg |
| Urine output | > 0.5 mL/kg/hour |
Key Takeaway Points
- Ventilator monitoring involves watching the machine numbers AND the patient at the same time
- Airway pressures (especially plateau pressure) must be kept low to avoid lung injury
- Pulse oximetry (SpO2) gives continuous but imperfect oxygen information - confirm with ABG when needed
- Capnography (EtCO2) is essential to confirm tube position and monitor ventilation
- High pressure alarm needs immediate response - check for blockage or pneumothorax
- Low pressure alarm = possible disconnection = emergency
- The goal of all monitoring is safe, protective ventilation and timely weaning when the patient improves
Hard words terminology for this topic
📘 Full Terminology Dictionary
Ventilator Monitoring - All Hard Words Explained Simply
🔵 SECTION 1: The Machine & Setup
| Term | Pronunciation | Simple Meaning |
|---|---|---|
| Mechanical Ventilator | ven-TIL-ay-tor | A machine that breathes for a patient who cannot breathe properly on their own |
| Endotracheal Tube (ETT) | en-do-TRAY-kee-al | A plastic tube inserted through the mouth, down the throat, into the windpipe (trachea) to connect the patient to the ventilator |
| Tracheostomy Tube | tray-kee-OS-toh-mee | A tube inserted through a surgical hole in the neck directly into the windpipe; used for long-term ventilation |
| Breathing Circuit | - | The set of tubes and connectors between the ventilator machine and the patient's airway |
| Cuff | - | A small balloon at the tip of the ETT that inflates to seal the airway and prevent leaking of air or secretions |
| Cuff Pressure | - | The pressure inside that small balloon; should be kept at 20-30 cmH2O - too high injures the trachea, too low causes leaks |
| Humidifier | hyoo-MID-ih-fy-er | A device that adds moisture to the air the ventilator delivers, so the airways do not dry out |
| HME (Heat Moisture Exchanger) | - | A small filter placed at the patient's mouth end of the circuit that traps warmth and moisture from exhaled air and returns it on the next breath |
🔵 SECTION 2: Ventilator Modes
| Term | Simple Meaning |
|---|---|
| Ventilator Mode | The "program" set on the ventilator that decides how and when breaths are delivered |
| AC (Assist-Control) | The machine gives a full breath every time the patient tries to breathe, AND gives backup breaths if the patient does not try |
| SIMV (Synchronized Intermittent Mandatory Ventilation) | The machine gives a set number of breaths per minute and lets the patient breathe extra breaths on their own in between |
| Pressure Support Ventilation (PSV) | The machine gives a boost of pressure every time the patient tries to breathe, but the patient controls the rate and depth |
| CPAP (Continuous Positive Airway Pressure) | Constant gentle pressure throughout breathing; patient breathes entirely on their own |
| APRV (Airway Pressure Release Ventilation) | A special mode that keeps the lungs inflated most of the time, with brief releases; used in severe ARDS |
| Volume-Controlled Ventilation (VCV) | The machine delivers a fixed volume of air with each breath regardless of the pressure needed |
| Pressure-Controlled Ventilation (PCV) | The machine delivers air up to a fixed pressure limit; the volume may vary |
🔵 SECTION 3: Key Ventilator Settings (Numbers You Set)
| Term | Abbreviation | Simple Meaning | Normal Value |
|---|---|---|---|
| Tidal Volume | VT | The amount of air pushed in with each breath | 6 mL/kg ideal body weight |
| Respiratory Rate | RR or f | Number of breaths the machine gives per minute | 12-20/min |
| FiO2 (Fraction of Inspired Oxygen) | FiO2 | The percentage of oxygen in the air delivered (like choosing between regular air and pure oxygen) | 0.21 (21%) = room air; 1.0 (100%) = pure oxygen |
| PEEP (Positive End-Expiratory Pressure) | PEEP | A small pressure kept in the lungs at the end of each breath-out to keep tiny air sacs open | 5-10 cmH2O |
| Inspiratory Time (Ti) | Ti | How long the machine takes to push air in | 0.8-1.2 seconds |
| I:E Ratio | I:E | The ratio of time spent breathing in vs. breathing out (normally 1:2 - breathe out twice as long as in) | 1:2 |
| Trigger Sensitivity | - | How hard the patient must try before the ventilator detects their effort and delivers a breath | Adjusted per patient |
| Flow Rate | - | How fast air is pushed into the lungs during the breath | 40-60 L/min |
🔵 SECTION 4: Pressure Measurements (Most Critical!)
| Term | Simple Meaning | Normal/Target |
|---|---|---|
| Peak Airway Pressure (P-peak) | The highest pressure in the airway at the moment of breath delivery; depends on lung stiffness AND airway resistance | < 40 cmH2O |
| Plateau Pressure (P-plateau) | Pressure measured when air is held still in the lungs for a moment (no flow); reflects lung stiffness alone | < 30 cmH2O |
| Driving Pressure | Plateau pressure minus PEEP; shows how much stress each breath puts on the lungs | < 15 cmH2O |
| Mean Airway Pressure (MAP) | Average pressure in the airways across the whole breath cycle | Varies; higher = better oxygenation but affects circulation |
| Auto-PEEP / Intrinsic PEEP | Accidental build-up of pressure in the lungs because the patient did not fully breathe out before the next breath came in; common in asthma/COPD | Should be zero; detected by expiratory hold maneuver |
| Transpulmonary Pressure | The pressure difference between the inside of the lungs and the outside (chest wall); true measure of stress on lung tissue | Ideally < 25 cmH2O at end-inspiration |
| CPAP level | The continuous pressure applied to keep the airway open in spontaneously breathing patients | 5-10 cmH2O |
🔵 SECTION 5: Lung Mechanics Terms
| Term | Simple Meaning |
|---|---|
| Compliance | How easily the lungs stretch. High compliance = easy to inflate (normal). Low compliance = stiff lungs (bad - seen in ARDS, pneumonia) |
| Static Compliance | Compliance measured when there is no airflow (calculated from plateau pressure); true measure of lung stiffness |
| Dynamic Compliance | Compliance calculated during actual airflow; affected by both lung stiffness AND airway resistance |
| Airway Resistance | How much the airways resist airflow; increased in bronchospasm, secretions, kinked tube |
| Work of Breathing (WOB) | The effort a patient must use to breathe; if too high on ventilator support, the patient will get exhausted |
| Dead Space | Parts of the airway where air travels but NO gas exchange happens (like air in the tube and trachea); wasted ventilation |
| Alveoli | The millions of tiny air sacs in the lungs where oxygen enters the blood and CO2 leaves |
| Atelectasis | Collapse of alveoli or a section of the lung; they stick together like a deflated balloon |
| Recruitment | Re-opening collapsed alveoli by temporarily increasing airway pressure |
🔵 SECTION 6: Oxygenation Terms
| Term | Abbreviation | Simple Meaning | Normal Value |
|---|---|---|---|
| Oxygen Saturation | SpO2 / SaO2 | The percentage of hemoglobin carrying oxygen. SpO2 = measured by finger probe; SaO2 = measured from blood | SpO2: 94-98% |
| Partial Pressure of Oxygen in Arterial Blood | PaO2 | Dissolved oxygen in arterial blood; measured from ABG | 80-100 mmHg |
| Hemoglobin (Hgb) | Hgb | The protein inside red blood cells that carries oxygen; like a taxi for oxygen | 12-16 g/dL |
| Oxyhemoglobin | - | Hemoglobin that IS carrying oxygen (bright red) | |
| Deoxyhemoglobin | - | Hemoglobin that is NOT carrying oxygen (dark red/bluish) | |
| Hypoxemia | hy-pox-EE-mee-ah | Low oxygen level in the blood (PaO2 < 60 mmHg or SpO2 < 90%) | |
| Hypoxia | hy-POX-ee-ah | Not enough oxygen reaching the body's tissues and cells | |
| Cyanosis | sy-ah-NO-sis | Bluish color of lips, skin, or fingernails due to low oxygen | |
| Oxygen Delivery (DO2) | DO2 | Total amount of oxygen delivered to all body tissues per minute; depends on heart output, hemoglobin, and SpO2 | |
| Pulse Oximetry | - | Non-invasive monitoring using a finger probe with two light colors to measure SpO2 continuously | |
| P/F Ratio (PaO2/FiO2) | P/F | A number that tells you how well the lungs are exchanging oxygen compared to how much oxygen is being given. Normal > 400; ARDS < 300 | > 300 normal |
| Carboxyhemoglobin | - | Hemoglobin bound to carbon monoxide (from smoke/fire); the pulse oximeter cannot tell this apart from normal oxygen-carrying hemoglobin - a dangerous limitation | |
| Methemoglobin | - | An abnormal form of hemoglobin that cannot carry oxygen; caused by certain drugs |
🔵 SECTION 7: Ventilation (CO2) Terms
| Term | Abbreviation | Simple Meaning | Normal Value |
|---|---|---|---|
| Carbon Dioxide | CO2 | A waste gas produced by every cell in the body; must be removed by breathing out | |
| Partial Pressure of CO2 in Arterial Blood | PaCO2 | The amount of CO2 dissolved in arterial blood; measured by ABG | 35-45 mmHg |
| End-Tidal CO2 | EtCO2 / PETCO2 | CO2 measured in the last bit of air breathed out; closely mirrors PaCO2 in healthy lungs | 35-45 mmHg |
| Capnography | cap-NOG-ra-fee | The monitoring device/graph that displays EtCO2 in real time; the waveform shows every breath cycle | |
| Capnogram | - | The wave-shaped graph produced by capnography; a normal capnogram is a flat square-wave shape | |
| Hypercapnia | hy-per-CAP-nee-ah | Too much CO2 in the blood (PaCO2 > 45 mmHg); means the patient is not breathing out enough | |
| Hypocapnia | hy-po-CAP-nee-ah | Too little CO2 in the blood (PaCO2 < 35 mmHg); means the patient is breathing too fast/too much | |
| Permissive Hypercapnia | - | A deliberate strategy of allowing CO2 to rise slightly above normal to avoid using high ventilator pressures that would damage the lungs (common in ARDS) | |
| Minute Ventilation (MV) | MV | Total air moved in and out per minute = Tidal Volume × Respiratory Rate | 5-8 L/min |
🔵 SECTION 8: Blood Gas (ABG) Terms
| Term | Abbreviation | Simple Meaning | Normal Value |
|---|---|---|---|
| Arterial Blood Gas | ABG | A blood test taken from an artery (usually the wrist) that measures oxygen, CO2, acid-base balance | |
| pH | pH | Measurement of how acidic or alkaline the blood is | 7.35 - 7.45 |
| Acidosis | as-id-OH-sis | Blood is too acidic (pH < 7.35); can be from lungs (respiratory) or kidneys/metabolism | |
| Alkalosis | al-ka-LOH-sis | Blood is too alkaline/basic (pH > 7.45) | |
| Respiratory Acidosis | - | Acidosis caused by too much CO2 (not breathing out enough); PaCO2 > 45 mmHg | |
| Metabolic Acidosis | - | Acidosis caused by a body chemistry problem (infection, kidney failure, lactic acid buildup) | |
| Bicarbonate (HCO3-) | HCO3 | The body's main chemical buffer to balance acid; kidneys control this | 22-26 mEq/L |
| Base Deficit / Base Excess | BD/BE | Shows how much the body chemistry is off-balance; a large negative base excess signals severe metabolic acidosis | 0 ± 2 mEq/L |
| Phlebotomy | fleh-BOT-oh-mee | The act of drawing blood from a patient |
🔵 SECTION 9: Lung Disease Terms
| Term | Simple Meaning |
|---|---|
| ARDS (Acute Respiratory Distress Syndrome) | Severe lung failure where fluid fills the air sacs; lungs become stiff, oxygen drops dangerously; P/F ratio < 300 |
| Pneumonia | Infection of the lung tissue causing inflammation and fluid in the air sacs |
| Pneumothorax | Air trapped in the chest cavity outside the lungs, which can collapse the lung; a ventilator emergency |
| Hemothorax | Blood in the chest cavity |
| Pleural Effusion | Fluid collection around the lungs (in the pleural space) |
| Bronchospasm | Sudden tightening of the airway muscles, narrowing the airways; like an asthma attack |
| Pulmonary Edema | Fluid in the lungs, making it hard to breathe; common in heart failure |
| Lobar Atelectasis | Collapse of a whole lobe (section) of a lung |
| COPD (Chronic Obstructive Pulmonary Disease) | Long-term lung disease (e.g., from smoking) causing narrowed, damaged airways |
| Aspiration | Accidentally inhaling food, liquid, or stomach contents into the lungs |
🔵 SECTION 10: Complications from the Ventilator
| Term | Abbreviation | Simple Meaning |
|---|---|---|
| VILI (Ventilator-Induced Lung Injury) | VILI | Lung damage caused by the ventilator itself - from too-high pressure or too-large volumes |
| Barotrauma | baro-TRAW-mah | Lung injury from too-high pressure (baro = pressure); can cause pneumothorax |
| Volutrauma | vol-yoo-TRAW-mah | Lung injury from too-large volumes over-stretching the alveoli |
| Atelectrauma | - | Repeated collapse and re-opening of alveoli with each breath, tearing the delicate tissue |
| Biotrauma | - | Release of inflammatory chemicals into the bloodstream due to lung injury from the ventilator |
| VAP (Ventilator-Associated Pneumonia) | VAP | A lung infection that develops in a patient because of being on the ventilator (bacteria travel down the tube) |
| Patient-Ventilator Dyssynchrony | - | When the patient's own breathing effort does not match what the ventilator is doing; the patient "fights" the machine |
| Auto-triggering | - | The ventilator falsely detects a patient breath and delivers an unwanted breath (triggered by heart movement or leaks) |
🔵 SECTION 11: Weaning Terminology
| Term | Simple Meaning |
|---|---|
| Weaning | The gradual process of reducing ventilator support so the patient learns to breathe more on their own |
| Liberation from Ventilator | Fully removing the patient from the ventilator and taking out the breathing tube |
| SBT (Spontaneous Breathing Trial) | A test where the ventilator is set to minimal or zero support for 30-120 minutes to see if the patient can breathe alone |
| Extubation | Removing the endotracheal tube from the patient's airway when they no longer need it |
| Re-intubation | Putting the breathing tube back in because the patient failed extubation and cannot breathe safely alone |
| RSBI (Rapid Shallow Breathing Index) | A number = Respiratory rate ÷ Tidal Volume; if < 105, patient more likely to succeed at breathing alone |
| Sedation Vacation / Daily Awakening | Temporarily stopping sedation medicines so the patient wakes up and can be assessed for readiness to wean |
🔵 SECTION 12: Monitoring Device Terms
| Term | Simple Meaning |
|---|---|
| Pulse Oximeter | The finger probe that measures SpO2 and heart rate using light beams |
| Capnograph | The machine that measures CO2 in exhaled air in real time |
| Arterial Line (A-line) | A thin tube placed inside an artery (usually wrist) for continuous beat-to-beat blood pressure monitoring AND easy blood sampling |
| Central Venous Catheter (CVC) | A long tube placed in a large vein in the neck or chest to give medications and fluids, and to measure central venous pressure |
| CVP (Central Venous Pressure) | Pressure in the large vein entering the heart; gives information about fluid status |
| Swan-Ganz Catheter | A special catheter floated through the heart into the lung artery to measure heart pressures and cardiac output; used in complex cases |
| Cardiac Output (CO) | The total amount of blood the heart pumps per minute (normal: 4-8 L/min) |
| Bedside Monitor | The screen at the patient's bedside showing continuous heart rate, rhythm, blood pressure, SpO2, and respiratory rate |
| Ventilator Waveforms | The wavy lines on the ventilator screen showing pressure, flow, and volume with each breath in real time |
| EIT (Electrical Impedance Tomography) | A new imaging method that uses electrodes around the chest to show which parts of the lungs are getting air; no radiation |
| NIRS (Near-Infrared Spectroscopy) | Uses light to measure oxygen levels in tissues (like the brain or muscles) through the skin |
🔵 SECTION 13: General ICU Terms Related to Ventilator Care
| Term | Simple Meaning |
|---|---|
| ICU (Intensive Care Unit) | The hospital ward where the most critically ill patients are cared for; highest nurse-to-patient ratio |
| Sedation | Medicines given to make the patient sleepy and comfortable on the ventilator |
| Analgesia | Pain relief medicines |
| Neuromuscular Blockade (NMB) | Medicines that temporarily paralyze all muscles; used when the patient is fighting the ventilator so severely that the lungs cannot be protected any other way |
| Prone Positioning | Turning the patient face-down on the bed; opens up collapsed parts of the lungs in severe ARDS; improves oxygenation dramatically |
| Suctioning | Using a thin tube to vacuum out secretions (mucus) from the airway through the ETT |
| Lung-Protective Ventilation | A ventilator strategy using low tidal volumes and low pressures to avoid causing lung injury; the standard of care |
| Fluid Responsiveness | Whether giving IV fluids will increase the heart's output; assessed by pulse pressure variation |
| Homeostasis | The body maintaining stable, normal internal conditions (temperature, pH, oxygen, etc.) |
| Phlebotomy | The act of drawing blood samples from the patient |
| Perfusion | Blood flow reaching the organs and tissues |
Quick Recall - The Most Important Terms at a Glance
SpO2      = oxygen % in blood (finger probe)
FiO2      = % oxygen the ventilator gives
PEEP      = pressure to keep lungs open at end of breath
VT        = volume of each breath
P-peak    = highest pressure in airway per breath
P-plateau = lung stiffness pressure (must be < 30)
EtCO2     = CO2 at end of breath-out
ABG       = blood test for oxygen, CO2, and acid-base
ARDS      = severe lung failure with stiff, wet lungs
VILI      = lung damage caused by the ventilator itself
SBT       = breathing test to see if patient can go without ventilator
Weaning   = gradually reducing machine support
VAP       = lung infection from being on the ventilator
Please explain the patient ventilator interaction with simple language
patient ventilator dyssynchrony waveform asynchrony types
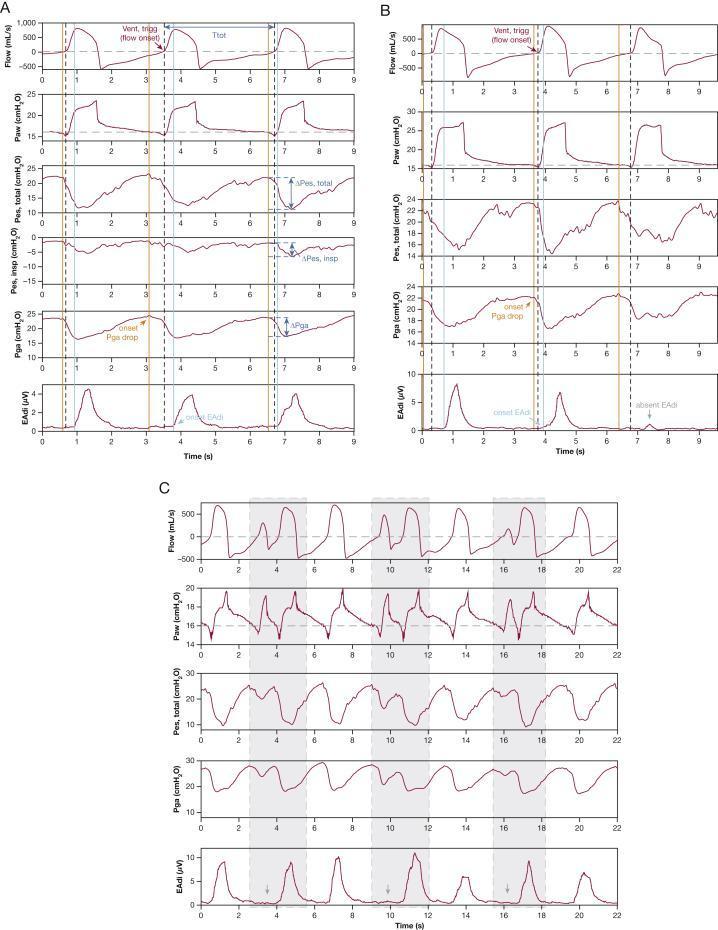
This physiological waveform set demonstrates expiratory muscle relaxation-induced ventilator triggering (ERIT) in a sedated patient. Panels A, B, and C show multi-channel tracings including Flow, airway pressure (Paw), total esophageal pressure (Pes,total), gastric pressure (Pga), and electrical activity of the diaphragm (EAdi). Key features illustrated include: - Temporal dissociation: In Panel A, the orange line indicates the onset of Pga drop (expiratory muscle relaxation) which precedes the black dashed line (ventilator triggering), while the light blue line (EAdi onset) occurs after triggering. This confirms the ventilator is triggered by abdominal muscle relaxation rather than neural inspiratory effort. - Dyssynchrony patterns: Panel B shows ERIT breaths without subsequent diaphragm activity (absent EAdi). Panel C highlights a 2:1 double-triggering pattern (gray areas) where partial expiratory relaxation triggers a first breath without EAdi, followed by complete relaxation triggering a second breath with true inspiratory effort. - Clinical significance: The diagrams provide a diagnostic methodology for identifying non-diaphragmatic ventilator triggering using esophageal and gastric pressure monitoring in critical care settings.
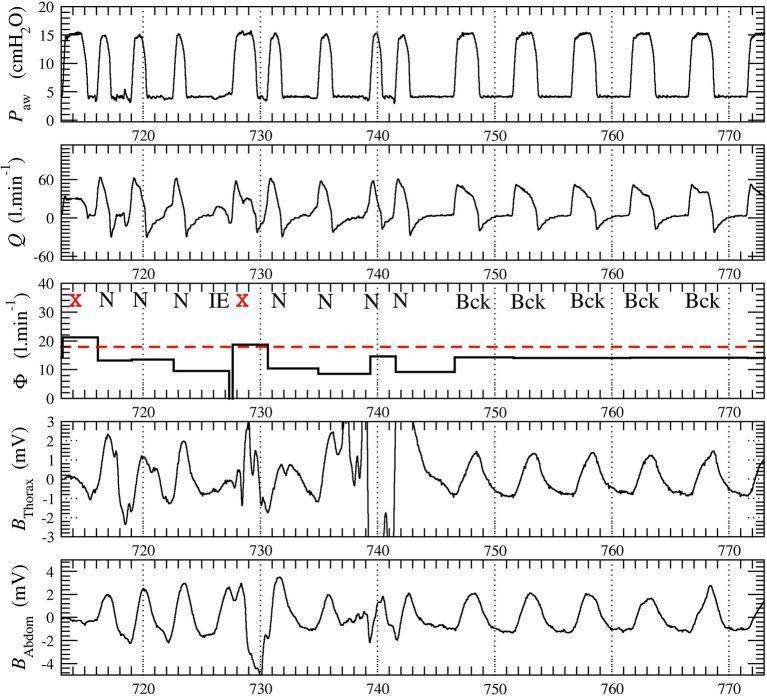
This physiological monitoring waveform chart displays data from a patient receiving non-invasive ventilation (NIV). The display includes five synchronized panels over a 60-second time series (seconds 710 to 775). Top panel: Airway pressure (Paw) measured in cmH2O, showing cyclical ventilatory support peaking at approximately 15 cmH2O. Second panel: Airflow (Q) in l/min, depicting inspiratory and expiratory fluctuations ranging from -30 to 60 l/min. Third panel: Total leakage (Φ) in l/min, shown as a stepwise average per cycle with a red dashed threshold line at 18 l/min; cycles exceeding this (marked with 'X') indicate excessive leakage and turbulent flow. The panel also includes automated event annotations: 'N' (Normal), 'IE' (Ineffective Effort), and 'Bck' (Background/different physiological state). Bottom panels: Thoracic (Bthorax) and abdominal (Babdom) respiratory belt signals in millivolts (mV), demonstrating chest wall and abdominal excursions. These signals are used to assess patient-ventilator synchrony and identify asynchrony events like ineffective efforts or autotriggering. This content is used for educating healthcare providers on ventilator waveform analysis and automated scoring algorithms for patient-ventilator interaction.
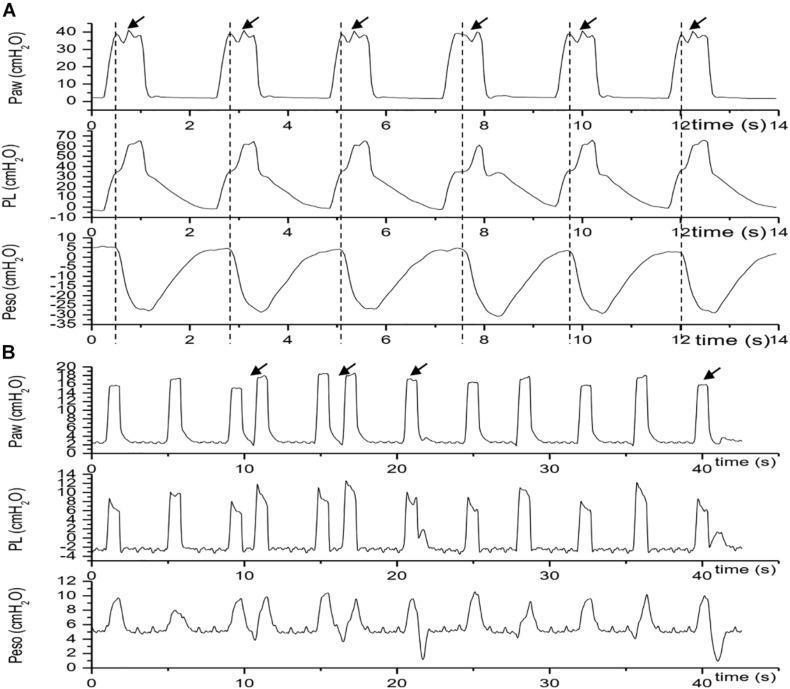
This diagnostic graphic displays respiratory waveform traces illustrating reverse trigger (RT) phenomena in patients under mechanical ventilation. The figure is divided into two panels, A and B, each showing three concurrent pressure-time waveforms: airway pressure (Paw), transpulmonary pressure (PL), and esophageal pressure (Peso), measured in cmH2O. Panel A demonstrates 'stable' reverse triggering with a 1:1 entrainment ratio over 14 seconds. Vertical dashed lines mark the initiation of mechanical breaths, followed by arrows indicating subsequent negative fluctuations in Peso, which represent delayed patient effort (reverse triggering) causing secondary pressure rises in Paw and PL. Panel B depicts 'unstable' reverse triggering over a 40-second period, characterized by irregular entrainment ratios and erratic Peso fluctuations. These traces serve as a clinical tool for identifying patient-ventilator dyssynchrony, specifically the mid-cycle and late RT phenotypes. The visual highlights how reflex-mediated diaphragmatic contraction follows a ventilator-delivered breath, potentially increasing transpulmonary pressure and the risk of lung injury.
This diagnostic graphic displays mechanical ventilation waveforms from a Hamilton C3 ventilator during Pressure Support Ventilation (PSV 10), illustrating ventilator asynchrony under restrictive lung patterns with air leaks. Two side-by-side time-series graphs plot respiratory parameters: Airway Pressure (Paw, yellow), Delivered Volume (white), Flow (red/orange), and Muscular Pressure (green). The green line represents patient effort (negative deflection indicates inspiration), while the yellow and white lines represent ventilator response. The image specifically highlights 'Auto-triggering' (AT), a form of patient-ventilator asynchrony where the ventilator delivers a breath without an antecedent drop in muscular pressure. This is evident where peaks in airway pressure (yellow) and flow (red/orange) occur in the absence of a corresponding green negative deflection. The graph on the right provides a high-resolution view of these cycles, demonstrating the synchronization failure between the patient's intrinsic respiratory drive and the ventilator's trigger sensitivity (set at 1 lpm). This material is intended for advanced clinical education regarding mechanical ventilation monitoring and the identification of asynchronies in restrictive respiratory conditions.
ineffective effort double triggering flow starvation ventilator asynchrony
This diagnostic graphic displays mechanical ventilation waveforms from a Hamilton C3 ventilator during Pressure Support Ventilation (PSV 10), illustrating ventilator asynchrony under restrictive lung patterns with air leaks. Two side-by-side time-series graphs plot respiratory parameters: Airway Pressure (Paw, yellow), Delivered Volume (white), Flow (red/orange), and Muscular Pressure (green). The green line represents patient effort (negative deflection indicates inspiration), while the yellow and white lines represent ventilator response. The image specifically highlights 'Auto-triggering' (AT), a form of patient-ventilator asynchrony where the ventilator delivers a breath without an antecedent drop in muscular pressure. This is evident where peaks in airway pressure (yellow) and flow (red/orange) occur in the absence of a corresponding green negative deflection. The graph on the right provides a high-resolution view of these cycles, demonstrating the synchronization failure between the patient's intrinsic respiratory drive and the ventilator's trigger sensitivity (set at 1 lpm). This material is intended for advanced clinical education regarding mechanical ventilation monitoring and the identification of asynchronies in restrictive respiratory conditions.
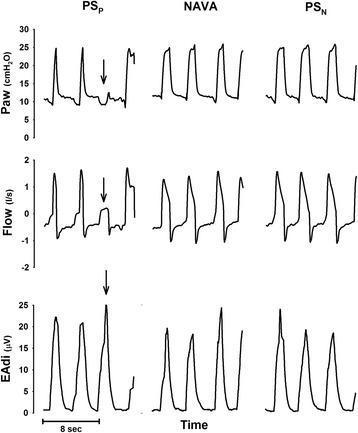
This physiological tracing compares three mechanical ventilation modes in a human patient: pneumatically triggered pressure support (PSP), neurally adjusted ventilatory assist (NAVA), and neurally controlled pressure support (PSN). The data is organized in a 3x3 grid across columns (modes) and rows (parameters). The vertical axes measure airway pressure (Paw in cmH2O), respiratory flow (l/s), and electrical activity of the diaphragm (EAdi in μV) as a function of time. In the PSP column, an arrow identifies an 'ineffective effort' where a significant spike in EAdi (diaphragmatic contraction) fails to trigger a corresponding ventilator-supported airway pressure rise, demonstrating patient-ventilator asynchrony. In contrast, the NAVA and PSN columns show improved synchrony, where neural signals (EAdi) directly correlate with the onset of pressure delivery. PSN shows a more rapid pressurization profile compared to the proportional ramp-up seen in NAVA. This comparison illustrates how neural-based triggering and control mechanisms can mitigate triggering delays and missed efforts common in traditional pneumatic pressure support.
This physiological waveform set demonstrates expiratory muscle relaxation-induced ventilator triggering (ERIT) in a sedated patient. Panels A, B, and C show multi-channel tracings including Flow, airway pressure (Paw), total esophageal pressure (Pes,total), gastric pressure (Pga), and electrical activity of the diaphragm (EAdi). Key features illustrated include: - Temporal dissociation: In Panel A, the orange line indicates the onset of Pga drop (expiratory muscle relaxation) which precedes the black dashed line (ventilator triggering), while the light blue line (EAdi onset) occurs after triggering. This confirms the ventilator is triggered by abdominal muscle relaxation rather than neural inspiratory effort. - Dyssynchrony patterns: Panel B shows ERIT breaths without subsequent diaphragm activity (absent EAdi). Panel C highlights a 2:1 double-triggering pattern (gray areas) where partial expiratory relaxation triggers a first breath without EAdi, followed by complete relaxation triggering a second breath with true inspiratory effort. - Clinical significance: The diagrams provide a diagnostic methodology for identifying non-diaphragmatic ventilator triggering using esophageal and gastric pressure monitoring in critical care settings.
🤝 Patient-Ventilator Interaction
Explained Simply - With Full Dictionary
The Big Idea: Think of It Like Dancing
- Both partners must move at the same time
- In the same direction
- With the same speed and force
📖 Mini Dictionary for This Topic
| Word | Simple Meaning |
|---|---|
| Synchrony | Working together in perfect time - patient and machine breathing as one |
| Dyssynchrony | Mismatch - patient and machine are out of step with each other |
| Trigger | The signal that tells the ventilator "the patient wants to breathe NOW - send air!" |
| Trigger Sensitivity | How sensitive the machine is to detecting the patient's breathing effort |
| Neural Inspiration | The brain's own signal to the breathing muscles to take a breath |
| Diaphragm | The main breathing muscle, a dome-shaped muscle under the lungs |
| Inspiratory Effort | The work/force the patient puts in when trying to breathe in |
| Flow | The speed at which air moves into or out of the lungs (like water speed in a pipe) |
| Cycling | The moment the ventilator STOPS sending air and switches to letting the patient breathe out |
| Auto-PEEP / Intrinsic PEEP (PEEPi) | Air trapped in the lungs because not enough time to breathe out fully; makes it harder to trigger the next breath |
| Ineffective Effort | The patient tries to breathe but the ventilator does NOT respond and no breath is delivered |
| Double Triggering | The ventilator delivers TWO breaths back-to-back when the patient only wanted ONE |
| Auto-triggering | The ventilator sends a breath even when the patient did NOT try to breathe |
| Flow Starvation | The ventilator gives air too slowly for what the patient needs; the patient is "hungry" for more air |
| Premature Cycling | The machine stops the breath too early before the patient has finished breathing in |
| Delayed Cycling | The machine keeps sending air even after the patient has already started to breathe out |
| Reverse Triggering | A breath delivered by the machine accidentally causes the diaphragm to contract - like a reflex |
| Work of Breathing (WOB) | How hard the breathing muscles are working |
| Respiratory Drive | How strong the brain's command is to breathe; depends on CO2 levels, oxygen levels, pain, fever |
| NAVA (Neurally Adjusted Ventilatory Assist) | An advanced ventilator mode that directly reads the diaphragm's electrical signal to perfectly match patient effort |
| Pressure Support (PS) | A ventilator mode where the machine gives a boost of pressure every time the patient tries to breathe |
| Assist-Control (AC) | A mode where every patient effort gets a full machine breath; backup breaths given if patient stops trying |
| Esophageal Pressure (Pes) | Pressure measured in the food pipe (esophagus); used as a proxy for the pressure around the lungs |
| EAdi | Electrical Activity of the Diaphragm - a signal from electrodes that shows when the breathing muscle is actually firing |
| Sedation | Medications to make the patient sleepy and comfortable |
| Neuromuscular Blockade | Medicines that paralyze all muscles - the patient makes ZERO effort; the machine does 100% of the work |
PART 1: How a Normal Breath Works on a Ventilator
PHASE 1 → TRIGGER    (How does the breath START?)
PHASE 2 → FLOW       (How does the breath CONTINUE?)
PHASE 3 → CYCLING    (How does the breath END?)
Phase 1 - TRIGGER (Starting the Breath)
- The patient's brain sends a signal to the diaphragm: "Contract! Breathe in!"
- The diaphragm contracts and creates a tiny drop in pressure (or a small flow of air) in the breathing circuit
- The ventilator DETECTS this signal
- The ventilator responds: "Patient wants a breath - I will deliver one NOW"
- Pressure trigger - the patient must suck hard enough to drop circuit pressure by a set amount (e.g., -2 cmH2O)
- Flow trigger - the patient must create a small flow change (e.g., 2 L/min); this is faster and easier, so most modern ventilators use this
Think of it like a doorbell: the patient presses the button (effort), the machine rings (delivers breath). If the doorbell is too stiff - the patient cannot press it hard enough (missed trigger). If the doorbell is too sensitive - it rings on its own from vibration (auto-trigger).
Phase 2 - FLOW (Delivering the Breath)
- If the patient has a strong breathing drive (e.g., from fever, pain, hypoxia) but the machine gives air too slowly → Flow Starvation - like drinking through a very thin straw when very thirsty
- If the machine gives too much air too fast → the patient may feel overwhelmed and fight back
Phase 3 - CYCLING (Ending the Breath)
- In Pressure Support mode: the ventilator stops when flow drops to a set percentage of the peak (e.g., 25% of peak flow)
- In Volume Control mode: the ventilator stops when the set volume has been delivered
- In Pressure Control mode: the ventilator stops after a set time
PART 2: What is Dyssynchrony? (When Things Go Wrong)
From Fishman's Pulmonary Diseases and Disorders: "Patient-ventilator dyssynchrony occurs when the trigger, flow, and/or cycling of a mechanical breath is not in time agreement with the initiation and termination of a patient's neural inspiration - or if the magnitude of mechanical assist does not respond to the patient's respiratory demand."
🔴 TYPE 1: Trigger Dyssynchrony
A) Ineffective Effort (Missed Trigger)
- Patient tries to breathe in
- The ventilator does NOT detect the effort
- No breath is delivered despite patient working hard
- Auto-PEEP (trapped air makes it very hard to lower the pressure enough to trigger)
- Trigger sensitivity set too low (machine is "deaf")
- Very weak patient muscles (neuromuscular disease)
B) Auto-triggering (False Trigger)
- The ventilator delivers a breath even though the patient did NOT try to breathe
- The machine was fooled by something else
- Water condensation in the circuit causing vibration
- Cardiac oscillations (heartbeat causes tiny pressure changes in the chest)
- Circuit leaks
- Trigger sensitivity set too high (machine is "too sensitive")
C) Delayed Triggering
- Patient tries to breathe
- Machine detects it LATE - there is a noticeable gap before air arrives
🔴 TYPE 2: Flow Dyssynchrony
Flow Starvation
- Patient has a very high breathing drive and wants air to come in fast
- Machine delivers air too slowly
- Patient keeps pulling trying to get more air
- Pressure dips DOWN during the breath (instead of rising smoothly) because the patient is sucking harder than the machine delivers
- The pressure curve has a "scooped out" dip in the middle
🔴 TYPE 3: Cycling Dyssynchrony
A) Premature Cycling (Machine stops too EARLY)
- The machine stops the breath before the patient has finished breathing in
- Patient is still wanting more air but the machine has already stopped
- The patient then "double triggers" - tries to get another breath immediately
B) Delayed Cycling / Late Cycling (Machine stops too LATE)
- Machine keeps delivering air even AFTER the patient's diaphragm has stopped contracting
- Patient is already trying to breathe OUT but machine is still pushing air IN
C) Reverse Triggering
- The patient is deeply sedated or even on muscle relaxants
- The ventilator-delivered breath STIMULATES the diaphragm to contract as a reflex
- So the machine delivers breath → causes the patient's diaphragm to fire AFTER the machine breath starts
PART 3: Why Does Dyssynchrony Matter?
| Consequence | Explanation |
|---|---|
| Increased work of breathing | Patient's muscles work harder than needed - leads to exhaustion and fatigue |
| Lung injury (VILI) | Double triggering and large tidal volumes over-stretch alveoli |
| Disrupt sleep | Uncomfortable breathing disrupts the rest needed for recovery |
| Prolonged ventilation | Patients who fight the ventilator take longer to be weaned off it |
| More sedation needed | To stop fighting, more sedatives are given → more complications |
| Respiratory muscle damage | Either wasting from too little work OR exhaustion from too much work |
PART 4: How to Detect Dyssynchrony at the Bedside
Look at the Patient:
- Neck muscles (sternocleidomastoid) visibly straining
- Nose flaring
- Belly moving inward on inspiration (paradoxical breathing)
- Patient appears distressed or agitated
- Respiratory rate counted manually is much higher than what the monitor shows
Look at the Ventilator Screen Waveforms:
1. PRESSURE waveform (cmH2O vs. time)
2. FLOW waveform (L/min vs. time)
3. VOLUME waveform (mL vs. time)
| What You See on Waveform | What It Means |
|---|---|
| Pressure dips DOWN during inspiration | Flow starvation - patient pulling harder than machine delivers |
| Two breaths back-to-back very fast | Double triggering |
| Extra small downward dips that produce NO breath | Ineffective efforts |
| Breaths occurring with no apparent patient effort | Auto-triggering |
| Pressure rises suddenly at end of inspiration | Late cycling - patient fighting to breathe out |
PART 5: How to FIX Dyssynchrony
Step 1 - Find the Cause
Patient fighting → Is it pain? → Give analgesia
             → Is it anxiety? → Adjust sedation
             → Is it wrong ventilator settings? → Fix settings
             → Is it the underlying disease getting worse? → Treat disease
Step 2 - Adjust Ventilator Settings
| Problem | Fix |
|---|---|
| Ineffective efforts / missed triggers | Reduce trigger threshold (make it more sensitive); treat auto-PEEP; add extrinsic PEEP to offset PEEPi |
| Auto-triggering | Make trigger LESS sensitive; fix circuit leaks; drain water from circuit |
| Flow starvation | Increase peak inspiratory flow rate; change to Pressure Support or Pressure Control mode |
| Double triggering | Increase inspiratory time so the machine matches the patient's longer effort; reduce cycling sensitivity |
| Late cycling (in Pressure Support) | Increase cycle sensitivity (machine stops sooner when flow drops); shorten inspiratory time |
| Premature cycling | Decrease cycle sensitivity (machine waits longer before stopping) |
Step 3 - Sedation and Analgesia
- A patient in pain breathes faster and harder → fights the machine
- Light, goal-directed sedation is preferred (not deeply sedating the patient)
- The ABCDEF bundle in ICU care includes daily assessment of sedation needs
Step 4 - Consider Advanced Modes
| Mode | How It Helps |
|---|---|
| NAVA (Neurally Adjusted Ventilatory Assist) | Reads the diaphragm's own electrical signal (EAdi) directly; machine fires the INSTANT the diaphragm fires; near-perfect synchrony |
| PAV+ (Proportional Assist Ventilation Plus) | Machine adjusts its support in real time proportional to how hard the patient is working |
PART 6: Special Situation - Auto-PEEP and Triggering
- Patient has COPD or asthma → airways are narrow → air gets trapped in lungs
- Before the patient can trigger the next breath, they must first "overcome" the trapped air pressure (auto-PEEP)
- If auto-PEEP = 8 cmH2O, the patient must generate 8 cmH2O of effort JUST to reach zero pressure - THEN another 2 cmH2O to trigger
- Total effort needed = 10 cmH2O - exhausting!
- Apply extrinsic PEEP (set PEEP on the ventilator) to about 75-80% of the auto-PEEP level
- This "meets the patient halfway" - so triggering effort is reduced dramatically
- Allow more time for expiration (longer expiratory time, slower respiratory rate)
Summary: The 3 Phases and Their Problems in One Table
| Phase | Normal | Problem | Name | Fix |
|---|---|---|---|---|
| Trigger | Patient effort → machine detects → breath starts | Patient effort → NO breath | Ineffective Effort | Adjust sensitivity, treat auto-PEEP |
| Trigger | Patient effort → machine detects → breath starts | No patient effort → breath given | Auto-triggering | Reduce sensitivity, fix leaks |
| Flow | Air arrives at the speed patient needs | Machine too slow for patient demand | Flow Starvation | Increase flow, change mode |
| Cycling | Machine stops when patient finishes breathing | Machine stops too early | Premature Cycling → Double Triggering | Extend Ti, adjust cycle threshold |
| Cycling | Machine stops when patient finishes breathing | Machine stops too late | Late Cycling | Increase cycle sensitivity |
The Golden Rule
The ventilator should serve the patient's breathing - not force the patient to serve the ventilator's settings.
- Every time the patient wants a breath, they get one (no missed triggers)
- The breath is the right size, at the right speed
- The breath ends when the patient is done
- The patient's muscles work just enough - not too hard, not too little
Also the graphs shown in this topic explain in simple language in short way
📊 The Ventilator Graphs - Simply Explained
First: Understanding the Basics of Any Ventilator Graph
↑ (Y-axis) = the VALUE being measured
             (pressure, flow, or volume)

→ (X-axis) = TIME passing (left to right)

Each "hill" or "valley" = ONE breath cycle
┌─────────────────────────────┐
│  Graph 1: PRESSURE          │  (cmH2O)
├─────────────────────────────┤
│  Graph 2: FLOW              │  (L/min)
├─────────────────────────────┤
│  Graph 3: VOLUME            │  (mL)
└─────────────────────────────┘
📖 Quick Dictionary
| Word | Simple Meaning |
|---|---|
| cmH2O | "Centimeters of water" - the unit for pressure in ventilator settings. Like measuring how deep water is. |
| L/min | Liters per minute - how fast air flows |
| mL | Milliliters - the amount/volume of air |
| Inspiration | Breathing IN (air going INTO lungs) |
| Expiration | Breathing OUT (air leaving lungs) |
| Baseline | The zero line - when nothing is happening |
| Waveform | The shape of the line on a graph |
| Peak | The highest point of a wave |
| Trough | The lowest dip of a wave |
| PIP | Peak Inspiratory Pressure - highest pressure during a breath |
| PEEP | The small background pressure kept in lungs at all times |
| Pplateau | Plateau pressure - pressure when air is held still in lungs |
| Driving pressure | Pplateau minus PEEP - the stress each breath puts on the lung |
| Tidal volume (VT) | The amount of air in one breath |
| EtCO2 | CO2 measured in the last bit of exhaled air |
GRAPH 1: The PRESSURE Graph
What It Looks Like (Normal - Volume Control Mode):
Pressure
(cmH2O)
   │
30 │      ┌───┐         ┌───┐
   │      │   │         │   │
20 │      │   │         │   │
   │      │   │         │   │
10 │      │   │         │   │
   │      │   │         │   │
 5 │──────┘   └─────────┘   └──── ← PEEP line
   │
   └──────────────────────────────→ Time
         Breath 1    Breath 2
What Each Part Means:
| Part of the Graph | What It Represents | Simple Meaning |
|---|---|---|
| The flat bottom line | PEEP | The "resting pressure" always kept in the lungs - even between breaths |
| The sharp rise up | Inspiration beginning | Machine pushing air in |
| The flat top (plateau) | Breath hold / plateau | Air is sitting still - this is the "Pplateau" |
| The drop back down to PEEP | Expiration | Air flowing out |
| The HEIGHT of the peak | Peak Inspiratory Pressure (PIP) | How hard the machine is pushing |
Normal Pressure Graph - Reading It:
        PIP (Peak)
         ↓
    ┌────┐
    │    │←── Plateau pressure (flat top)
    │    │
    │    │    ← "Driving pressure" = height from PEEP to plateau
────┘    └──── ← PEEP (baseline)
Simple summary: The pressure graph shows a box-like shape that goes UP when air is pushed in, stays FLAT at the top for a moment (plateau), then DROPS back down to the PEEP level when air comes out.
⚠️ Abnormal Pressure Graphs - What They Tell You:
1. High Peak + High Plateau = Stiff Lungs
     Very HIGH peak AND plateau
          ↓↓
    ┌──────────┐
    │          │  ← Both top AND sides are very tall
    │          │
────┘          └────
2. High Peak + Normal Plateau = Blocked Airway
     Very HIGH spike
          ↓
    ┌─┐
    │ │── then drops quickly to normal plateau
    │ └───┐
    │     │
────┘     └────
3. Low/Flat Pressure = Circuit Disconnected
    Almost flat line - no rise at all
─────────────────────────────────────
4. "Scooped Out" Dip During Inspiration = Flow Starvation
    Expected shape:        What you actually see:
    ┌────┐                 ┌──
    │    │                 │   \
    │    │       →         │    \  ← Scoop! Patient
    │    │                 │     \ pulling harder
────┘    └────             ┘      └────
5. Pressure Spike at End of Inspiration = Late Cycling
              ↗ extra spike here
    ┌────────┐
    │        │╲  ← Patient trying to breathe OUT while
    │        │  \ machine is still pushing IN
────┘         └────
GRAPH 2: The FLOW Graph
What It Looks Like (Normal):
Flow
(L/min)
   │
+60│   /\         /\
   │  /  \       /  \
   │ /    \     /    \
 0 │/      \   /      \   ← Zero line
   │        \_/        \_/
-30│
   └──────────────────────→ Time
      ↑↑      ↑↑
   Insp.   Expir.
What Each Part Means:
| Part | What It Is | Simple Meaning |
|---|---|---|
| Above zero line (positive) | Inspiratory flow | Air going INTO the lungs |
| Below zero line (negative) | Expiratory flow | Air coming OUT of the lungs |
| The peak above zero | Peak inspiratory flow | Maximum speed of air going in |
| Returns to zero | End of expiration | Lungs have fully emptied |
| Does NOT return to zero | Auto-PEEP is present! | Air is still trapped - lungs did not finish emptying before the next breath came |
The Most Important Rule of the Flow Graph:
The flow line must return to ZERO before the next breath starts. If it does NOT reach zero → there is auto-PEEP (air trapping) - a danger sign.
NORMAL:                    AUTO-PEEP:
     /\        /\               /\        /\
    /  \      /  \             /  \      /  \
───/    \    /    \──────    ─/    \    /    \──
         \  /                       \  /
          \/  ← touches zero         \/← does NOT touch zero!
                                         (still flowing when next breath starts)
⚠️ Abnormal Flow Graphs:
1. Flow curve does not return to baseline = Auto-PEEP
           ╱╲             ╱╲
          ╱  ╲           ╱  ╲
─────────╱    ╲         ╱    ╲
               ╲       ╱
                ╲─────╱  ← Never reaches zero = air trapped!
2. Double peak on expiratory flow = Secretions
Expiratory flow (below zero):
    ╲  /╲   ← Two bumps instead of smooth curve
     \/  \/     = mucus or secretions in airway
GRAPH 3: The VOLUME Graph
What It Looks Like (Normal):
Volume
(mL)
   │
500│      ┌──────┐           ┌──────┐
   │     /│      │\         /│      │\
   │    / │      │ \       / │      │ \
   │   /  │      │  \     /  │      │  \
 0 │──/   │      │   \───/   │      │   \──
   │
   └──────────────────────────────────────→ Time
      ↑              ↑
    Breath in      Breath out
What Each Part Means:
| Part | Meaning |
|---|---|
| Rising line | Air is going IN - volume building up |
| Peak (flat top) | Maximum volume reached = tidal volume |
| Falling line | Air is going OUT - volume decreasing |
| Returns to zero | Lungs fully emptied |
| Does NOT return to zero | Air trapping! Volume never fully leaves |
Simple summary: The volume graph is like watching a cup fill up (breath in) and then empty out (breath out). If the cup never fully empties before the next pour - that is auto-PEEP.
GRAPH 4: The CAPNOGRAPHY Graph (EtCO2 / CO2 Waveform)
What It Looks Like (Normal):
CO2
(mmHg)
   │
40 │                ┌────┐           ┌────┐
   │               /│    │\         /│    │\
   │              / │    │ \       / │    │ \
   │             /  │    │  \     /  │    │  \
 0 │────────────/   │    │   \───/   │    │   \──
   │
   └──────────────────────────────────────────→ Time
       Inhale   Exhale peak      Inhale   Exhale
| Phase | On Graph | Meaning |
|---|---|---|
| Phase I | Flat at zero | Breathing IN - fresh air with no CO2 |
| Phase II | Rapid rise | Breath starting to come out - CO2 begins to appear |
| Phase III | Flat plateau at the top | Alveolar air coming out - steady CO2 level |
| End of Phase III | The very end of plateau = EtCO2 reading | This number is the EtCO2 value |
| Phase IV | Sharp drop to zero | Breathing IN again - CO2 washed out |
⚠️ Abnormal Capnography Shapes:
1. Flat line at zero = No breath being detected
───────────────────────── ← No CO2 at all
2. Slanted/sloping plateau (shark fin shape) = Obstructed airways
      /────────────────/  ← Upsloping plateau (not flat)
     /
────/
3. Sudden drop to zero mid-breath = Disconnection
┌───┐
│   │
│   └────────────────────  ← Suddenly zero
4. Baseline not returning to zero = CO2 rebreathing
   ┌────┐  ┌────┐
   │    │  │    │
5 ─┘    └──┘    └──  ← Baseline above zero
GRAPH 5: The DYSSYNCHRONY Graphs Explained
Graph A: Ineffective Effort
Flow:     ___/\___/\___/\___    ← 3 machine breaths

EAdi:     _/\_/\_/\_/\_/\_     ← 4 diaphragm efforts
           ↑
           This effort produced NO breath (missed!)
Graph B: Auto-triggering
Flow:     ___/\___/\___/\___   ← Machine breaths

EAdi:     ___________/\___     ← Only ONE real effort

             ↑↑
     These breaths happened with NO patient effort!
     Machine was fooled.
Graph C: Double Triggering
Flow:     /\/\     /\/\     ← Two breaths very close together
             ↑
        Barely any gap
        between them

Volume:  Goes VERY HIGH on double breaths (dangerous!)
Graph D: Late Cycling (Delayed Cycling)
Flow (expiratory):
                  \_____│  ← Active effort going negative
                         \ (patient pushing OUT while
                          \ machine still pushing IN)

Pressure:
    ┌─────────────────╮  ← Pressure spike at end
    │                 │╲   as patient fights to exhale
────┘                 │  └────
Graph E: Auto-PEEP on Flow Graph
NORMAL:                        AUTO-PEEP:
Expiratory flow:               Expiratory flow:

   ╲                              ╲
    ╲                              ╲
     ╲                              ╲___________
      ╲___                                     ↑
           ↑                         Never reaches zero!
       Reaches zero
       (lungs empty)
All 3 Graphs Together - One Breath Cycle
Time →          |← Inhale →|← Exhale →|

PRESSURE:   ────┌──────────┐
            PEEP│          │PEEP
                └──────────┘

FLOW:           /\
               /  \
──────────────/    \──────
                    \    /
                     \__/  (negative = exhale)

VOLUME:          /─────\
                /       \
───────────────/         \────────────
              ↑           ↑
            Builds up   Empties out
- Pressure goes UP when air is pushed in → then back to PEEP
- Flow goes ABOVE zero (positive) when air goes IN → below zero (negative) when air goes OUT
- Volume BUILDS as air enters → drops to zero when lungs empty
Quick Reference: "What Shape = What Problem" Table
| Graph | Shape You See | What It Means |
|---|---|---|
| Pressure | Both peak AND plateau very high | Stiff lungs (ARDS, pneumothorax) |
| Pressure | High peak, normal plateau | Blocked airway (bronchospasm, secretions) |
| Pressure | Flat line (nothing) | Disconnected! Emergency! |
| Pressure | Scooped dip during inspiration | Flow starvation (machine too slow) |
| Pressure | Spike at end of inspiration | Late cycling (patient fighting to exhale) |
| Flow | Does not return to zero | Auto-PEEP (air trapping) |
| Flow | Double bump on expiration | Secretions in airway |
| Volume | Does not return to zero | Air trapping |
| Capnography | Flat at zero | Tube in wrong place / cardiac arrest |
| Capnography | Slanted upsloping plateau | Bronchospasm / obstructed airways |
| Capnography | Baseline above zero | Patient rebreathing CO2 |
| All 3 together | Two breaths back-to-back with barely any gap | Double triggering |
| All 3 together | Small dips in pressure with NO delivered breath | Ineffective efforts |
The key to reading ventilator graphs: Always look at all 3 graphs together, like reading 3 lines of the same story. One graph alone can be confusing - together they give you the complete picture of every breath.