
Arterial blood pressure
Reading File
Arterial blood pressure (ABP) is the pressure exerted by circulating blood on the walls of the arteries. It is a broad physiology topic. Let me search the medical library for comprehensive coverage.
Searching sources...
Finding Sources
Finding Sources
Good results. Let me now read the most comprehensive physiology source and the pathology/pharmacology sources in parallel.
Reading File
Finding Sources
Reading File
Good content. Now let me get the physiology section on ABP definitions, determinants, and baroreceptor regulation from Medical Physiology.
Finding Sources
Finding Sources
Finding Sources
Finding Sources
Excellent. Now let me read the key physiology sections - Costanzo and Guyton for definitions/determinants, and read more of the Robbins regulation section.
Reading File
Reading File
Now let me read the baroreceptor section in Guyton and the Costanzo mean arterial pressure section, plus fetch the key diagram images.
Reading File
Reading File
Loading Image
Excellent material gathered. Now let me fetch the arterial pressure curve and the Robbins regulation diagram.
Loading Image
Reading File
I now have comprehensive material from multiple authoritative textbooks. Let me compile the full answer.
Arterial Blood Pressure
Arterial blood pressure (ABP) is the pressure exerted by circulating blood on the walls of the arteries, generated primarily by the pumping action of the left ventricle. It is one of the four vital signs and is the driving force for organ perfusion throughout the systemic circulation.
1. Definitions and Key Parameters
The arterial pressure waveform oscillates with each cardiac cycle, giving rise to several distinct values:
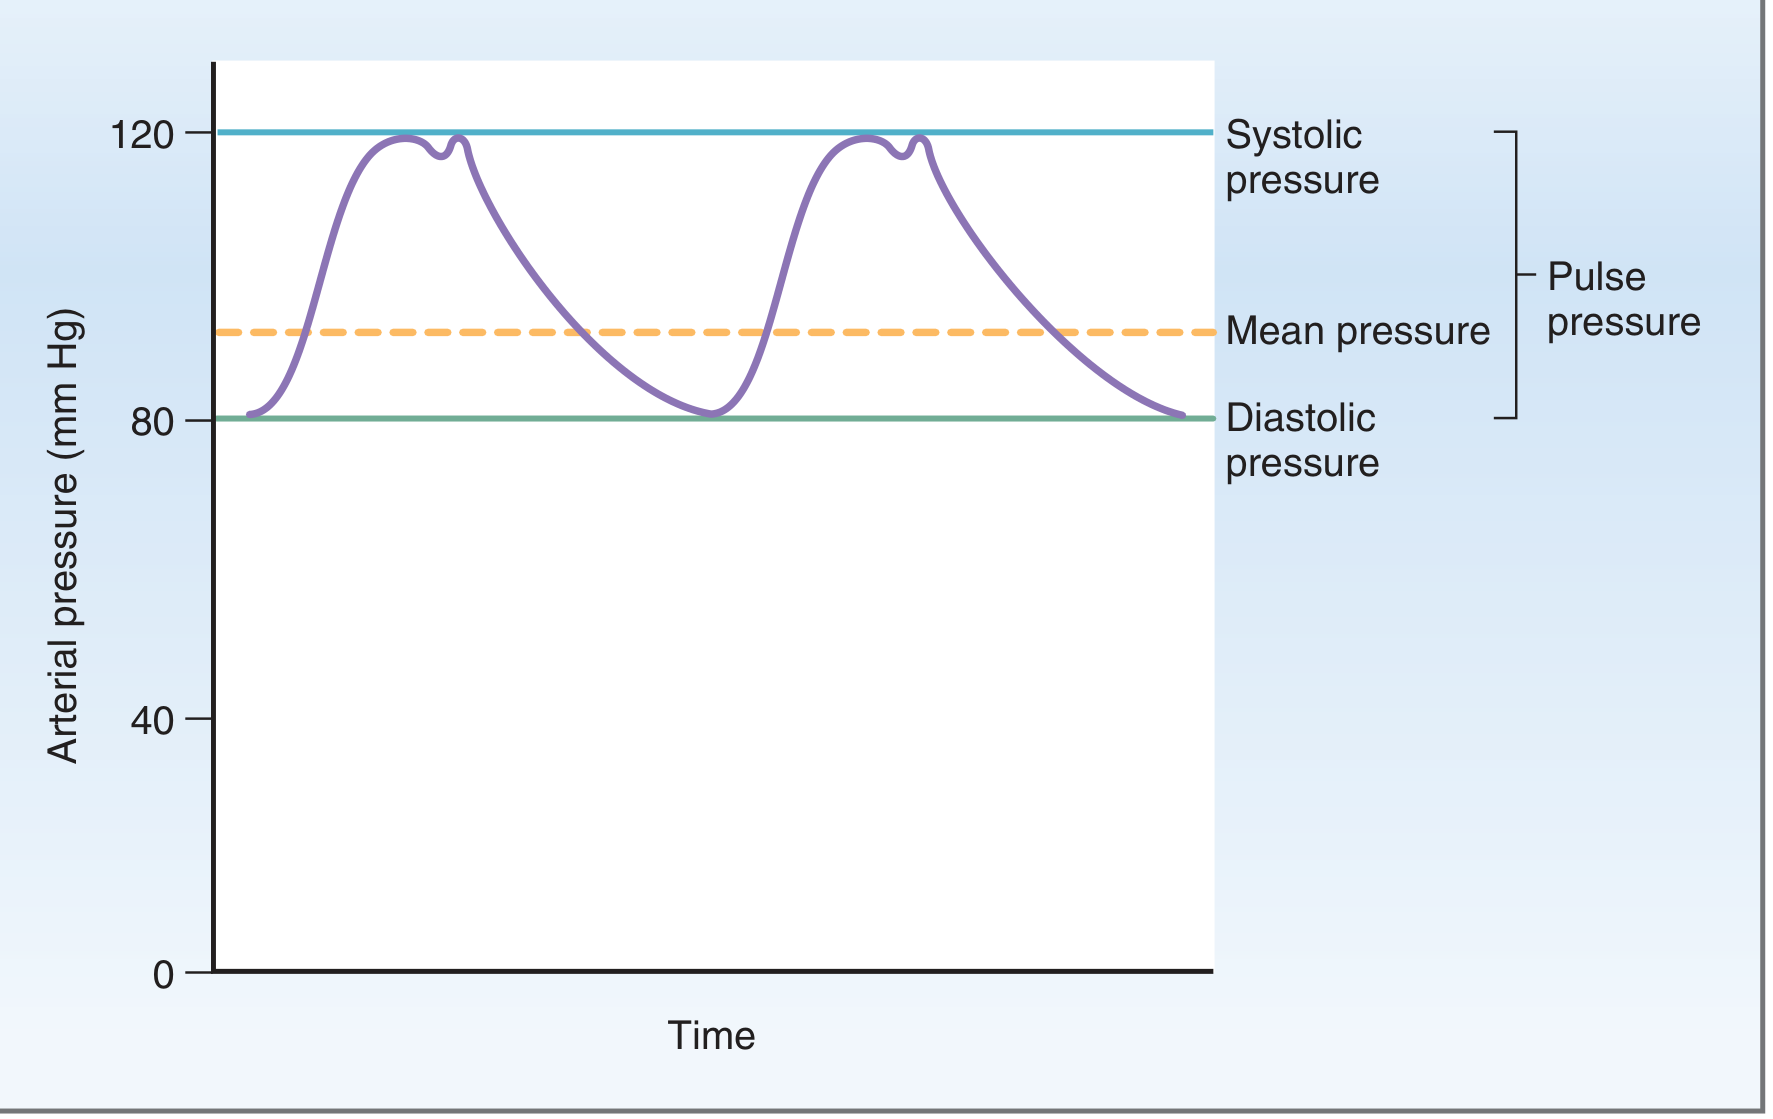
| Parameter | Definition | Normal Value |
|---|---|---|
| Systolic pressure (SBP) | Peak pressure during ventricular ejection | ~120 mm Hg |
| Diastolic pressure (DBP) | Lowest pressure during ventricular relaxation | ~80 mm Hg |
| Pulse pressure (PP) | SBP - DBP; reflects stroke volume | ~40 mm Hg |
| Mean arterial pressure (MAP) | Average pressure driving organ perfusion | ~93 mm Hg |
MAP formula:
MAP = DBP + 1/3 Pulse Pressure
MAP is not the arithmetic average of SBP and DBP - it is weighted toward diastole because the heart spends more time in diastole than systole. - Costanzo Physiology, 7th Ed., p. 135
The dicrotic notch on the arterial waveform marks closure of the aortic valve, producing a brief period of retrograde flow.
2. Fundamental Determinants
The master equation:
Blood Pressure = Cardiac Output (CO) × Total Peripheral Resistance (TPR)
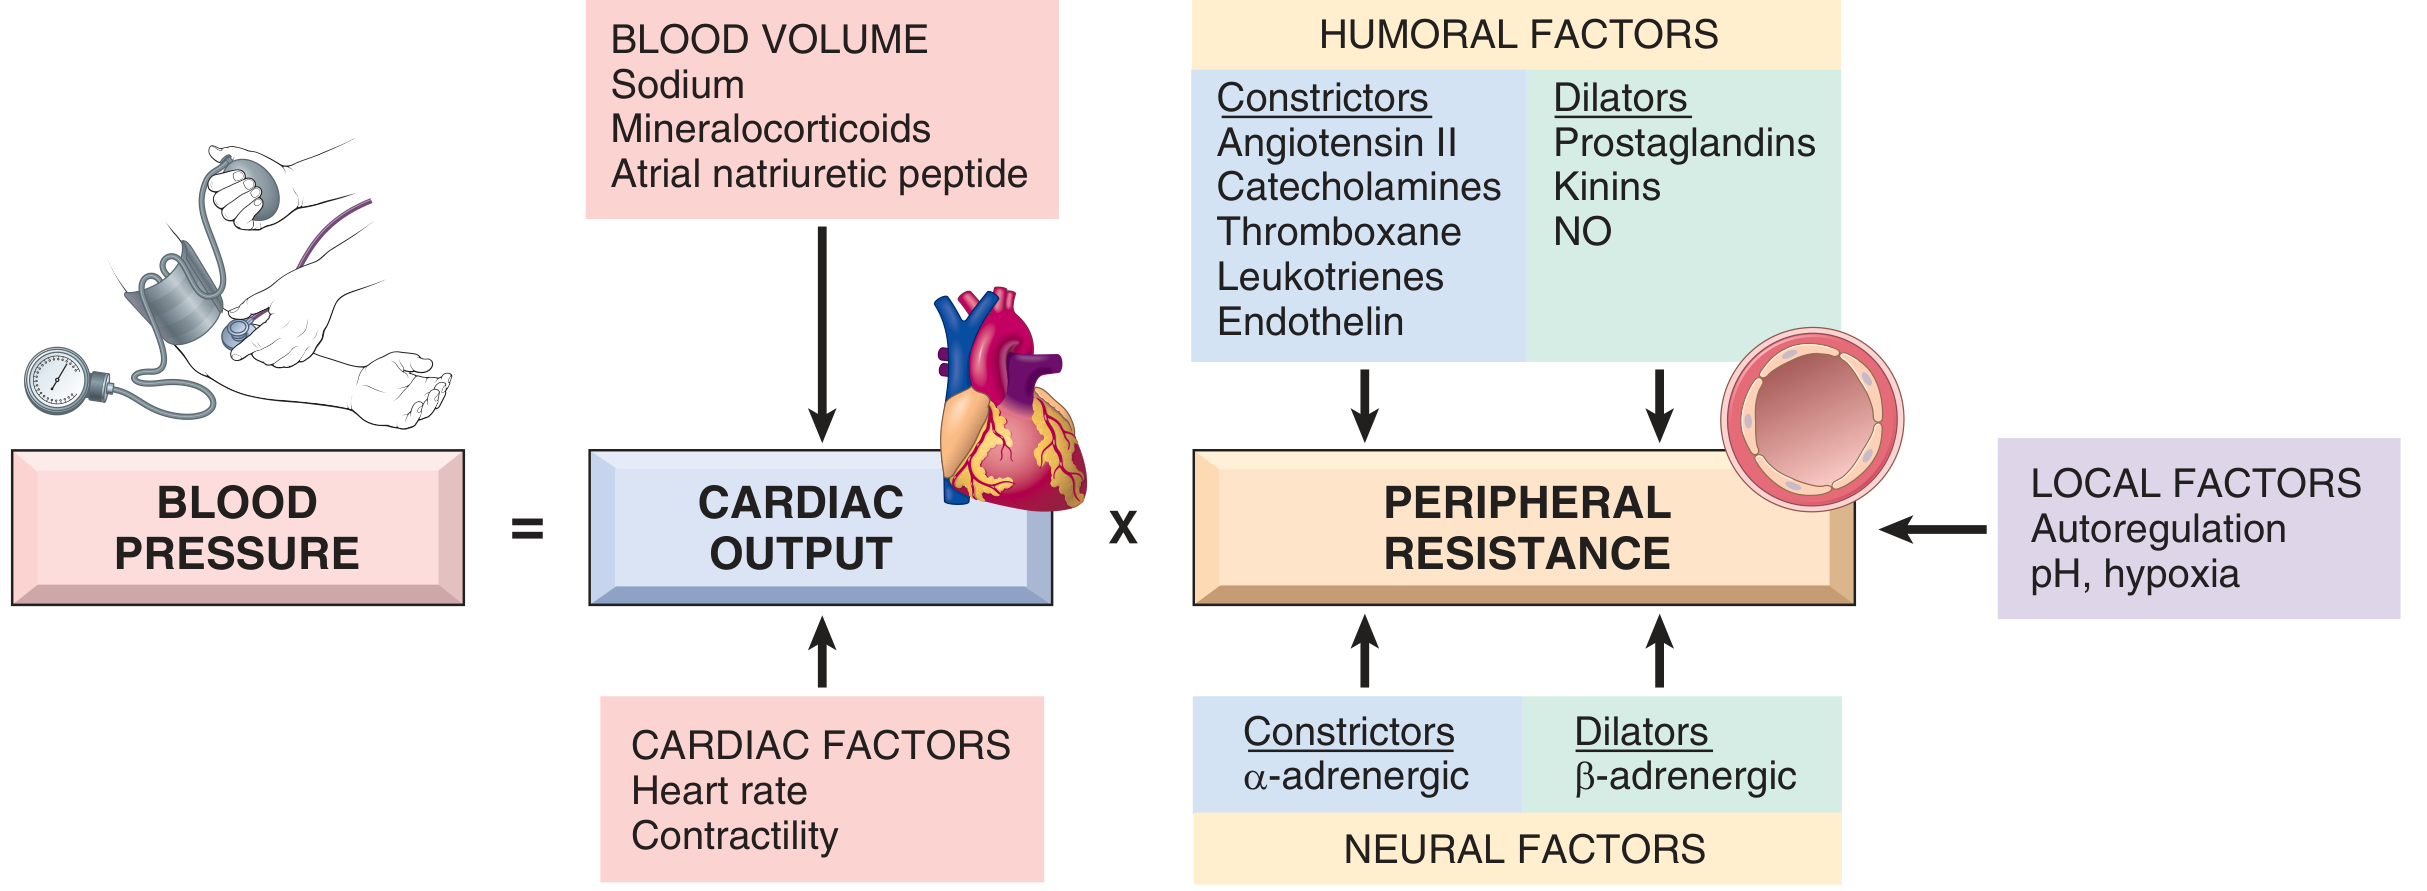
Cardiac Output
CO = Heart Rate × Stroke Volume
- Stroke volume is mainly determined by filling pressure (preload), which is regulated by sodium homeostasis and blood volume
- Heart rate and contractility are governed by the α- and β-adrenergic systems
Peripheral Resistance
Regulated primarily at the arterioles by:
-
Neural factors - α-adrenergic (vasoconstriction), β-adrenergic (vasodilation)
-
Humoral constrictors - Angiotensin II, catecholamines, endothelin, thromboxane, leukotrienes
-
Humoral dilators - Prostaglandins, kinins, nitric oxide (NO)
-
Local factors - Autoregulation, tissue pH, hypoxia
-
Robbins & Kumar Basic Pathology, p. 309
3. Regulation of Arterial Pressure
A. Neural (Short-Term) Regulation: Baroreceptor Reflex
Baroreceptors are stretch receptors located in the:
- Carotid sinus (wall of internal carotid artery at the bifurcation) - transmit via CN IX (Hering's nerve)
- Aortic arch - transmit via CN X (vagus)
Mechanism:
- Rise in MAP → increased baroreceptor firing → signals to medullary vasomotor center → inhibit sympathetic, activate parasympathetic → decreased HR, decreased contractility, vasodilation → MAP falls back toward normal
- Fall in MAP → opposite response
The baroreceptor system is a pressure buffer system - it opposes changes in both directions. Its importance is demonstrated by the extreme blood pressure variability seen after baroreceptor denervation in animal experiments. - Guyton and Hall Textbook of Medical Physiology, p. 228
Clinically, this reflex maintains pressure stability on standing (orthostatic response) and during the Valsalva maneuver.
B. Neural (Secondary): Chemoreceptor Influence
Peripheral chemoreceptors (carotid and aortic bodies) also modulate ABP:
-
Low PO₂, high PCO₂, or low pH → stimulate chemoreceptors → positive drive on medullary vasomotor center → vasoconstriction
-
Simultaneously, both baroreceptors and chemoreceptors increase parasympathetic drive to the heart → bradycardia
-
Medical Physiology (Boron & Boulpaep), p. 797
C. Humoral (Medium-Term) Regulation: RAAS
The Renin-Angiotensin-Aldosterone System (RAAS) is the dominant humoral mechanism:
- Low blood pressure → Renin released from renal juxtaglomerular cells
- Renin cleaves angiotensinogen → Angiotensin I
- ACE (vascular endothelium) converts → Angiotensin II
- Angiotensin II:
- Directly constricts vascular smooth muscle (↑ TPR)
- Stimulates aldosterone release from adrenal cortex
- Increases renal tubular Na⁺ reabsorption
- Aldosterone → increases Na⁺ (and water) reabsorption in distal tubule → ↑ blood volume → ↑ CO → ↑ BP
Counter-regulatory system:
-
Atrial Natriuretic Peptide (ANP) and BNP are released from myocardium in response to volume expansion → promote natriuresis, diuresis, and systemic vasodilation → lower BP
-
Robbins & Kumar Basic Pathology, pp. 309-310
D. Renal (Long-Term) Regulation
The kidney provides the most sustained blood pressure control through regulation of sodium balance and blood volume. Each day, 99.5% of filtered sodium must be reabsorbed to maintain sodium balance; the ENaC channel (regulated by aldosterone) determines the net balance. Chronic alterations in sodium retention shift the "pressure-natriuresis" curve and produce sustained hypertension or hypotension.
4. Pressure Profile Across the Vasculature
Pressure drops dramatically across different vessel segments:
| Vessel | Approximate Pressure |
|---|---|
| Aorta | ~100 mm Hg (mean) |
| Large arteries | ~90-95 mm Hg (mean); higher pulse pressure |
| Arterioles | Pressure drops sharply (~30 mm Hg exit) - site of highest resistance |
| Capillaries | ~25-35 mm Hg (entrance) → ~10 mm Hg (exit) |
| Venules/Veins | ~5-15 mm Hg |
| Right atrium | 0-2 mm Hg |
The arterioles are the primary resistance vessels. Pulse pressure is progressively damped and disappears completely by the capillaries. - Costanzo Physiology, 7th Ed., p. 134
5. Factors Altering Pulse Pressure
Pulse pressure increases when:
- Stroke volume ↑ (e.g., exercise, aortic regurgitation)
- Arterial compliance ↓ (e.g., atherosclerosis, aging)
Pulse pressure decreases when:
- Stroke volume ↓ (e.g., hemorrhage, heart failure)
- Early sign of hemorrhagic shock is narrowing of pulse pressure
6. Measurement
Auscultatory method (Korotkoff sounds):
- Cuff inflated above SBP → artery collapsed, no sounds
- Cuff slowly deflated → at SBP, blood spurts through → first Korotkoff sound heard (= SBP)
- At DBP, sounds become muffled then disappear (= DBP)
Oscillometric method: Detects arterial wall oscillations through the cuff; maximum oscillation amplitude corresponds to MAP; algorithm derives SBP and DBP. Advantage: less operator-dependent; usable for home monitoring.
- Guyton and Hall Textbook of Medical Physiology, p. 227
7. Normal Values and Classification
| Category | SBP (mm Hg) | DBP (mm Hg) |
|---|---|---|
| Normal | < 120 | < 80 |
| Elevated | 120-129 | < 80 |
| Stage 1 Hypertension | 130-139 | 80-89 |
| Stage 2 Hypertension | ≥ 140 | ≥ 90 |
| Hypotension | < 90 | < 60 |
Blood pressure rises progressively with age due to increasing arterial stiffness (reduced compliance), which raises SBP and pulse pressure while DBP may decline in later decades.
Summary
Arterial blood pressure results from the interaction of cardiac output and peripheral vascular resistance. It is tightly controlled across multiple time scales: the baroreceptor reflex provides rapid (seconds) buffering; the RAAS and humoral systems operate over hours; renal sodium regulation provides long-term (days-weeks) control. Disruption of any of these mechanisms - genetic, environmental, or pharmacological - can produce hypertension or hypotension with consequences for end-organ perfusion and cardiovascular health.
Can u make it for 10 mark gk pal
Here's a clean, exam-ready 10-mark answer on Arterial Blood Pressure:
Arterial Blood Pressure
(10 Marks)
Definition
Arterial blood pressure is the lateral pressure exerted by the column of blood on the walls of the arteries. It is expressed in mm Hg and recorded as Systolic / Diastolic (normal: 120/80 mm Hg).
Important Terms
| Term | Definition | Normal Value |
|---|---|---|
| Systolic BP | Peak pressure during ventricular systole | 120 mm Hg |
| Diastolic BP | Minimum pressure during ventricular diastole | 80 mm Hg |
| Pulse Pressure | SBP - DBP | 40 mm Hg |
| Mean Arterial Pressure | DBP + 1/3 Pulse Pressure | ~93 mm Hg |
Determinants of Arterial Blood Pressure
BP = Cardiac Output (CO) × Total Peripheral Resistance (TPR)
1. Cardiac Output
- CO = Heart Rate × Stroke Volume
- Stroke Volume depends on: Preload, Contractility, Afterload
2. Total Peripheral Resistance
- Mainly regulated at the arterioles
- Depends on: blood viscosity, vessel length, vessel radius (Poiseuille's law)
3. Blood Volume
- Increased blood volume → increased venous return → increased CO → increased BP
4. Elasticity of Aorta
- Aorta acts as a Windkessel vessel - stores blood during systole and propels it during diastole, smoothing pulsatile flow
Regulation of Arterial Blood Pressure
A. Nervous Regulation (Short-term)
Baroreceptor Reflex:
- Baroreceptors located in carotid sinus (CN IX) and aortic arch (CN X)
- Rise in BP → increased firing → inhibit vasomotor center → vasodilation + decreased HR → BP falls back to normal
- Acts within seconds; the most important rapid regulator
Chemoreceptor Reflex:
- Low PO₂ / High PCO₂ / Low pH → stimulate peripheral chemoreceptors → vasoconstriction
B. Humoral Regulation (Medium-term)
RAAS (Renin-Angiotensin-Aldosterone System):
- Low BP → Renin (kidney) → Angiotensin I → Angiotensin II (via ACE)
- Angiotensin II → vasoconstriction + aldosterone release → Na⁺/water retention → ↑ blood volume → ↑ BP
Other humoral factors:
| Vasoconstrictors | Vasodilators |
|---|---|
| Angiotensin II | Nitric Oxide (NO) |
| Catecholamines | Kinins |
| Endothelin | Prostaglandins |
| ADH | ANP / BNP |
C. Renal Regulation (Long-term)
- Kidneys regulate blood volume via sodium and water balance
- Pressure natriuresis: raised BP → increased Na⁺ excretion → reduced blood volume → BP normalizes
- Most sustained, long-term mechanism
Measurement of Blood Pressure
Auscultatory Method (Korotkoff Sounds):
- Cuff inflated above SBP → artery collapsed → no sound
- Cuff slowly deflated → at SBP: first tapping sound heard (Phase I)
- At DBP: sounds become muffled (Phase IV) then disappear (Phase V)
Factors Affecting BP
- Age - BP increases with age (reduced vessel elasticity)
- Exercise - Systolic BP rises; diastolic may fall
- Emotion/Stress - Sympathetic activation → raises BP
- Posture - Standing → transient fall → baroreceptor reflex compensates
- Gravity - BP higher in dependent parts of the body
Normal Variation with Age
| Age Group | Normal SBP |
|---|---|
| Newborn | ~70 mm Hg |
| Child (10 yr) | ~100 mm Hg |
| Adult | 120 mm Hg |
| Elderly | May rise to 140+ mm Hg |
Clinical Significance
| Condition | BP Range |
|---|---|
| Normal | < 120/80 mm Hg |
| Prehypertension | 120-139 / 80-89 mm Hg |
| Hypertension Stage 1 | 140-159 / 90-99 mm Hg |
| Hypertension Stage 2 | ≥ 160 / ≥ 100 mm Hg |
| Hypotension | < 90/60 mm Hg |
Conclusion
Arterial blood pressure is maintained within narrow limits by an integrated system of nervous, humoral, and renal mechanisms. Its normal maintenance is essential for adequate perfusion of all vital organs. Sustained abnormalities lead to hypertension or shock with severe end-organ consequences.
Exam Tip: For 10 marks, always include - Definition, Determinants (BP = CO × TPR), Regulation (nervous + humoral + renal), Measurement, and Clinical significance. That covers all sections the examiner expects.
ECG in gk pal for 5 mark I need fill pages but it should be easy to write
Reading File
Finding Sources
Finding Sources
Finding Sources
Finding Sources
Reading File
Reading File
Reading File
Finding Sources
Reading File
Finding Sources
Loading Image
I have all the content needed. Here's your exam-ready 5-mark answer - detailed enough to fill pages, but written in simple, easy-to-write language:
Electrocardiogram (ECG)
(5 Marks)
Definition
Electrocardiogram (ECG) is the graphical recording of the electrical activity of the heart as a function of time, recorded from the surface of the body.
- It was introduced by Willem Einthoven in 1903
- He was awarded the Nobel Prize for this invention in 1924
- The instrument used is called Electrocardiograph
- The tracing obtained is called Electrocardiogram (ECG)
Principle
When a cardiac impulse passes through the heart, electrical currents spread into surrounding tissues and reach the body surface. These tiny electrical potentials (in millivolts) are picked up by electrodes placed on the skin and recorded as waves.
Depolarization = positive deflection (upward wave) Repolarization = negative deflection (downward wave)
ECG Paper and Calibration
ECG is recorded on graph paper:
- Horizontal axis = Time
- 1 small square = 0.04 sec
- 1 large square = 0.20 sec
- Paper speed = 25 mm/second
- Vertical axis = Voltage (amplitude)
- 1 small square = 0.1 mV
- 10 small squares = 1 mV
Leads Used in ECG
A standard ECG uses 12 leads in total:
A. Bipolar Limb Leads (Standard Leads) - 3 leads
| Lead | Connection |
|---|---|
| Lead I | Right arm (-) to Left arm (+) |
| Lead II | Right arm (-) to Left leg (+) |
| Lead III | Left arm (-) to Left leg (+) |
These follow Einthoven's Triangle.
B. Augmented Unipolar Limb Leads - 3 leads
- aVR - Right arm
- aVL - Left arm
- aVF - Left foot (inferior)
C. Chest (Precordial) Leads - 6 leads
V1, V2, V3, V4, V5, V6 - placed across the chest wall
Normal ECG Waveforms
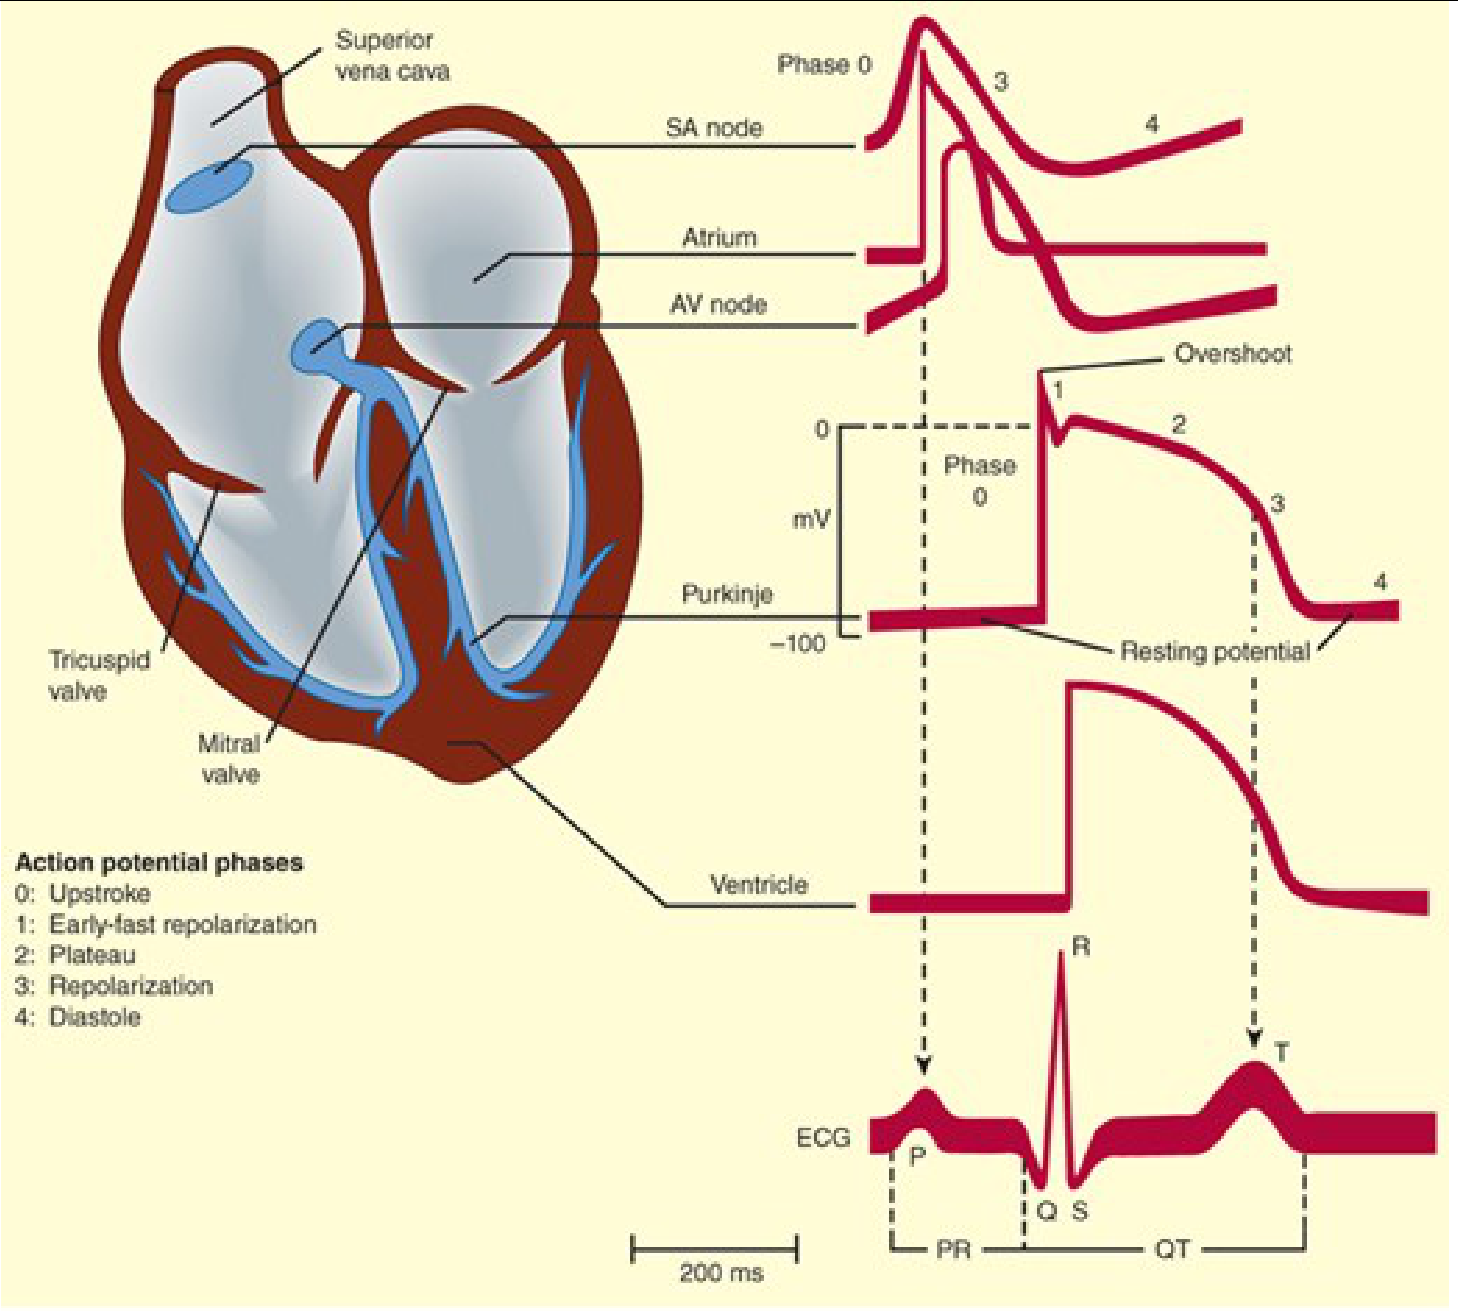
A normal ECG consists of the following waves:
1. P Wave
- Represents atrial depolarization
- Occurs just before atrial contraction
- Duration: 0.08-0.10 sec
- Amplitude: 0.1-0.3 mV
- Shape: Small, rounded, upright
2. QRS Complex
- Represents ventricular depolarization
- Occurs just before ventricular contraction
- Duration: 0.06-0.10 sec (less than 0.12 sec)
- Amplitude: 1.0-1.5 mV
- Composed of:
- Q wave - first downward deflection
- R wave - upward deflection
- S wave - second downward deflection
Note: Atrial repolarization is hidden inside the QRS complex and is not separately visible.
3. T Wave
- Represents ventricular repolarization
- Duration: 0.16-0.20 sec
- Amplitude: 0.2-0.3 mV
- Shape: Broad, dome-shaped, upright
4. U Wave (sometimes seen)
- Small positive wave after T wave
- Represents late repolarization of Purkinje fibers
- More prominent in hypokalemia
Normal ECG Intervals
| Interval | What it Measures | Normal Duration |
|---|---|---|
| PR interval | AV conduction time (atrium to ventricle) | 0.12 - 0.20 sec |
| QRS duration | Intraventricular conduction time | 0.06 - 0.10 sec |
| QT interval | Duration of ventricular action potential | 0.36 - 0.44 sec |
| ST segment | Time between ventricular depolarization and repolarization | Isoelectric (flat) |
Sequence of Cardiac Events and ECG
| Cardiac Event | ECG Wave |
|---|---|
| SA node fires | Not visible on ECG |
| Atrial depolarization | P wave |
| AV node delay | PR interval |
| Ventricular depolarization | QRS complex |
| Ventricular repolarization | T wave |
| Ventricular contraction | Between QRS and T wave |
Clinical Importance of ECG
ECG is used to diagnose:
- Arrhythmias - abnormal heart rate or rhythm (e.g., atrial fibrillation, heart block)
- Myocardial infarction (MI) - ST elevation, pathological Q waves
- Hypertrophy - Enlarged QRS voltage in ventricular hypertrophy
- Electrolyte imbalances - e.g., hypokalemia causes prominent U wave; hyperkalemia causes tall peaked T waves
- Drug toxicity - e.g., digitalis, quinidine effects
- Ischemia - ST depression, T wave inversion
Summary Table (Quick Revision)
| Wave | Represents | Normal Value |
|---|---|---|
| P wave | Atrial depolarization | 0.08-0.10 sec |
| QRS complex | Ventricular depolarization | < 0.12 sec |
| T wave | Ventricular repolarization | 0.16-0.20 sec |
| PR interval | AV conduction time | 0.12-0.20 sec |
| QT interval | Ventricular action potential | 0.36-0.44 sec |
Exam Tip: For 5 marks - cover Definition + Principle + Waves (P, QRS, T) with what each represents + Normal intervals + Clinical uses. The table at the end shows examiner you know all values precisely.
This is a shared conversation. Sign in to Orris to start your own chat.