
Point prevalence
Reading File
Finding Sources
Finding Sources
Reading File
Reading File
Loading Image
Here is a complete explanation of Point Prevalence drawn from Park's Textbook of Preventive and Social Medicine:
Point Prevalence
Definition: Point prevalence of a disease is the number of all current cases (old and new) of a disease at one point in time, in relation to a defined population.
Note: The "point" in point prevalence may, for all practical purposes, consist of a day, several days, or even a few weeks - depending on the time it takes to examine the population sample.
Formula
$$\text{Point Prevalence} = \frac{\text{Number of all current cases (old + new) of a disease at a given point in time}}{\text{Estimated population at the same point in time}} \times 100$$
- When the term "prevalence rate" is used without further qualification, it is taken to mean point prevalence.
- Point prevalence can be made specific for age, sex, and other relevant factors.
Types of Prevalence
| Type | Definition |
|---|---|
| Point prevalence | Cases existing at a single point in time |
| Period prevalence | Cases existing during a defined time interval (e.g., annual) |
Illustrative Diagram
The diagram below (from Park's) shows 8 cases of a disease across a calendar year. Each horizontal line represents the duration of illness for one case; the two vertical lines represent Jan 1 and Dec 31 (the measurement points).
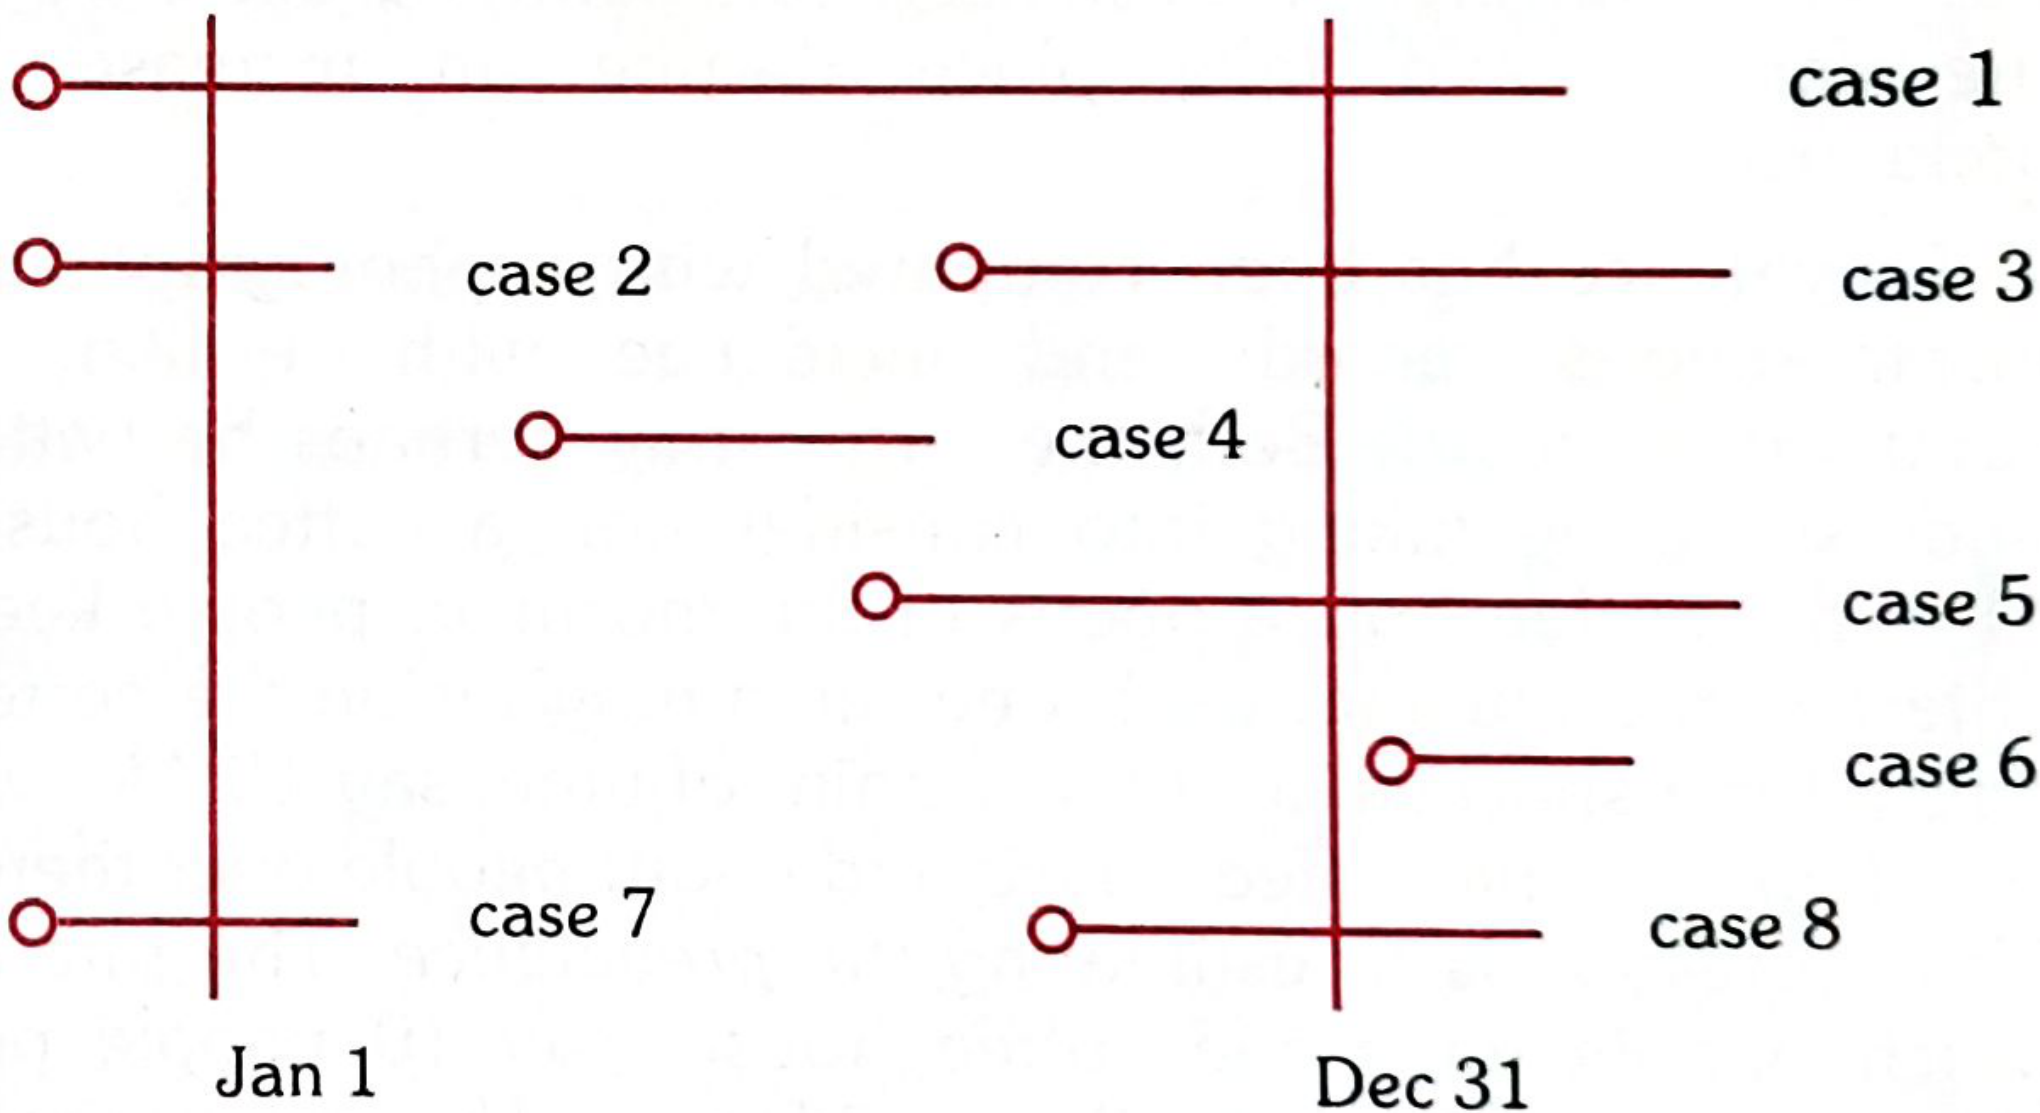
From the figure:
- Point prevalence (Jan 1): Cases 1, 2, and 7 (cases that were present/active on Jan 1)
- Point prevalence (Dec 31): Cases 1, 3, 5, and 8 (cases active on Dec 31)
- Incidence (Jan-Dec): Cases 3, 4, 5, and 8 (new cases that started during the year)
- Period prevalence (Jan-Dec): Cases 1, 2, 3, 4, 5, 7, and 8 (all cases present at any time during the year)
Relationship Between Prevalence and Incidence
$$P = I \times D$$
Where:
- P = Prevalence
- I = Incidence
- D = Mean duration of illness
Example: If incidence = 10 cases per 1,000/year, and mean duration = 5 years:
Prevalence = 10 × 5 = 50 per 1,000 population
Key implications:
- Diseases with long duration (e.g., tuberculosis, diabetes) have high prevalence relative to incidence.
- Diseases that are acute and short-lived (e.g., food poisoning) or rapidly fatal (e.g., some cancers) have low prevalence relative to incidence.
- A treatment that prevents death but does not produce recovery can paradoxically increase prevalence by prolonging duration.
Park's Textbook of Preventive and Social Medicine, p. 74
Period prevance and incidence rate
Finding Sources
Finding Sources
Reading File
Finding Sources
Reading File
Reading File
Here is a complete, textbook-based explanation of both measures:
Period Prevalence
Definition: Period prevalence measures the frequency of all current cases (old and new) of a disease existing during a defined period of time (e.g., one year), expressed in relation to a defined population.
It includes:
- Cases that arose before the period but extended into or through it
- Cases that arose during the period itself
Formula
$$\text{Period Prevalence} = \frac{\text{Number of existing cases (old + new) during a given time interval}}{\text{Estimated mid-interval population at-risk}} \times 100$$
Period prevalence is considered a less commonly used measure compared to point prevalence.
Incidence Rate
Definition: Incidence rate is "the number of new cases occurring in a defined population during a specified period of time."
Formula
$$\text{Incidence Rate} = \frac{\text{Number of new cases of specific disease during a given time period}}{\text{Population at-risk during that period}} \times 1000$$
Example: 500 new cases in a population of 30,000 in a year:
$$= \frac{500}{30,000} \times 1000 = \textbf{16.7 per 1,000 per year}$$
Important: Incidence rate must always include the unit of time in the expression (e.g., "per 1,000 per year"). Writing "16.7 per 1,000" alone is inadequate.
Key Characteristics of Incidence Rate
| Feature | Detail |
|---|---|
| Counts | New cases only |
| Time frame | During a given period (usually one year) |
| Denominator | Population at risk |
| Duration | Not influenced by disease duration |
| Common use | Acute conditions |
| Spells | Can also count new episodes (e.g., a person with 2 colds contributes 2 spells) |
Special Incidence Rates
a. Attack Rate
Used during epidemics, when the population is exposed to risk for a limited time:
$$\text{Attack Rate} = \frac{\text{New cases during a specified time interval}}{\text{Total population at risk during the same interval}} \times 100$$
b. Secondary Attack Rate
The number of exposed persons developing the disease within the incubation period following exposure to a primary case.
Uses of Incidence Rate
- Monitoring effectiveness of disease control programmes
- If incidence is rising - may indicate failure of control programmes or improved reporting
- Reveals changes in disease aetiology (agent, host, environment)
- Analyzes differences across socioeconomic groups and geographical areas
- Essential for aetiological research and evaluating preventive/therapeutic measures
Visualizing All Three Measures Together
The diagram below illustrates the difference between incidence, point prevalence, and period prevalence for 8 cases of a disease across a year:
| Measure | Cases |
|---|---|
| Incidence (Jan-Dec) | 3, 4, 5, 8 (new cases that started during the year) |
| Point prevalence (Jan 1) | 1, 2, 7 (active on Jan 1) |
| Point prevalence (Dec 31) | 1, 3, 5, 8 (active on Dec 31) |
| Period prevalence (Jan-Dec) | 1, 2, 3, 4, 5, 7, 8 (present at any time during the year) |
Summary Comparison
| Feature | Incidence Rate | Point Prevalence | Period Prevalence |
|---|---|---|---|
| Cases counted | New only | Old + new at one moment | Old + new over a time span |
| Time dimension | Rate over time | Snapshot | Duration |
| Denominator | Population at risk | Population at same point | Mid-interval population |
| Best used for | Acute disease, causation studies | Burden at a moment | Burden over time |
| Relationship | P = I × D | - | - |
Park's Textbook of Preventive and Social Medicine, pp. 73-74
Case control and cohort study
Finding Sources
Finding Sources
Reading File
Reading File
Reading File
Reading File
Reading File
Reading File
Reading File
Reading File
Reading File
Finding Sources
Reading File
Finding Sources
Reading File
Finding Sources
Reading File
I now have comprehensive content from Park's. Here is the full, structured answer:
Case-Control Study
Definition & Key Features
Case-control studies are often called "retrospective studies" and are a common first approach to test causal hypotheses. Three distinct features:
- Both exposure and outcome (disease) have already occurred before the study begins
- The study proceeds backwards - from effect to cause
- It uses a control/comparison group to support or refute an inference
The unit is the individual (not the group). The focus is on a disease that has already developed.
Framework - The 2×2 Table
| Suspected Risk Factor | Cases (Disease present) | Controls (Disease absent) |
|---|---|---|
| Present | a | b |
| Absent | c | d |
| Total | a+c | b+d |
- Exposure rate in cases = a/(a+c)
- Exposure rate in controls = b/(b+d)
- If a/(a+c) > b/(b+d), an association exists between the exposure and disease
- Measure of association = Odds Ratio (OR) = (a × d) / (b × c)
Note: The Relative Risk (RR) cannot be directly calculated from a case-control study. The OR approximates RR when the disease is rare.
Basic Steps
-
Selection of cases and controls
- Cases: use incident (newly diagnosed) cases; define diagnostic criteria before study begins
- Sources: hospitals OR general population (disease registry)
- Controls: must be comparable to cases in age, sex, occupation, social status (matching)
-
Matching - to control for confounding variables
-
Measurement of exposure - via interviews, questionnaires, or past records (hospital/employment records)
-
Analysis - exposure rates + Odds Ratio
Real-World Example: Vaginal Adenocarcinoma & DES (1971)
An unusual cluster of 8 young women (15-22 years) developed vaginal adenocarcinoma. A case-control study found that 7 of 8 cases had been exposed to diethylstilbestrol (DES) in fetal life (given to their mothers to prevent miscarriage), versus none of the 32 controls. This revealed DES exposure in utero as the cause of vaginal adenocarcinoma 10-20 years later.
Types of Bias in Case-Control Studies
| Bias | Description |
|---|---|
| Recall (memory) bias | Cases recall past exposures more readily than healthy controls |
| Selection bias | Cases/controls may not represent the general population |
| Berkesonian bias | Different hospital admission rates for different diseases distort results |
| Interviewer bias | Interviewer probes cases more thoroughly if aware of the hypothesis |
| Confounding bias | Controlled by matching |
Advantages & Disadvantages
| Advantages | Disadvantages |
|---|---|
| Relatively easy and quick to conduct | Relies on memory or past records (uncertain accuracy) |
| Inexpensive compared to cohort studies | Prone to recall bias |
| Requires few subjects | Difficult to validate information |
| Ideal for rare diseases | Not suitable for rare exposures |
| Can study multiple aetiological factors simultaneously | Cannot directly calculate incidence or RR |
| No attrition problems (no follow-up required) | Temporal relationship (cause before effect) may be hard to establish |
| Ethical problems minimal | Selection of appropriate controls is difficult |
Cohort Study
Definition & Key Features
Also called: prospective study, longitudinal study, incidence study, forward-looking study
Three distinguishing features:
- Cohorts are identified prior to appearance of the disease
- Study groups are observed over time to determine disease frequency
- The study proceeds forward - from cause to effect
Concept of "Cohort"
A cohort is a group of people who share a common characteristic or experience within a defined time period:
- Birth cohort: all persons born in the same year (e.g., birth cohort of 2010)
- Exposure cohort: persons exposed to a common drug, vaccine, or infection
- Marriage cohort: all those married in the same time period
Framework - The 2×2 Table
| Cohort | Disease: YES | Disease: NO | Total |
|---|---|---|---|
| Exposed | a | b | a+b |
| Not exposed | c | d | c+d |
- Incidence in exposed = a/(a+b)
- Incidence in unexposed = c/(c+d)
- If a/(a+b) > c/(c+d), an association exists
- Measure of association = Relative Risk (RR) = [a/(a+b)] ÷ [c/(c+d)]
Relative risk can be exactly determined only from a cohort study.
Types of Cohort Studies
1. Prospective Cohort Study
- Disease has not yet occurred when study begins
- Starts in the present, follows into the future
- Examples: Framingham Heart Study, Doll & Hill's study on smoking and lung cancer, Royal College of GPs study on oral contraceptives
2. Retrospective (Historical) Cohort Study
- Outcomes have all already occurred before study begins
- Investigator goes back 10-30 years using existing records, then traces subjects forward to the present
- Also called: historical cohort, non-concurrent prospective study
- More economical and produces results more quickly than prospective studies
- Examples: arsenic and carcinogenesis, lung cancer in uranium miners, angiosarcoma of liver and polyvinyl chloride
3. Combined Retrospective + Prospective
Indications for Cohort Studies
(a) Good prior evidence of an association from case-control or descriptive studies
(b) Exposure is rare but incidence of disease is high among the exposed (e.g., industrial exposures, X-ray exposure)
(c) Attrition of study population can be minimized (stable, cooperative, accessible cohort)
(d) Ample funds are available
Elements of a Cohort Study
- Selection of study subjects - general population or special exposure groups
- Obtaining data on exposure - interviews, questionnaires, medical records, medical examination, environmental surveys
- Selection of comparison group - general population or a non-exposed cohort
- Follow-up - both groups followed under identical conditions; may take many years (especially for chronic diseases)
- Analysis - incidence rates and Relative Risk
Advantages & Disadvantages
| Advantages | Disadvantages |
|---|---|
| Can determine incidence of disease directly | Time-consuming and expensive |
| Can calculate Relative Risk directly | Requires large numbers of subjects |
| Temporal sequence of cause → effect is clear | Attrition (loss to follow-up) is a major problem |
| Reduces recall bias | Not suitable for rare diseases |
| Can study multiple outcomes from a single exposure | Changes in diagnostic criteria over time can distort results |
| Most reliable design for showing association between risk factor and disease | Ethical concerns if harmful exposure is suspected |
| Eliminates many problems of case-control study |
"A well-designed cohort study is considered the most reliable means of showing an association between a suspected risk factor and subsequent disease."
Key Comparison: Case-Control vs Cohort
| Feature | Case-Control | Cohort |
|---|---|---|
| Direction | Backward (effect → cause) | Forward (cause → effect) |
| Starting point | Disease outcome | Exposure status |
| Cases at start | Disease already present | Disease-free at start |
| Time | Fast | Slow (years to decades) |
| Cost | Low | High |
| Sample size | Small | Large |
| Rare disease | Ideal | Impractical |
| Rare exposure | Impractical | Ideal |
| Measure of association | Odds Ratio (OR) | Relative Risk (RR) |
| Incidence calculable | No | Yes |
| Bias | Recall bias, selection bias | Attrition bias |
| Classic example | DES and vaginal adenocarcinoma | Framingham Heart Study |
Park's Textbook of Preventive and Social Medicine, pp. 84-90
Scanning in pregnant woman with trimester
Reading File
Finding Sources
Finding Sources
Finding Sources
Finding Sources
Finding Sources
Finding Sources
Reading File
Finding Sources
Reading File
Finding Sources
Reading File
Finding Sources
Reading File
Reading File
Reading File
Finding Sources
I now have comprehensive textbook content. Here is the complete, structured answer:
Ultrasound Scanning in Pregnancy by Trimester
Ultrasound (USS) is the primary imaging modality in pregnancy - it is safe, uses no ionizing radiation, and is performed following the ALARA principle (As Low As Reasonably Achievable). The thermal index (TI) should be monitored and kept at 0.7 or less.
First Trimester (< 14 Weeks)
Timing
- Viability scan: 6-10 weeks (transvaginal)
- Dating + Nuchal Translucency (NT) scan: 11-14 weeks (ideally 12 weeks)
What is Assessed (CPT 76801 - for <14 weeks)
| Parameter | Purpose |
|---|---|
| Presence, size, location of gestational sac | Confirm intrauterine pregnancy |
| Crown-Rump Length (CRL) | Gestational age dating (most accurate in 1st trimester) |
| Cardiac activity | Confirm viability |
| Number of fetuses + chorionicity | Detect multiple pregnancy |
| Amniotic fluid volume | Qualitative assessment |
| Maternal uterus and adnexa | Rule out fibroids, ovarian cysts, ectopic |
Nuchal Translucency (NT) Scan - 11-14 Weeks
- Measures fluid accumulation at the back of the fetal neck
- Increased NT is associated with:
- Down syndrome (Trisomy 21)
- Trisomies 13 and 18
- Turner syndrome (45,X)
- Triploidy
- Wide range of structural abnormalities
- Risk for Down syndrome correlates with absolute NT value + maternal age
- NT is reported as a percentile for gestational age (80% of Down syndrome fetuses have NT above 95th percentile)
- Combined with blood tests (PAPP-A, beta-hCG) = Combined First Trimester Screen
Structural Anomaly Detection in 1st Trimester
- ~40-50% of major structural anomalies can be detected at 11-14 weeks
- Always detectable before 14 weeks:
- Acrania / Anencephaly
- Encephalocele
- Ectopia cordis
- Exomphalos (omphalocele)
- Gastroschisis
- Body stalk anomaly
- Alobar holoprosencephaly
- Sirenomelia
- Megacystis
- ~40-50% of major cardiac defects can also be identified at ≤14 weeks (higher rate with dedicated fetal echocardiography)
Second Trimester (14-28 Weeks)
The Anomaly Scan (Mid-Trimester) - 18-20 Weeks
This is the most important routine scan of pregnancy. Also called the "morphology scan" or "level II scan".
What is Assessed (CPT 76805 - for ≥14 weeks)
| Structure | Specific Assessment |
|---|---|
| Fetal number + cardiac activity | Confirm viability and presentation |
| Biometry | BPD, HC, AC, FL - gestational age + growth |
| Brain/Head | Intracranial anatomy, ventricles, cerebellum, cisterna magna |
| Spine | Integrity, spina bifida |
| Thorax | Four-chamber heart, lungs, diaphragm |
| Abdomen | Stomach, kidneys, bladder, abdominal wall |
| Limbs | Long bones, hands, feet |
| Placenta | Location (rule out placenta praevia), appearance |
| Amniotic fluid | Amniotic fluid index (AFI) |
| Umbilical cord | Insertion site, number of vessels |
Biometry Measurements at Mid-Trimester
- BPD (Biparietal Diameter) - transverse head measurement at thalami level; insonation angle 90° to falx
- HC (Head Circumference) - same plane as BPD
- AC (Abdominal Circumference)
- FL (Femur Length)
Soft Markers for Chromosomal Abnormality at ~18-20 Weeks
| Ultrasound Finding | Associated Abnormality |
|---|---|
| Cardiac defect (AVSD) | Trisomy 13, 18, 21 |
| Clenched overlapping fingers | Trisomy 18 |
| Cystic hygroma / hydrops | Trisomy 13, 18, 21; Turner syndrome |
| Duodenal atresia ("double bubble") | Trisomy 21, Turner syndrome |
| Exomphalos | Trisomy 13, 18 (50% of cases) |
| Rocker-bottom foot | Trisomy 18 |
Detailed Anatomical Scan (High Risk - CPT 76811)
Indicated when risk of abnormalities is increased (history, prior scan finding). Adds:
- 3rd and 4th cerebral ventricles
- Cerebellar lobes with measurements
- Cisterna magna measurement
- Nuchal thickness (15-20 weeks)
- Palate assessment
- Detailed thoracic and abdominal evaluation
Third Trimester (>28 Weeks)
Timing and Indication
Scans are not routinely performed in all low-risk pregnancies at this stage - but are indicated for:
- Fetal growth monitoring (suspected IUGR/macrosomia)
- Placental location (known or suspected low-lying)
- Fetal wellbeing assessment
- Amniotic fluid monitoring
- Fetal presentation
What is Assessed
| Parameter | Purpose |
|---|---|
| Fetal biometry (BPD, HC, AC, FL) | Growth velocity; detect IUGR or macrosomia |
| Amniotic fluid index (AFI) | Oligohydramnios / polyhydramnios |
| Placenta | Final confirmation of location; rule out placenta praevia |
| Fetal presentation | Cephalic / breech / transverse |
| Umbilical artery Doppler | Assess fetoplacental circulation |
| Biophysical Profile (BPP) | Fetal wellbeing (tone, movement, breathing, AFI, NST) |
In diabetic pregnancies: "The goals of third-trimester management are to prevent stillbirth and asphyxia while optimizing safe vaginal delivery - involving monitoring fetal growth and biophysical profile or non-stress testing at least weekly."
Summary Table: Scans by Trimester
| Trimester | Week | Scan Name | Key Purpose |
|---|---|---|---|
| 1st | 6-10 wks | Viability scan | Confirm live intrauterine pregnancy |
| 1st | 11-14 wks | Dating + NT scan | CRL dating, nuchal translucency, early anomaly detection |
| 2nd | 18-20 wks | Anomaly / Morphology scan | Structural survey, fetal anatomy, biometry |
| 2nd/3rd | 20-24 wks | Cervical length (if indicated) | Risk of preterm labour |
| 3rd | 28-36 wks | Growth scan | IUGR surveillance, Doppler, presentation |
| 3rd | 36+ wks | Presentation scan | Confirm cephalic, placental position |
Safety Notes
- Ultrasound in pregnancy uses no ionizing radiation - considered safe
- Follow ALARA principle; thermal index (TI) kept ≤0.7
- Spectral Doppler should be reserved for specific clinical indications (higher energy output)
- Color Doppler may be used; necessary for detailed first-trimester cardiac evaluation
Creasy & Resnik's Maternal-Fetal Medicine, Principles and Practice; Emery's Elements of Medical Genetics and Genomics
Diet history chart S PERNPARK
Finding Sources
Finding Sources
Finding Sources
Finding Sources
Finding Sources
Finding Sources
Finding Sources
Finding Sources
Finding Sources
Searching the Web
S PERNPARK mnemonic diet history chart Park's Preventive Social Medicine
Finding Sources
Searching the Web
"S PERNPARK" OR "SPERNPARK" diet history nutritional assessment mnemonic
Searching the Web
diet history methods "S" "P" "E" "R" "N" "P" "A" "R" "K" nutritional assessment Park PSM
The mnemonic S PERNPARK does not appear in any of the textbooks in the library, and my web searches found no match for this exact mnemonic either. It is likely a community-circulated mnemonic used in Indian PSM/community medicine teaching, not formally printed in Park's textbook itself. Based on the widely-known dietary assessment methods covered in Park's PSM and the letters, here is the best interpretation:
Diet History - S PERNPARK Mnemonic
This mnemonic covers the methods of dietary survey / dietary assessment used to study food intake in individuals and communities.
| Letter | Method | Description |
|---|---|---|
| S | Dietary Score method | Assigns scores based on consumption of key foods; quick screening tool for dietary adequacy |
| P | Prospective method (Weighment/Record method) | Food is weighed/recorded before consumption; most accurate but burdensome |
| E | Expenditure pattern method | Estimates food intake based on household expenditure on food items |
| R | Recall method (24-hour Recall) | Subject recalls all food consumed in the previous 24 hours; retrospective, quick, widely used |
| N | Nutrition (Food) Balance Sheet | National-level data on food availability per capita; macro-level assessment |
| P | Precise (Chemical analysis / Duplicate Sample) method | Laboratory chemical analysis of duplicate food portions; most accurate, used in research |
| A | Appraisal by Food Frequency Questionnaire (FFQ) | Assesses how often specific foods are consumed over a reference period |
| R | Recording method (Food diary) | Subject records all food consumed over several days (3-7 days); prospective |
| K | Key (Inventory) method | Records food stocks at beginning and end of a defined period; used at household level |
Key Methods Explained in Detail
1. Food Balance Sheet Method
- National / macro level
- Estimates per capita food availability from production + imports - exports - non-food use
- Does NOT measure actual individual intake
- Used by FAO for international comparisons
2. Inventory / Larder Method
- Household level
- Records food stocks at beginning and end of a period
- Includes all purchases and home production during that period
- Estimates food available for consumption (not actual intake)
3. Weighment Method (Prospective)
- Gold standard for individual intake
- All food is weighed before eating
- Highly accurate but expensive, time-consuming, and may alter eating behavior
- Used in metabolic ward studies
4. 24-Hour Recall Method
- Individual level, retrospective
- Subject recalls everything consumed in the past 24 hours via interview
- Quick, cheap, no literacy required
- Limitation: single day may not represent usual intake; subject to memory bias
- Best when repeated over multiple days
5. Dietary Score Method
- Simple screening; assigns scores for consumption of protective foods
- Useful for quick community surveys
6. Food Frequency Questionnaire (FFQ)
- Subject reports how often (daily/weekly/monthly) they eat specific foods
- Long reference period (past month/year)
- Indirect method - does not measure exact quantity
- Most widely used in epidemiological studies
7. Duplicate Sample / Chemical Analysis
- Most precise method
- Exact duplicate of all food consumed is chemically analysed in laboratory
- Used in research settings
8. Expenditure Pattern Method
- Based on household food expenditure records
- Estimates nutritional status indirectly via economic data
9. Diet History Method (Burke's Method)
- Detailed in-depth interview about usual food intake
- Combines: 3-day food diary + 24-hour recall + food checklist
- Assesses meal patterns, dietary habits, food preferences
- Requires ~90 minutes and trained interviewer
Classification: Prospective vs Retrospective
| Prospective (recorded before/during eating) | Retrospective (recalled after eating) |
|---|---|
| Weighment method | 24-hour Recall |
| Food diary / Recording method | Diet History |
| Duplicate sample method | Food Frequency Questionnaire |
| Food Balance Sheet |
Important note: The exact mnemonic "S PERNPARK" is a teaching aid used in Indian PSM coaching/notes and is not formally printed in Park's textbook. The textbook lists these methods under "Assessment of Nutritional Status - Dietary Surveys" without using this specific acronym. If your notes or coaching material assigns slightly different full forms to any letter, those should be given priority in your exam preparation.
diet history as per park
Finding Sources
Finding Sources
Finding Sources
Reading File
Reading File
Reading File
Reading File
Reading File
I now have the complete content from Park's. Here is the full, textbook-accurate answer:
Assessment of Nutritional Status - Dietary Assessment as per Park's
Park's lists 7 methods of nutritional status assessment:
- Clinical examination
- Anthropometry
- Biochemical / Laboratory evaluation
- Functional assessment
- Assessment of dietary intake ← (Diet Survey)
- Vital and health statistics
- Ecological studies
5. Assessment of Dietary Intake (Diet Survey)
"The value of nutritional assessment is greatly enhanced when it is supplemented by an assessment of food consumption. Direct assessment of food consumption involves dietary surveys which may be household inquiries or individual food consumption surveys."
Methods of Diet Survey (as per Park's)
Park's describes 3 direct methods under dietary survey:
(i) Weighment of Raw Foods
- Most widely employed method in India
- Practicable and fairly accurate when properly carried out
- Survey team visits households and weighs all food going to be cooked and eaten, plus food wasted/discarded
- Duration: 1 to 21 days - commonly 7 days = "one dietary cycle"
(ii) Weighment of Cooked Foods
- Foods analyzed in the state they are normally consumed
- More accurate in terms of actual nutrient intake
- Not easily acceptable among people (culturally less acceptable)
(iii) Oral Questionnaire Method (24-Hour Recall)
- Useful for large-scale surveys in a short time
- Inquiries made retrospectively about nature and quantity of foods eaten in the previous 24 or 48 hours
- If properly carried out, gives reliable results
- Can also collect data on dietary habits and practices
What the Data is Translated Into
After collection, dietary survey data is translated into:
(a) Mean intake (grams) of food in terms of:
- Cereals
- Pulses
- Vegetables
- Fruits
- Milk
- Meat, Fish, and Eggs
(b) Mean intake of nutrients per adult man value or "consumption unit"
Reference used: ICMR publication - "Nutritive Value of Indian Foods"
7. Ecological Studies (Indirect Dietary Assessment)
Park's also covers indirect dietary assessment under ecological factors:
(a) Food Balance Sheet
- Indirect method of assessing food consumption
- Food supplies related to census population to derive per capita supply availability
- Refers to the country as a whole - conceals regional and group differences
- Advantage: Cheaper and simpler than direct assessment
- Gives indication of general pattern of national food consumption
(b) Socio-economic Factors
- Family size, occupation, income, education, customs, cultural patterns, feeding practices of children and mothers - all influence food consumption patterns
(c) Health and Educational Services
- Primary health care services, feeding programmes, immunization programmes
(d) Conditioning Influences
- Parasitic, bacterial, and viral infections that precipitate malnutrition
- Requires an "ecological diagnosis" before prevention measures can be implemented
What Diet Survey Provides
- Information about dietary intake patterns
- Specific foods consumed
- Estimated nutrient intakes
- Indicates relative dietary inadequacies judged by present standards
- Valuable for planning health education activities
- Helps assess changes needed in agriculture and food production
Summary Table
| Method | Type | Level | Duration |
|---|---|---|---|
| Weighment of raw foods | Direct, prospective | Household | 7 days (1 dietary cycle) |
| Weighment of cooked foods | Direct, prospective | Household | Variable |
| Oral questionnaire (24-hr recall) | Direct, retrospective | Individual | Previous 24-48 hrs |
| Food balance sheet | Indirect | National | Periodic |
Note on "S PERNPARK": Park's textbook does NOT use this mnemonic. It simply lists the above methods under "Assessment of Dietary Intake" (Method 5 of the 7 assessment methods). The mnemonic is a coaching/notes-based teaching aid not present in the original textbook.
Park's Textbook of Preventive and Social Medicine, pp. 744-746
This is a shared conversation. Sign in to Orris to start your own chat.