Explain me 10 common heart disease with ecg changed and ecg images Of those diseases
Reading File
Finding Sources
Finding Sources
Searching Images
ECG electrocardiogram myocardial infarction ST elevation
Searching Images
ECG atrial fibrillation irregular rhythm absent P waves
Searching Images
ECG left bundle branch block LBBB wide QRS
Searching Images
ECG Wolff-Parkinson-White delta wave pre-excitation
Finding Sources
Finding Sources
Searching Images
ECG hypertrophic cardiomyopathy left ventricular hypertrophy deep Q waves
Searching Images
ECG pericarditis diffuse ST elevation saddle shape PR depression
Searching Images
ECG ventricular tachycardia wide complex tachycardia
Searching Images
ECG Brugada syndrome coved ST elevation V1 V2 right bundle branch block pattern
Searching Images
ECG long QT syndrome torsades de pointes QT prolongation
Searching Images
ECG third degree complete heart block atrioventricular dissociation
Here is a comprehensive guide to 10 common heart diseases, their ECG changes, and representative ECG images.
10 Common Heart Diseases: ECG Changes & Images
1. 🫀 ST-Elevation Myocardial Infarction (STEMI)
Disease Overview
STEMI results from complete occlusion of a coronary artery (most often the LAD, RCA, or LCx), causing transmural ischemia and necrosis of myocardium. It is a medical emergency requiring urgent reperfusion.
ECG Changes
| Feature | Finding |
|---|---|
| ST segments | Convex (tombstone) ST elevation ≥ 1 mm in ≥2 contiguous leads |
| Reciprocal changes | ST depression in opposing leads (e.g., inferior STEMI → ST depression in aVL) |
| Hyperacute T waves | Tall, peaked T waves in early infarction |
| Pathological Q waves | Develop within hours–days (>40 ms wide, >25% of R wave) |
| T-wave inversion | Appears during evolution |
Localisation:
- Anterior (V1–V4): LAD occlusion
- Inferior (II, III, aVF): RCA occlusion
- Lateral (I, aVL, V5–V6): LCx occlusion
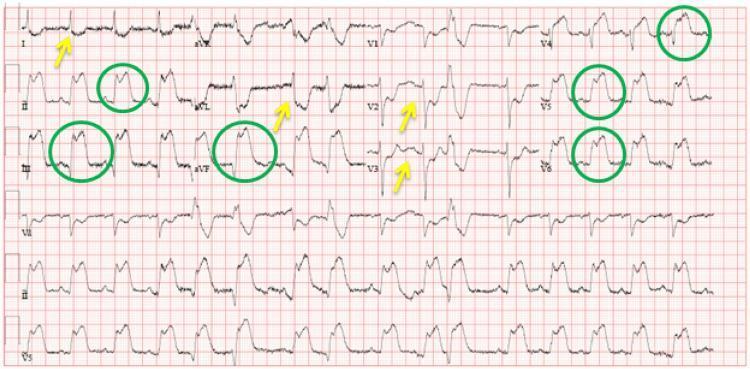
ECG Image — Anterior STEMI (LAD)
ECG Image — Anterolateral STEMI with Reciprocal Changes
2. 🫀 Non-ST-Elevation Myocardial Infarction (NSTEMI) / Unstable Angina
Disease Overview
NSTEMI involves partial occlusion or critical stenosis causing subendocardial ischemia without full-thickness infarction. Diagnosis requires elevated troponins with compatible ECG or symptoms. Unstable angina has the same ECG picture but without troponin rise.
ECG Changes
| Feature | Finding |
|---|---|
| ST depression | Horizontal or downsloping, ≥ 0.5 mm in ≥2 contiguous leads |
| T-wave inversion | Deep, symmetric in the distribution of ischemia |
| Transient ST changes | May resolve between episodes |
| Normal ECG | Present in up to 30% of NSTEMI cases |
| No ST elevation | Key differentiator from STEMI |
"The diagnosis of NSTEMI depends on abnormal elevation of cardiac biomarkers but may include ECG changes not meeting criteria for STEMI." — Tintinalli's Emergency Medicine
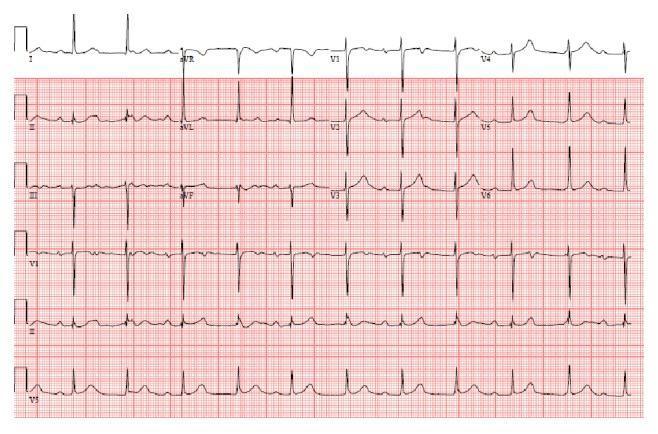
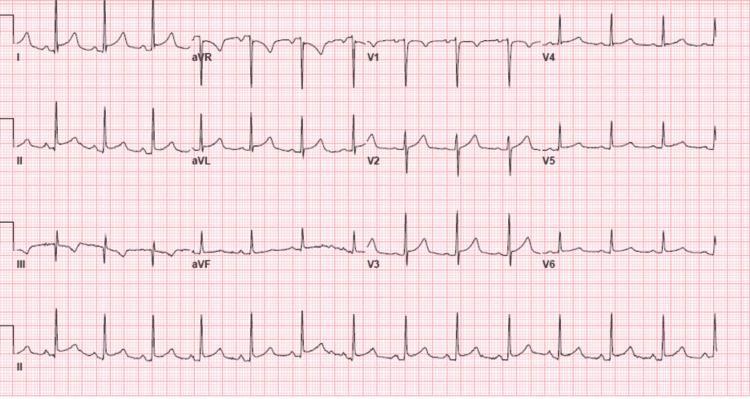
3. 🫀 Atrial Fibrillation (AF)
Disease Overview
AF is the most common sustained cardiac arrhythmia, caused by chaotic electrical activity in the atria. Risk factors include hypertension, heart failure, valvular disease, and thyrotoxicosis. It significantly increases stroke risk.
ECG Changes
| Feature | Finding |
|---|---|
| P waves | Absent — replaced by fine fibrillatory (f) waves at 350–600/min |
| RR intervals | Irregularly irregular |
| QRS morphology | Narrow (unless aberrant conduction or pre-existing BBB) |
| Ventricular rate | Uncontrolled: 100–160 bpm; controlled: 60–100 bpm |
| Baseline | Fibrillatory baseline most visible in V1 |
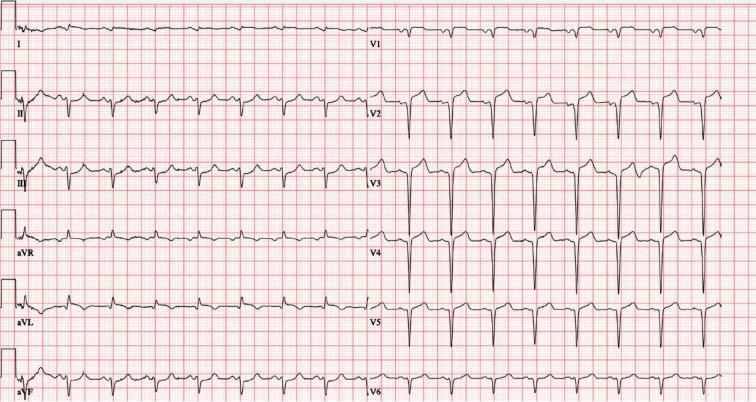
ECG Image — Atrial Fibrillation with Rapid Ventricular Response
4. 🫀 Complete (Third-Degree) Heart Block
Disease Overview
Complete AV block is a life-threatening conduction failure where no atrial impulses conduct to the ventricles. The atria and ventricles beat independently. Causes include inferior MI, myocarditis, drug toxicity, infiltrative disease, and congenital abnormality.
ECG Changes
| Feature | Finding |
|---|---|
| AV dissociation | P waves and QRS complexes march independently |
| Atrial rate | Normal (60–100/min), regular P-P intervals |
| Ventricular rate | Slow escape rhythm (20–50/min) |
| QRS morphology | Wide if ventricular escape; narrow if junctional escape |
| PR interval | No fixed relationship — varies beat to beat |
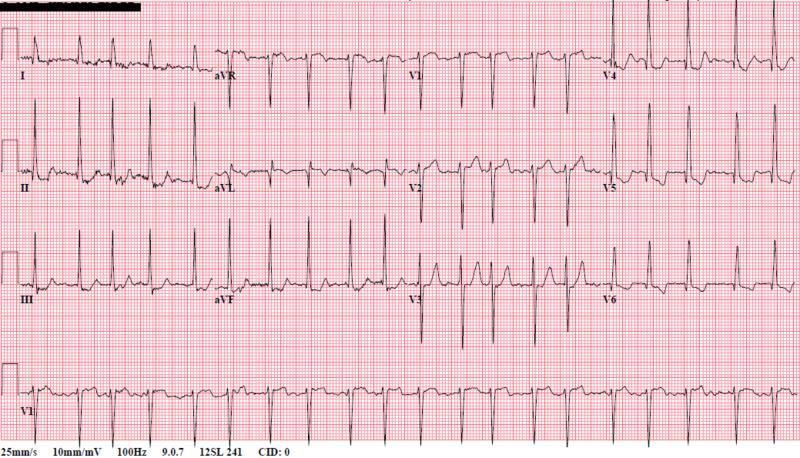
ECG Image — Complete Heart Block
ECG Image — Complete Heart Block (Narrow Junctional Escape)
5. 🫀 Left Bundle Branch Block (LBBB)
Disease Overview
LBBB is a conduction defect causing delayed activation of the left ventricle. It is associated with coronary artery disease, heart failure, cardiomyopathy, and hypertension. New LBBB in the context of chest pain should be treated as equivalent to STEMI (Sgarbossa criteria).
ECG Changes
| Feature | Finding |
|---|---|
| QRS duration | ≥ 120 ms (broad) |
| V1 | Broad, deep QS or rS pattern |
| V5–V6, I, aVL | Broad monophasic "M-shaped" R waves (no Q waves) |
| ST–T discordance | ST/T changes opposite to QRS direction (secondary repolarization) |
| Axis | Left or normal |
| No septal Q waves | Absent in I, V5, V6 |
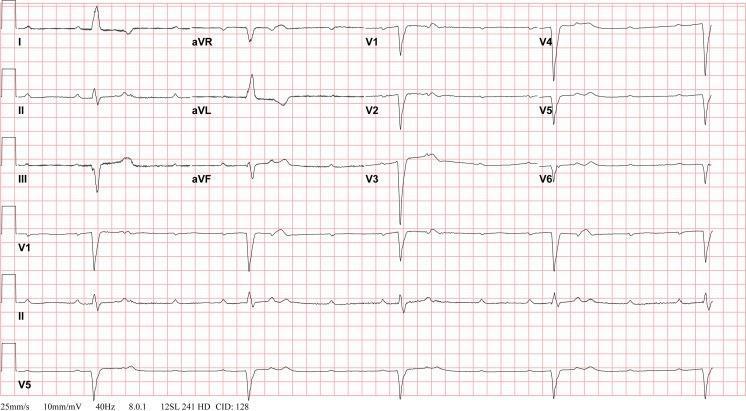
ECG Image — Classic LBBB
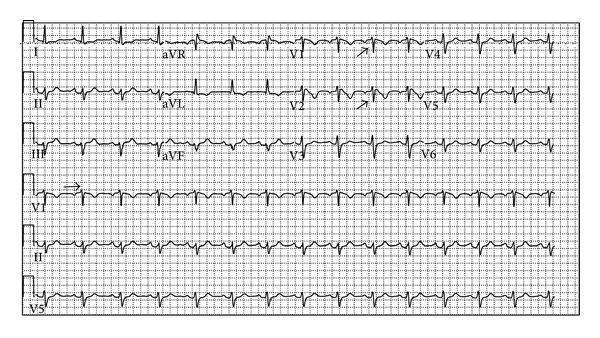
6. 🫀 Hypertrophic Cardiomyopathy (HCM)
Disease Overview
HCM is a genetic disorder (most commonly MYH7 or MYBPC3 mutations) causing asymmetric septal or apical hypertrophy. It is the leading cause of sudden cardiac death in young athletes. Obstruction of the LVOT may occur in ~70% of cases.
ECG Changes
| Feature | Finding |
|---|---|
| LVH voltage | Sokolow–Lyon criteria: SV1 + RV5 > 35 mm |
| Strain pattern | ST depression + T-wave inversion in lateral leads |
| Deep Q waves | Narrow septal Q waves in I, aVL, V5–V6 (septal HCM) |
| Giant T-wave inversions | Deep symmetric TWI in V2–V5 (apical HCM / Yamaguchi syndrome) |
| Left axis deviation | Common |
| AF | Occurs in 20–25% due to left atrial enlargement |
ECG Image — HCM with Septal Hypertrophy
ECG Image — Apical HCM (Yamaguchi Syndrome)
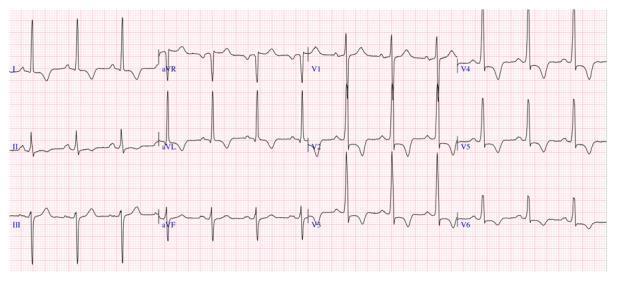
7. 🫀 Acute Pericarditis
Disease Overview
Pericarditis is inflammation of the pericardial sac, most commonly caused by viral infection (Coxsackie B, echovirus). It presents with pleuritic chest pain relieved by sitting forward. ECG changes are due to superficial myocardial inflammation.
ECG Changes (4 stages)
| Feature | Finding |
|---|---|
| Stage 1 (acute) | Diffuse concave ("saddle-shaped") ST elevation in all leads except aVR and V1 |
| PR depression | Highly specific — PR depression in II/lateral leads; PR elevation in aVR |
| Spodick's sign | Downsloping TP segment |
| Stage 2 | ST normalisation, T-wave flattening |
| Stage 3 | T-wave inversions |
| Stage 4 | Normalisation |
| Key distinction | No reciprocal ST depression (unlike STEMI), no Q waves |
ECG Image — Classic Acute Pericarditis

ECG Image — Pericarditis (Diffuse Pattern)
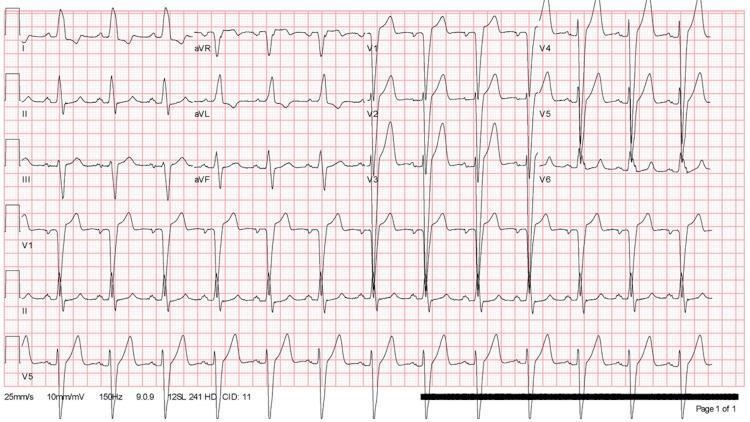
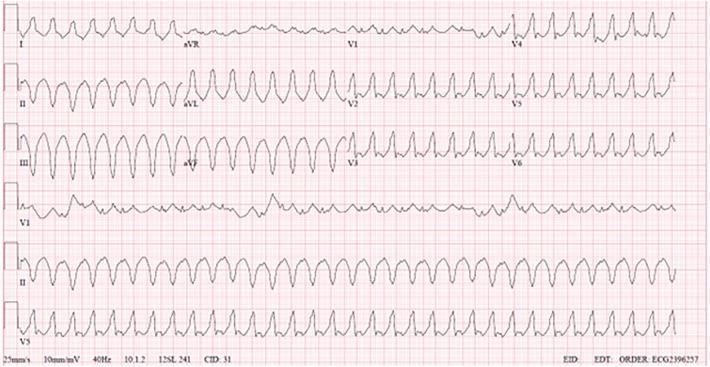
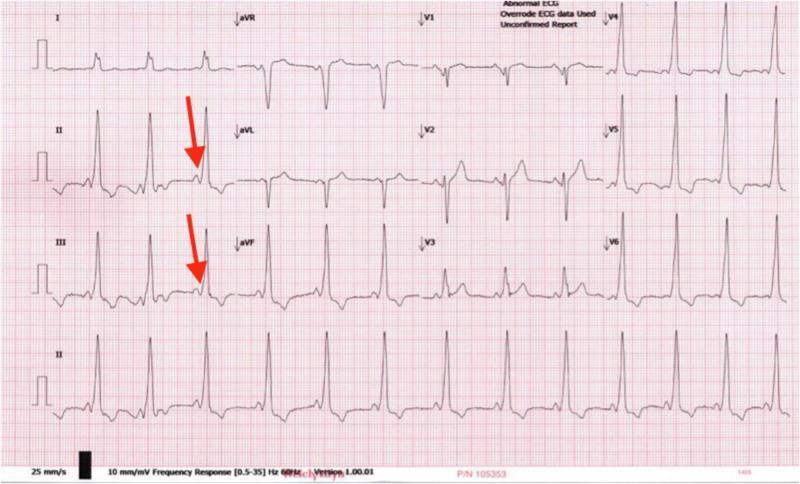
8. 🫀 Ventricular Tachycardia (VT)
Disease Overview
VT is a rapid ventricular rhythm (≥3 consecutive beats at ≥120 bpm) originating below the Bundle of His. It is associated with structural heart disease (post-MI scar, cardiomyopathy), and can degenerate into ventricular fibrillation and cardiac arrest.
ECG Changes
| Feature | Finding |
|---|---|
| Rate | 120–250 bpm |
| QRS | Wide (≥120 ms), bizarre morphology |
| Rhythm | Regular or slightly irregular |
| P waves | Absent or dissociated from QRS (AV dissociation) |
| Fusion/capture beats | Pathognomonic for VT |
| Concordance | All V1–V6 deflections in same direction |
| Axis | Often extreme ("northwest" axis) |
ECG Image — Monomorphic Ventricular Tachycardia
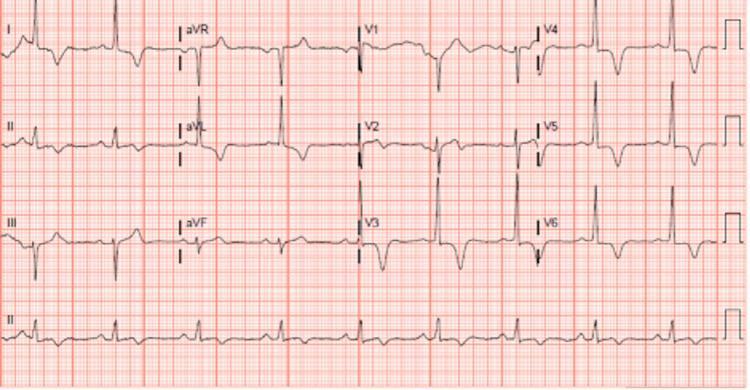
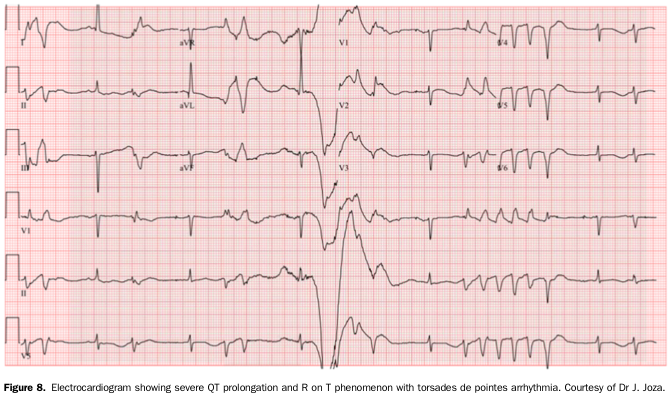
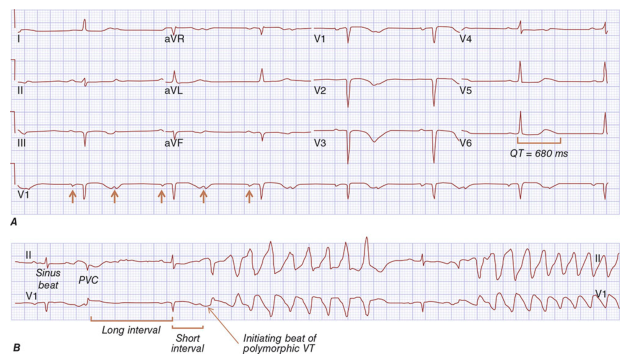
9. 🫀 Long QT Syndrome (LQTS)
Disease Overview
LQTS is a repolarization disorder (congenital or acquired) causing QT prolongation and life-threatening polymorphic VT known as Torsades de Pointes (TdP). Congenital forms involve mutations in cardiac ion channel genes (KCNQ1, KCNH2, SCN5A). Acquired causes include drugs (antiarrhythmics, antipsychotics), hypokalemia, and hypomagnesemia.
ECG Changes
| Feature | Finding |
|---|---|
| QTc prolongation | QTc > 450 ms (men), > 460 ms (women); severe: > 500 ms |
| T-wave morphology | Broad/bifid T waves (LQT1), biphasic T waves (LQT2), late-onset T waves (LQT3) |
| U waves | Prominent in V2–V3 (LQT1) |
| Torsades de Pointes | Polymorphic VT — QRS complexes "twisting" around isoelectric line |
| Bradycardia | Often triggers TdP (pause-dependent) |
ECG Image — Long QT with Torsades de Pointes
ECG Image — Baseline LQTS with Prolonged QTc
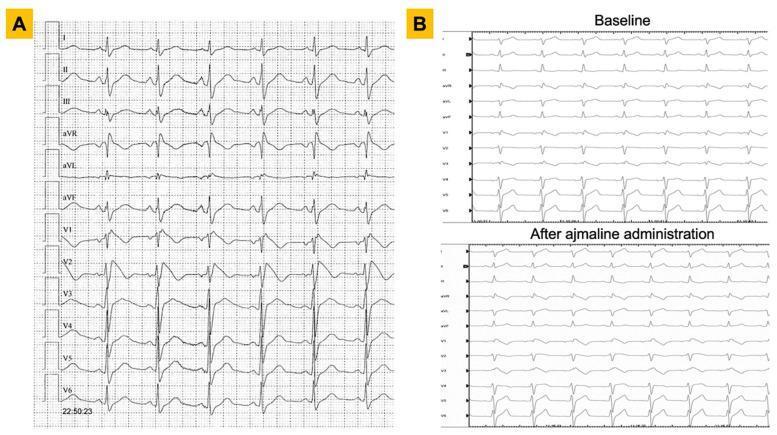
10. 🫀 Brugada Syndrome
Disease Overview
Brugada syndrome is an inherited sodium channelopathy (SCN5A mutation in ~20%) causing a characteristic ECG pattern and risk of sudden cardiac death from ventricular fibrillation. It predominantly affects young males of Southeast Asian descent. The ECG pattern may be intermittent and can be unmasked by sodium channel blockers (ajmaline, flecainide), fever, or vagotonic states.
ECG Changes
| Feature | Finding |
|---|---|
| Type 1 (diagnostic) | Coved ST elevation ≥ 2 mm in V1–V2, descending to inverted T wave — spontaneous or drug-induced |
| Type 2 | Saddle-back ST elevation ≥ 0.5 mm in V1–V2 (not diagnostic alone) |
| RBBB-like pattern | Pseudo-RBBB appearance in V1 |
| Leads affected | V1–V2 (or V1–V3 when high leads placed at 3rd/2nd intercostal space) |
| PR interval | Often prolonged (first-degree block) |
| Spontaneous VF | May occur, especially at night or with fever |
ECG Image — Type 1 Brugada Pattern
ECG Image — Brugada: Baseline vs. Ajmaline Challenge
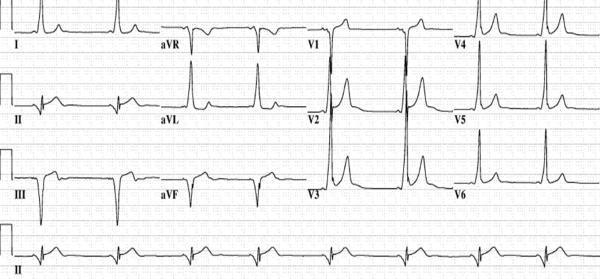
11. 🫀 Wolff-Parkinson-White (WPW) Syndrome
Disease Overview
WPW involves an accessory pathway (Bundle of Kent) bypassing the AV node, causing ventricular pre-excitation. It can trigger SVT (AVRT), and in AF with rapid antegrade conduction through the accessory pathway, it can degenerate into VF. Radiofrequency catheter ablation is curative.
ECG Changes
| Feature | Finding |
|---|---|
| Short PR interval | < 120 ms (accelerated AV conduction) |
| Delta wave | Slurred upstroke at the beginning of QRS |
| Wide QRS | ≥ 120 ms (due to pre-excitation fusion) |
| ST–T changes | Secondary to abnormal depolarization |
| Pseudo-infarct Q waves | Negative delta waves in inferior/lateral leads mimic pathological Q waves |
| AVRT tachycardia | Narrow complex (orthodromic) or wide complex (antidromic) |
ECG Image — Classic WPW
ECG Image — WPW with Posteroseptal Pathway
Summary Table
| # | Disease | Key ECG Features |
|---|---|---|
| 1 | STEMI | ST elevation ≥1 mm in ≥2 contiguous leads + reciprocal depression + Q waves |
| 2 | NSTEMI/UA | ST depression, T-wave inversion — no ST elevation, no Q waves |
| 3 | Atrial Fibrillation | Absent P waves, irregularly irregular rhythm, fibrillatory baseline |
| 4 | Complete Heart Block | AV dissociation, slow escape rhythm, wide or narrow QRS |
| 5 | LBBB | QRS ≥120 ms, M-shaped R in V5–V6/I, deep QS in V1, discordant ST–T |
| 6 | HCM | LVH voltage, lateral strain, deep Q waves or giant T inversions (apical) |
| 7 | Acute Pericarditis | Diffuse saddle ST elevation, PR depression, no reciprocal changes |
| 8 | Ventricular Tachycardia | Wide complex tachycardia, AV dissociation, fusion/capture beats |
| 9 | Long QT Syndrome | QTc >450–460 ms, broad/bifid T waves, risk of Torsades de Pointes |
| 10 | Brugada Syndrome | Coved ST elevation V1–V2, pseudo-RBBB, spontaneous or drug-induced |
| 11 | WPW Syndrome | Short PR, delta wave, wide QRS, secondary ST–T changes |
Sources: Harrison's Principles of Internal Medicine 22E (2025); Tintinalli's Emergency Medicine; Ganong's Review of Medical Physiology; Braunwald's Heart Disease; Washington Manual of Medical Therapeutics
This is a shared conversation. Sign in to Orris to start your own chat.