Explain heart avxvy cycle
Reading File
Finding Sources
Searching Images
cardiac cycle phases pressure volume diagram
Reading File
Reading File
Reading File
Loading Image
Here is a comprehensive explanation of the cardiac cycle — the sequence of mechanical and electrical events that occur with each heartbeat, from the beginning of one beat to the beginning of the next.
The Cardiac Cycle
The cardiac cycle encompasses all events that occur during a single heartbeat. At a normal resting heart rate of 72 beats/min, one cycle lasts approximately 0.833 seconds. It is initiated by a spontaneous action potential in the sinoatrial (SA) node in the right atrium, which propagates through both atria, then through the AV bundle into the ventricles (with a >0.1 second delay at the AV node to allow atrial contraction to prime the ventricles before ventricular contraction begins).
The cycle is divided into two broad phases — systole (contraction) and diastole (relaxation) — and can be broken down further into seven distinct phases:
Phase A — Atrial Systole
- Trigger: P wave on ECG (atrial depolarization)
- The atria contract, increasing left atrial pressure
- This pushes additional blood into the already-filling ventricle through the open mitral valve
- Ventricular volume reaches its maximum → end-diastolic volume (EDV)
- Reflected in the venous pulse as the "a" wave
- S4 heart sound (not audible in normal adults; heard in reduced ventricular compliance)
Phase B — Isovolumetric Ventricular Contraction
- Trigger: QRS complex on ECG (ventricular depolarization)
- Ventricles begin contracting; ventricular pressure rises sharply
- Mitral valve closes (ventricular pressure exceeds atrial pressure) → produces S1 heart sound
- Aortic valve has not yet opened (ventricular pressure < aortic pressure)
- All valves are closed → ventricular volume is constant (no blood can enter or leave)
- This phase ends when LV pressure rises above aortic pressure
Phase C — Rapid Ventricular Ejection
- Trigger: ST segment on ECG
- Ventricular pressure exceeds aortic pressure → aortic valve opens
- Blood is rapidly ejected into the aorta
- Ventricular pressure reaches its peak (~120 mmHg)
- Aortic pressure rises to its peak (systolic BP ~120 mmHg)
- Ventricular volume decreases rapidly
Phase D — Reduced Ventricular Ejection
- Trigger: T wave on ECG (ventricular repolarization begins)
- Ejection continues but at a slower rate
- Ventricular volume reaches its minimum → end-systolic volume (ESV)
- Aortic pressure begins to fall as blood runs off into the peripheral arteries
- The difference between EDV and ESV = stroke volume
Phase E — Isovolumetric Ventricular Relaxation
- Ventricles relax; ventricular pressure falls rapidly below aortic pressure
- Aortic valve closes → produces S2 heart sound (the "dub")
- The dicrotic notch appears on the aortic pressure tracing at valve closure
- Mitral valve has not yet opened (ventricular pressure > atrial pressure)
- All valves are closed → ventricular volume is again constant
Phase F — Rapid Ventricular Filling
- Ventricular pressure falls below left atrial pressure → mitral valve opens
- Blood rushes passively from the atrium into the ventricle
- Ventricular volume increases rapidly
- S3 heart sound (normal in children; abnormal in adults → suggests volume overload / heart failure)
Phase G — Reduced Ventricular Filling (Diastasis)
- Filling continues at a slower rate
- Pressure gradient between atrium and ventricle is nearly equalized
- Cycle ends and restarts with the next atrial systole (Phase A)
Pressure–Volume Loop
The cardiac cycle can also be visualized as a pressure–volume (PV) loop:
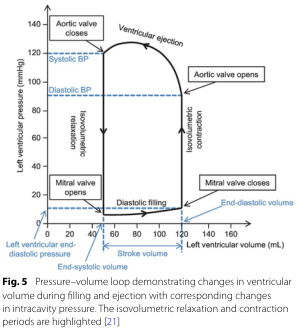
Key points on the loop:
- Bottom right → end-diastole (high volume, low pressure; mitral valve closes)
- Top right → aortic valve opens; ejection begins
- Top left → end-systole (low volume, high pressure; aortic valve closes)
- Bottom left → mitral valve opens; diastolic filling begins
- Horizontal width of the loop = stroke volume (~70 mL at rest)
Summary Table
| Phase | Valves | ECG | Heart Sound |
|---|---|---|---|
| A – Atrial systole | Mitral open | P wave | S4 (if present) |
| B – Isovolumetric contraction | All closed | QRS | S1 |
| C – Rapid ejection | Aortic open | ST segment | — |
| D – Reduced ejection | Aortic open | T wave | — |
| E – Isovolumetric relaxation | All closed | — | S2 |
| F – Rapid filling | Mitral open | — | S3 (if present) |
| G – Diastasis | Mitral open | — | — |
Key numbers to remember:
- Normal EDV: ~120–130 mL
- Normal ESV: ~50–60 mL
- Stroke volume: ~70 mL
- Ejection fraction (EF): ~55–65%
- Systole lasts ~0.4 of the cycle at 72 bpm; diastole is longer, allowing ventricular filling
Sources: Costanzo Physiology 7th Edition, p. 160 | Guyton and Hall Textbook of Medical Physiology
Explain JVP graph
Finding Sources
Searching Images
jugular venous pulse JVP waveform a c v x y waves
Finding Sources
Loading Image
Reading File
Reading File
Finding Sources
Reading File
Reading File
Here is a thorough explanation of the Jugular Venous Pulse (JVP) graph and its components.
Jugular Venous Pulse (JVP)
The JVP waveform is a graphical representation of pressure changes in the right atrium, visible as pulsations in the internal jugular vein (IJV). It is best seen in the IJV (not the external jugular vein) and reflects right-sided cardiac events.
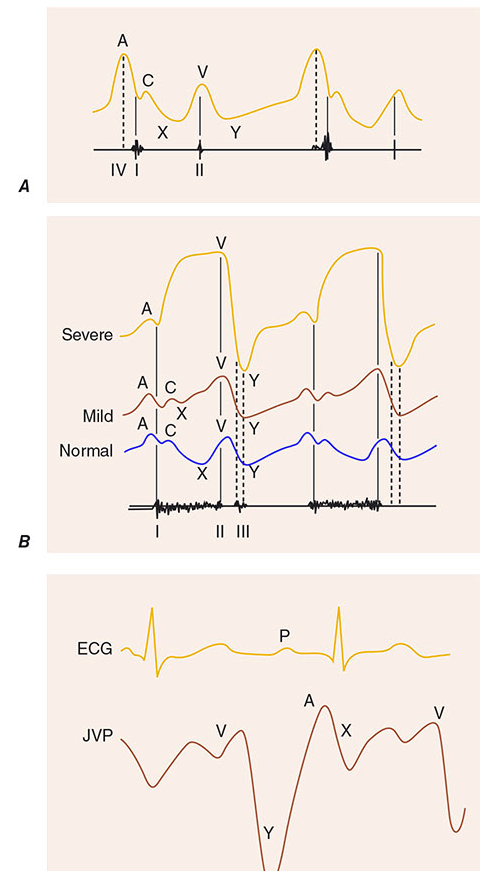
The Five Components
Peaks (Positive Waves)
A wave
- Cause: Right atrial presystolic contraction
- Timing: Occurs just after the P wave on ECG, just before S1
- The atria contract and push blood into the right ventricle through the open tricuspid valve, causing a brief rise in atrial pressure
- Absent in: Atrial fibrillation (no coordinated atrial contraction)
- Exaggerated ("prominent a wave") in: Reduced right ventricular compliance (e.g., pulmonary hypertension, pulmonary stenosis, RV hypertrophy) — atrium must work harder to fill a stiff ventricle
- Cannon a wave: Atrium contracts against a closed tricuspid valve (as in complete heart block or ventricular tachycardia with AV dissociation) → massive a wave
C wave
- Cause: Bulging of the tricuspid valve back into the right atrium during early ventricular systole (isovolumetric contraction), and to some extent from transmitted carotid artery pulsation
- Timing: Occurs just after S1
- Small and often not visible clinically — it interrupts the x descent
V wave
- Cause: Passive venous filling of the right atrium while the tricuspid valve is closed during ventricular systole
- Timing: Peaks at the second heart sound (S2)
- Represents atrial diastole — blood accumulates in the right atrium from the vena cavae with nowhere to go
- Exaggerated in: Tricuspid regurgitation (TR) — blood leaks back from the RV into the RA during systole, causing a large V wave ("ventriculization" of the JVP in severe TR)
Descents (Negative Troughs)
X descent
- Cause: Fall in right atrial pressure due to:
- Atrial relaxation after contraction
- Downward displacement of the tricuspid valve during ventricular systole
- Timing: Occurs after the A wave and c wave (the c wave briefly interrupts it, creating x and x′)
- Blunted/absent in: Atrial fibrillation, tricuspid regurgitation
- Exaggerated in: Cardiac tamponade (both x and y are affected, but x is predominant)
Y descent
- Cause: Tricuspid valve opens at the end of ventricular systole → blood rushes from RA into RV → rapid fall in RA pressure
- Timing: Follows the peak of the V wave
- Blunted/slow y descent in: Tricuspid stenosis, cardiac tamponade (obstruction to RV filling)
- Steep/rapid y descent in: Tricuspid regurgitation, constrictive pericarditis
Timing Correlated with the Cardiac Cycle
| JVP Component | Cardiac Event | ECG Marker |
|---|---|---|
| A wave | Atrial contraction | After P wave |
| C wave | Tricuspid valve bulge into RA | After QRS (S1) |
| X descent | Atrial relaxation + tricuspid descent | ST segment |
| V wave | Venous filling of RA (tricuspid closed) | T wave → S2 |
| Y descent | Tricuspid valve opens; RV fills | After S2 |
Measuring JVP
- Patient positioned at 45°; the height of venous pulsation above the sternal angle of Louis is measured
- Normal JVP = ≤3–4 cm above the sternal angle (≈ 8–9 cm H₂O total, adding 5 cm for distance from sternal angle to RA)
- Elevated JVP (>4 cm above sternal angle) suggests raised right atrial pressure (e.g., right heart failure, cardiac tamponade, constrictive pericarditis, fluid overload)
Key Abnormalities
| Condition | JVP Pattern |
|---|---|
| Atrial fibrillation | No A wave |
| Complete heart block / VT | Cannon A waves (irregular) |
| Tricuspid regurgitation | Large V wave; steep Y descent |
| Tricuspid stenosis | Large A wave; slow Y descent |
| Cardiac tamponade | Elevated JVP; prominent X descent; blunted Y descent |
| Constrictive pericarditis | Elevated JVP; steep X and Y descents ("W" or "M" pattern); Kussmaul's sign |
| Pulmonary hypertension / RV hypertrophy | Prominent A wave |
Kussmaul's sign: A rise (or failure to fall) of JVP on inspiration — opposite of normal. Classically seen in constrictive pericarditis, also in restrictive cardiomyopathy, massive PE, and RV infarction.
Key distinction from the carotid pulse:
- JVP is biphasic (two peaks: A and V); carotid is monophasic
- JVP is non-palpable; carotid is palpable
- JVP changes with posture and respiration; carotid does not
- JVP is obliterated by gentle pressure at the base of the neck; carotid is not
Sources: Harrison's Principles of Internal Medicine 22E, p. 1904 | Goldman-Cecil Medicine, p. 391 | Fuster and Hurst's The Heart, 15th Edition
This is a shared conversation. Sign in to Orris to start your own chat.