
Teach me everything abt metablboic acidosis and alkaosis and anion gap best of ur knowledge and simple from.harrison
anion gap metabolic acidosis causes diagram
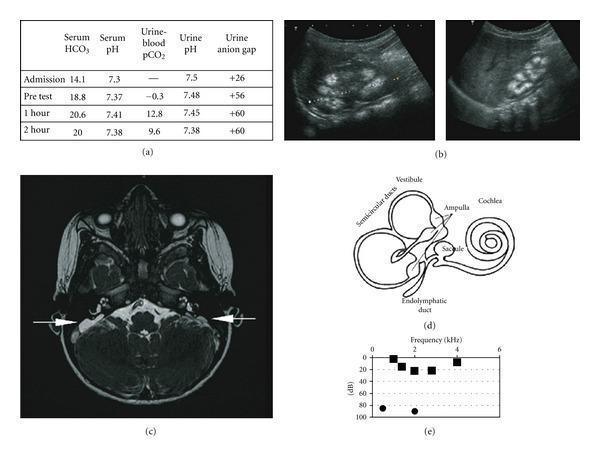
This composite educational image illustrates the clinical and diagnostic features of distal renal tubular acidosis (dRTA) associated with sensorineural hearing loss. (a) Data table showing results of a bicarbonate loading test, characterized by low urine-to-blood pCO2 gradient and positive urinary anion gap. (b) Renal ultrasound images of the left and right kidneys demonstrating medullary nephrocalcinosis, visualized as multiple hyperechoic foci within the renal pyramids. (c) Axial FIESTA (Fast Imaging Employing Steady-state Acquisition) cerebral MRI scan showing bilateral enlargement of the endolymphatic sacs (indicated by white arrows), a common finding in Pendred syndrome or dRTA with hearing loss. (d) Anatomical schematic of the inner ear, labeling the cochlea, vestibule, semicircular ducts, and endolymphatic duct. (e) Audiogram plot showing frequency (kHz) versus decibels (dB), depicting significant hearing impairment. The collection integrates metabolic laboratory data, diagnostic radiology (ultrasound and MRI), and functional audiological testing to present a comprehensive case of a hereditary renal-otological syndrome.
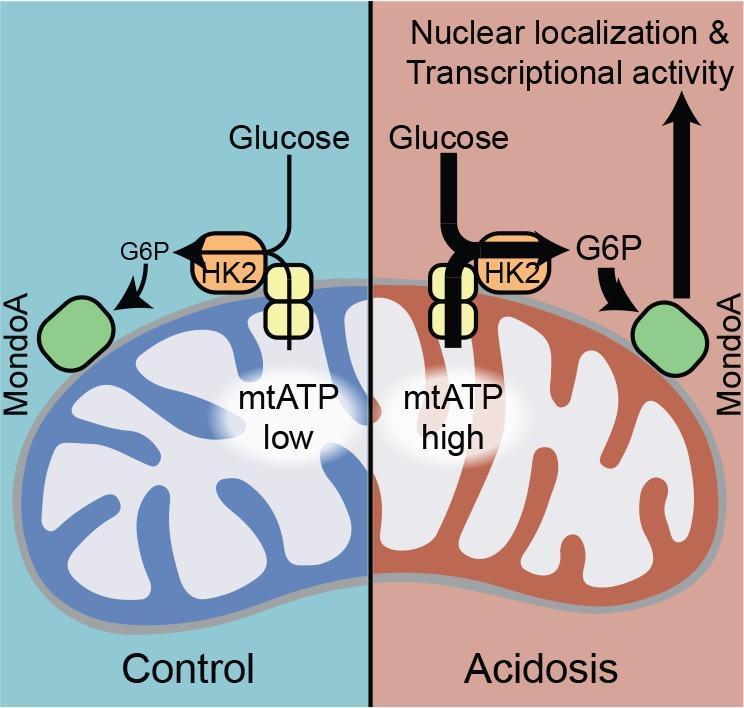
This pathophysiology diagram illustrates the cellular mechanism by which acidosis regulates MondoA transcriptional activity. The schematic is divided into two comparative states: 'Control' (blue background) and 'Acidosis' (red background). Key components include a mitochondrion, Hexokinase 2 (HK2), the MondoA protein, and metabolic intermediates glucose and glucose-6-phosphate (G6P). Under control conditions, mitochondrial ATP (mtATP) levels are low, and HK2 is bound to the outer mitochondrial membrane. Glucose is converted to G6P by HK2, resulting in basal MondoA interaction. In the 'Acidosis' state, a shift in pH drives a significant increase in mtATP production. This high mtATP concentration facilitates enhanced HK2 enzymatic activity at the mitochondrial surface, leading to increased production of G6P. The elevated G6P levels trigger MondoA to undergo nuclear localization and increased transcriptional activity, as indicated by a large upward arrow toward the nucleus. This diagram demonstrates how metabolic sensing of mitochondrial energy charge and cytoplasmic glucose levels are integrated via HK2 to control gene expression under conditions of metabolic stress or altered pH.
![This physiological diagram illustrates the metabolic and inflammatory response during Blood Flow Restriction (BFR) training on the human thigh. A compression cuff is shown positioned on the proximal thigh, labeled with an upward arrow and the text 'Ischemic/Hypoxic' to indicate the restriction of blood flow and oxygen. Within the quadriceps region, multiple 'H+' symbols denote an increase in hydrogen ion concentration, reflecting intramuscular acidosis. On the distal thigh, a group of metabolic markers summarizes the endocrine and inflammatory cascade: '[La]' (lactate) and 'GH' (growth hormone) are associated with an upward arrow pointing toward 'IL-6' (interleukin-6), indicating an increase in these pro-inflammatory/hypertrophic signals. Conversely, 'Glycogen' is shown with a downward arrow, representing substrate depletion. The graphic serves as a conceptual model for exercise physiology, demonstrating how localized metabolic stress, hypoxia, and inflammatory cytokine production contribute to muscle hypertrophy during low-intensity strength training with vascular occlusion.](https://cdn.orris.care/cdss_images/pmc_clinical_VQA_ff6b2d6a213a1d8c32cabeb0c46972c0cdd104750a8ec6c7a24aa9554a806ee4.jpg)
This physiological diagram illustrates the metabolic and inflammatory response during Blood Flow Restriction (BFR) training on the human thigh. A compression cuff is shown positioned on the proximal thigh, labeled with an upward arrow and the text 'Ischemic/Hypoxic' to indicate the restriction of blood flow and oxygen. Within the quadriceps region, multiple 'H+' symbols denote an increase in hydrogen ion concentration, reflecting intramuscular acidosis. On the distal thigh, a group of metabolic markers summarizes the endocrine and inflammatory cascade: '[La]' (lactate) and 'GH' (growth hormone) are associated with an upward arrow pointing toward 'IL-6' (interleukin-6), indicating an increase in these pro-inflammatory/hypertrophic signals. Conversely, 'Glycogen' is shown with a downward arrow, representing substrate depletion. The graphic serves as a conceptual model for exercise physiology, demonstrating how localized metabolic stress, hypoxia, and inflammatory cytokine production contribute to muscle hypertrophy during low-intensity strength training with vascular occlusion.
metabolic alkalosis causes treatment
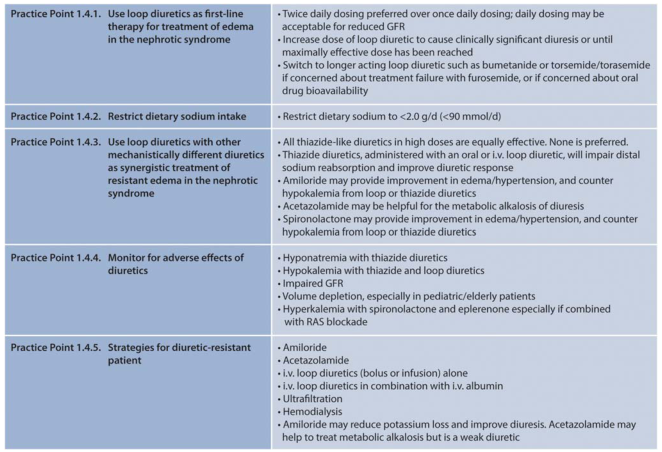
<table><thead><tr><th>Practice Point 1.4.1. Use loop diuretics as first-line therapy for treatment of edema in the nephrotic syndrome</th><th>• Twice daily dosing preferred over once daily dosing; daily dosing may be acceptable for reduced GFR • Increase dose of loop diuretic to cause clinically significant diuresis or until maximally effective dose has been reached • Switch to longer acting loop diuretic such as bumetanide or torsemide/torasemide if concerned about treatment failure with furosemide, or if concerned about oral drug bioavailability</th></tr></thead><tbody><tr><td>Practice Point 1.4.2. Restrict dietary sodium intake</td><td>• Restrict dietary sodium to <2.0 g/d (<90 mmol/d)</td></tr><tr><td>Practice Point 1.4.3. Use loop diuretics with other mechanistically different diuretics as synergistic treatment of resistant edema in the nephrotic syndrome</td><td>• All thiazide-like diuretics in high doses are equally effective. None is preferred. • Thiazide diuretics, administered with an oral or i.v. loop diuretic, will impair distal sodium reabsorption and improve diuretic response • Amiloride may provide improvement in edema/hypertension, and counter hypokalemia from loop or thiazide diuretics • Acetazolamide may be helpful for the metabolic alkalosis of diuresis • Spironolactone may provide improvement in edema/hypertension, and counter hypokalemia from loop or thiazide diuretics</td></tr><tr><td>Practice Point 1.4.4. Monitor for adverse effects of diuretics</td><td>• Hyponatremia with thiazide diuretics • Hypokalemia with thiazide and loop diuretics • Impaired GFR • Volume depletion, especially in pediatric/elderly patients • Hyperkalemia with spironolactone and eplerenone especially if combined with RAS blockade</td></tr><tr><td>Practice Point 1.4.5. Strategies for diuretic-resistant patient</td><td>• Amiloride • Acetazolamide • i.v. loop diuretics (bolus or infusion) alone • i.v. loop diuretics in combination with i.v. albumin • Ultrafiltration • Hemodialysis • Amiloride may reduce potassium loss and improve diuresis. Acetazolamide may help to treat metabolic alkalosis but is a weak diuretic</td></tr></tbody></table>
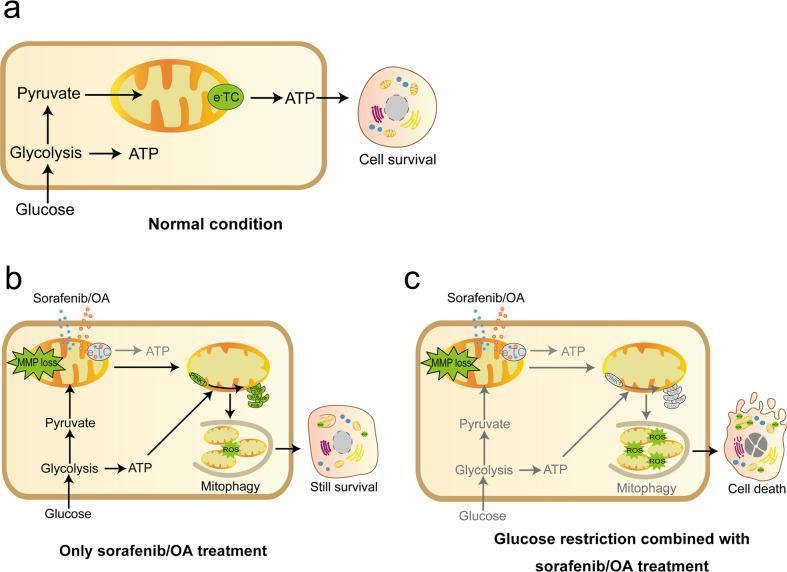
This pathophysiology diagram illustrates the metabolic mechanisms and survival outcomes of hepatocellular carcinoma (HCC) cells under three different experimental conditions. Panel A (Normal condition) shows healthy cellular metabolism where glucose enters the cell, undergoing glycolysis to produce ATP and pyruvate. Pyruvate enters the mitochondria, powering the electron transport chain (eTC) for further ATP generation, resulting in cell survival. Panel B (Only sorafenib/OA treatment) depicts the effect of electron transport chain inhibitors (sorafenib or oligomycin/antimycin). This treatment causes mitochondrial membrane potential (MMP) loss and impairs mitochondrial ATP production. However, glycolysis remains active, generating sufficient ATP to support PINK1-mediated mitophagy. Mitophagy eliminates damaged mitochondria and prevents reactive oxygen species (ROS) accumulation, allowing continued cell survival. Panel C (Glucose restriction combined with sorafenib/OA treatment) demonstrates the synergistic effect of inhibiting both energy pathways. Glucose restriction abolishes glycolysis-derived ATP, which in turn prevents the activation of mitophagy despite mitochondrial damage. This leads to excessive ROS accumulation, extensive mitochondrial failure, and clinical cell death. This diagram highlights the importance of targeting dual metabolic pathways in HCC therapy.
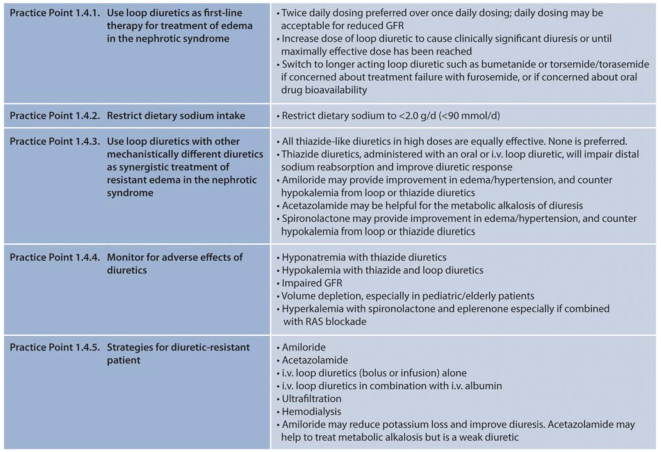
<table><tr><td>Practice Point 1.4.1. Use loop diuretics as first-line therapy for treatment of edema in the nephrotic syndrome</td><td>• Twice daily dosing preferred over once daily dosing; daily dosing may be acceptable for reduced GFR<br>• Increase dose of loop diuretic to cause clinically significant diuresis or until maximally effective dose has been reached<br>• Switch to longer acting loop diuretic such as bumetanide or torsemide/torasemide if concerned about treatment failure with furosemide, or if concerned about oral drug bioavailability</td></tr><tr><td>Practice Point 1.4.2. Restrict dietary sodium intake</td><td>• Restrict dietary sodium to <2.0 g/d (<90 mmol/d)</td></tr><tr><td>Practice Point 1.4.3. Use loop diuretics with other mechanistically different diuretics as synergistic treatment of resistant edema in the nephrotic syndrome</td><td>• All thiazide-like diuretics in high doses are equally effective. None is preferred.<br>• Thiazide diuretics, administered with an oral or i.v. loop diuretic, will impair distal sodium reabsorption and improve diuretic response<br>• Amiloride may provide improvement in edema/hypertension, and counter hypokalemia from loop or thiazide diuretics<br>• Acetazolamide may be helpful for the metabolic alkalosis of diuresis<br>• Spironolactone may provide improvement in edema/hypertension, and counter hypokalemia from loop or thiazide diuretics</td></tr><tr><td>Practice Point 1.4.4. Monitor for adverse effects of diuretics</td><td>• Hyponatremia with thiazide diuretics<br>• Hypokalemia with thiazide and loop diuretics<br>• Impaired GFR<br>• Volume depletion, especially in pediatric/elderly patients<br>• Hyperkalemia with spironolactone and eplerenone especially if combined with RAS blockade</td></tr><tr><td>Practice Point 1.4.5. Strategies for diuretic-resistant patient</td><td>• Amiloride<br>• Acetazolamide<br>• i.v. loop diuretics (bolus or infusion) alone<br>• i.v. loop diuretics in combination with i.v. albumin<br>• Ultrafiltration<br>• Hemodialysis<br>• Amiloride may reduce potassium loss and improve diuresis. Acetazolamide may help to treat metabolic alkalosis but is a weak diuretic</td></tr></table>
Metabolic Acidosis, Metabolic Alkalosis & the Anion Gap
From Harrison's Principles of Internal Medicine, 22nd Edition (2025)
1. NORMAL ACID-BASE HOMEOSTASIS (The Foundation)
- Extracellular and intracellular chemical buffers
- Respiratory control of PaCO₂ (by CNS/lungs)
- Renal control of plasma HCO₃⁻
pH = 6.1 + log₁₀ [HCO₃⁻ / (0.03 × PaCO₂)]
2. THE ANION GAP - The Most Important Concept First
What is it?
AG = Na⁺ - (Cl⁻ + HCO₃⁻)
Why does an AG exist?
- Anionic proteins (mainly albumin - the most important!)
- Phosphate
- Sulfate
- Organic anions
What raises the AG?
What lowers the AG?
- Increase in unmeasured cations (Ca²⁺, Mg²⁺, K⁺)
- Addition of abnormal cations: lithium (toxicity), cationic immunoglobulins (myeloma)
- Decreased albumin - hypoalbuminemia is the most common cause of a low or falsely normal AG (nephrotic syndrome, liver disease, malabsorption)
- Hyperviscosity, severe hyperlipidemia (lab artifact)
Critical Point - Albumin Correction!
Corrected AG = Measured AG + 2.5 × (4.5 - patient albumin)
3. METABOLIC ACIDOSIS
Definition
Compensation - Winter's Equation
Expected PaCO₂ = (1.5 × [HCO₃⁻]) + 8 ± 2
- If actual PaCO₂ < 24: superimposed respiratory alkalosis
- If actual PaCO₂ > 28: superimposed respiratory acidosis
THE TWO BIG CATEGORIES
3A. HIGH ANION GAP METABOLIC ACIDOSIS
| Cause | Key Mechanism |
|---|---|
| Ketoacidosis (diabetic, alcoholic, starvation) | Beta-hydroxybutyrate + acetoacetate accumulate |
| Lactic acidosis (Type A & B) | L-lactate or D-lactate accumulates |
| Uremia (advanced CKD) | Sulfate, phosphate, urate, hippurate accumulate |
| Toxic alcohols - methanol | Formate accumulation |
| Toxic alcohols - ethylene glycol | Oxalate/glycolate accumulation |
| Isopropyl alcohol | NOT acidosis (no anion generated); ketosis without acidosis |
| Salicylates (ASA) | Salicylate anion + lactic acid |
| Pyroglutamic acid (5-oxoprolinuria) | Paracetamol + malnutrition |
Lactic Acidosis - Two Types
- Type A: Tissue hypoperfusion (shock, cardiac arrest, severe anemia, severe hypoxia)
- Type B: No tissue hypoperfusion (liver disease, metformin toxicity, HIV antiretrovirals, malignancy, thiamine deficiency, D-lactic acidosis from short bowel syndrome)
Delta-Delta Ratio (ΔAG / ΔHCO₃⁻)
- Normally if 1 mmol of acid is added, AG rises by 1 and HCO₃⁻ falls by 1: ΔAG ≈ ΔHCO₃⁻
- ΔAG >> ΔHCO₃⁻ (ratio >2): a concurrent metabolic alkalosis is present (less HCO₃⁻ consumed than expected)
- ΔAG << ΔHCO₃⁻ (ratio <1): a concurrent normal-AG acidosis is also present (more HCO₃⁻ consumed than explained by the gap)
Example from Harrison's: Na 140, K 3.0, Cl 95, HCO₃⁻ 25, AG 20, pH 7.42 → ΔAG = 10, ΔHCO₃⁻ = 0 → mixed high-AG acidosis + metabolic alkalosis (e.g., uremia with vomiting)
Treatment of High-AG Metabolic Acidosis
- DKA: insulin + IV fluids
- Lactic acidosis Type A: restore perfusion
- Toxic alcohols: fomepizole or ethanol; hemodialysis for severe cases
- Uremia: dialysis
- pH < 7.1-7.15 with hemodynamic instability
- Hyperkalemia
- Salicylate or tricyclic antidepressant poisoning (urinary/plasma alkalinization)
3B. NORMAL (NON) ANION GAP METABOLIC ACIDOSIS
1. Gastrointestinal Losses
- Diarrhea (most common): stool HCO₃⁻ > plasma HCO₃⁻
- Fistulae: pancreatic, biliary, small bowel
2. Renal Tubular Acidosis (RTA)
| Type | Defect | Urine pH | Serum K⁺ | Key Features |
|---|---|---|---|---|
| Type 1 (Distal) | Failure to secrete H⁺ in distal tubule | >5.5 (always) | Low | Nephrocalcinosis, nephrolithiasis |
| Type 2 (Proximal) | Failure to reabsorb HCO₃⁻ | <5.5 (when serum HCO₃⁻ is very low) | Low | Fanconi syndrome; urine pH rises >5.5 with alkali therapy |
| Type 4 | Aldosterone deficiency or resistance | <5.5 | High | Diabetic nephropathy, ACE-I/ARB, K⁺-sparing diuretics |
Urine Anion Gap (UAG) - Distinguishing Diarrhea from RTA
UAG = (urine Na⁺ + urine K⁺) - urine Cl⁻
- Negative UAG (Cl⁻ > Na⁺ + K⁺): Urine NH₄⁺ is high → appropriate renal response → extrarenal cause (diarrhea)
- Positive UAG: Urine NH₄⁺ is low → kidney is not excreting enough acid → RTA
Treatment of Non-AG Metabolic Acidosis
- Diarrhea: Replace volume + potassium, treat underlying cause
- CKD (non-AG): Oral NaHCO₃ tablets (650 mg = 7.8 mEq) or sodium citrate (Shohl's solution) to maintain HCO₃⁻ >22-24 mmol/L. This slows CKD progression.
- Adding fruits/vegetables (citrate source) also safely increases plasma HCO₃⁻ and slows CKD.
- Type 1 RTA: NaHCO₃ + KCl replacement
- Type 2 RTA: K-citrate + large doses of alkali (NaHCO₃ administration worsens kaliuresis)
- Type 4 RTA: Treat hyperkalemia; fludrocortisone if aldosterone-deficient
4. METABOLIC ALKALOSIS
Definition
Compensation
Expected PaCO₂ = 0.7 × [HCO₃⁻] + 21 ± 2
Key Concept: Generation vs. Maintenance
- Generation: HCO₃⁻ is added to ECF (e.g., vomiting loses H⁺, GI tract generates HCO₃⁻; diuretics cause volume/Cl⁻ loss)
- Maintenance: Normal kidneys can rapidly excrete excess HCO₃⁻ (up to 1000 mmol/day). For alkalosis to persist, something must impair renal HCO₃⁻ excretion.
- Volume depletion (stimulates proximal HCO₃⁻ reabsorption)
- Hypokalemia (increases H⁺ secretion, HCO₃⁻ reabsorption)
- Hyperaldosteronism (stimulates distal H⁺ secretion)
- Hypochloremia (Cl⁻ delivery to distal tubule is required to "swap" for HCO₃⁻ excretion)
THE TWO BIG CATEGORIES
4A. SALINE-RESPONSIVE METABOLIC ALKALOSIS (Urine Cl⁻ < 10-15 mEq/L)
| Cause | Mechanism |
|---|---|
| Vomiting / NG suction | Loss of HCl; gastric parietal cells produce HCO₃⁻ as they secrete H⁺ |
| Loop or thiazide diuretics (if stopped) | Cl⁻/volume loss; if ongoing, urine Cl⁻ may be high |
| Post-hypercapnia | Kidneys retained HCO₃⁻ to compensate respiratory acidosis; when ventilation corrects PaCO₂ quickly, alkalosis remains temporarily |
| Villous adenoma | Massive Cl⁻ loss in stool |
Treatment
- IV normal saline (0.9% NaCl) replaces volume and Cl⁻, allowing kidneys to excrete excess HCO₃⁻
- Replace K⁺ (hypokalemia sustains alkalosis)
- If ongoing NG suction: add H₂ receptor antagonists to reduce gastric H⁺ secretion
4B. SALINE-RESISTANT METABOLIC ALKALOSIS (Urine Cl⁻ > 20 mEq/L)
| Cause | Mechanism |
|---|---|
| Primary hyperaldosteronism (Conn's) | Aldosterone drives distal H⁺ secretion + K⁺ loss |
| Secondary hyperaldosteronism (heart failure, cirrhosis, renal artery stenosis) | Same |
| Cushing's syndrome | Cortisol has mineralocorticoid activity |
| Bartter's syndrome | Loop of Henle defect mimicking loop diuretics |
| Gitelman's syndrome | Distal tubule defect mimicking thiazides |
| Severe hypokalemia | K⁺ depletion directly stimulates HCO₃⁻ reabsorption |
| Exogenous alkali loading | Milk-alkali syndrome, massive blood transfusion (citrate) |
Treatment
- Target the underlying disorder
- Spironolactone or amiloride for mineralocorticoid excess
- K⁺ replacement is always required
- Acetazolamide (carbonic anhydrase inhibitor) can force renal HCO₃⁻ excretion - useful when saline is contraindicated (heart failure, cirrhosis)
- HCl infusion or NH₄Cl: only for severe, life-threatening alkalosis (pH > 7.70)
- Dialysis for renal failure patients
5. STEPWISE APPROACH TO ACID-BASE DIAGNOSIS (Harrison's Table 58-3)
6. MIXED ACID-BASE DISORDERS (Quick Summary)
| Combination | Clue | Example |
|---|---|---|
| High-AG acidosis + respiratory alkalosis | PaCO₂ lower than Winter's predicts | Sepsis, salicylate toxicity |
| High-AG acidosis + respiratory acidosis | PaCO₂ higher than Winter's predicts | Severe pneumonia/pulmonary edema |
| High-AG acidosis + metabolic alkalosis | ΔAG >> ΔHCO₃⁻ (HCO₃⁻ appears normal!) | Uremia + vomiting |
| High-AG + normal-AG acidosis | ΔAG << ΔHCO₃⁻ | DKA + diarrhea, toluene toxicity |
| Metabolic alkalosis + respiratory alkalosis | PaCO₂ doesn't rise as expected; pH very high | Liver disease + diuretics |
| Metabolic alkalosis + respiratory acidosis | Both HCO₃⁻ and PaCO₂ high; pH near normal | COPD + diuretics |
7. MEMORY SUMMARY TABLE
| Feature | Metabolic Acidosis | Metabolic Alkalosis |
|---|---|---|
| Primary change | ↓ HCO₃⁻ | ↑ HCO₃⁻ |
| Compensation | ↓ PaCO₂ (hyperventilation) | ↑ PaCO₂ (hypoventilation) |
| Formula | PaCO₂ = 1.5×HCO₃⁻ + 8 ± 2 | PaCO₂ = 0.7×HCO₃⁻ + 21 ± 2 |
| AG high → | MUDPILES causes | - |
| AG normal → | GI loss, RTA | - |
| Urine Cl⁻ | - | <15 = saline-responsive; >20 = resistant |
| Key treatment | Treat cause; NaHCO₃ only if pH<7.1 | Saline + KCl; or treat mineralocorticoid excess |
Simple Way to Remember It All
- Metabolic acidosis = too much acid poured in (MUDPILES) OR the drain lost too much base (diarrhea, RTA). The lungs help by blowing off CO₂ (breathing faster).
- Metabolic alkalosis = too much base poured in OR too much acid drained away (vomiting, diuretics). The lungs help by retaining CO₂ (breathing slower).
- The anion gap is the "fingerprint" that tells you whether the acid appeared from inside the body (high-AG) or the base leaked from outside (normal-AG).