
Median nerve anatomy
median nerve anatomy diagram
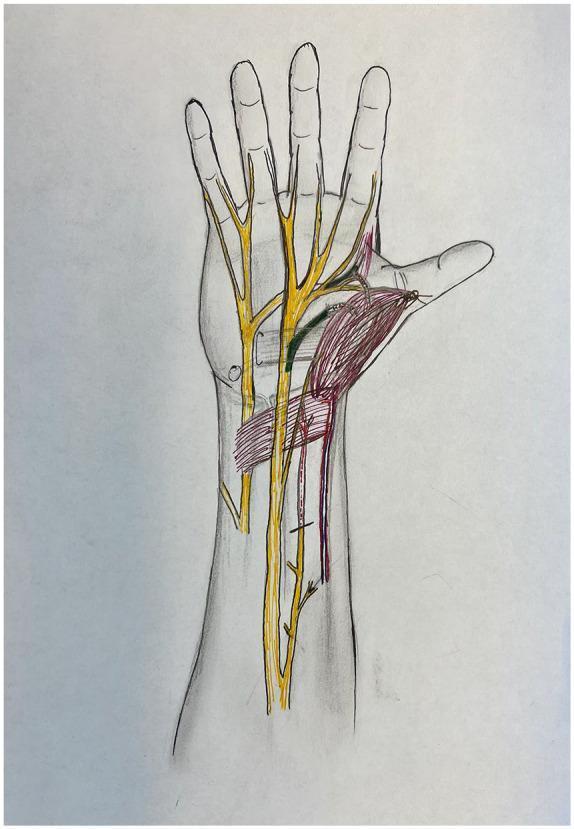
Anatomical diagram of the human hand and distal forearm in a palmar view, illustrating peripheral nerve anatomy and muscle transposition for pronator quadratus opponensplasty. The diagram features color-coded structures overlaid on a skeletal and soft tissue outline. Major peripheral nerves, including the median and ulnar nerves, are highlighted in yellow, showing their proximal courses and distal branching into digital nerves. The recipient anterior interosseous nerve (AIN) motor branch is highlighted in red, indicating its path toward the transposed muscle. The donor recurrent median nerve and donor deep ulnar nerve branches are highlighted in green, demonstrating potential donor sites for nerve coaptation to restore thenar function. The pronator quadratus muscle is shaded in red, shown in a transposed position toward the thumb (thenar eminence) to simulate its role as an opponens substitute. This illustration is designed for surgical planning in cases of chronic carpal tunnel syndrome or atrophic thenar muscle dysfunction, focusing on the spatial relationships required for effective nerve transfer and muscle mobilization.
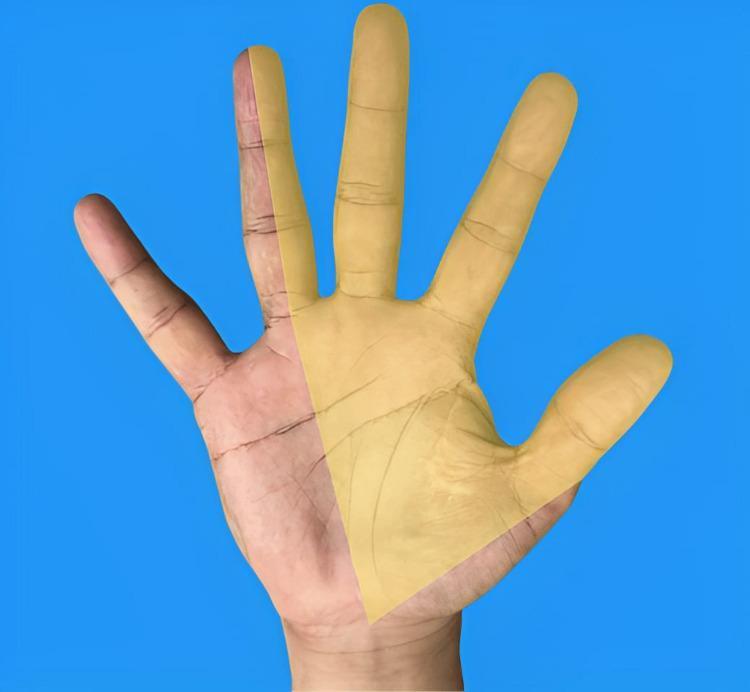
This clinical photograph/anatomical diagram hybrid illustrates the sensory distribution of the median nerve on the palmar surface of the right hand. The image displays a human hand against a blue background with a translucent yellow overlay highlighting the specific anatomical region innervated by the median nerve. The highlighted area covers the palmar aspect of the thumb (first digit), index finger (second digit), middle finger (third digit), and the radial half of the ring finger (fourth digit). The boundary line bisects the ring finger longitudinally and extends proximally across the palm toward the wrist, excluding the ulnar-innervated territory of the fifth digit and the ulnar half of the fourth. This visual is an essential educational tool for understanding peripheral nerve entrapment syndromes, specifically Carpal Tunnel Syndrome (CTS), as it clearly demonstrates the regions where patients typically experience paresthesia, numbness, or pain. It serves as a diagnostic reference for clinicians and medical students to correlate physical symptoms with nerve anatomy.
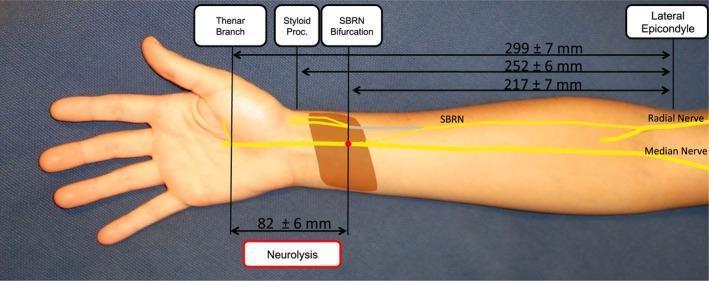
Anatomical diagram and clinical photograph overlaying a human forearm to demonstrate the nerve transfer of the superficial branch of the radial nerve (SBRN) to the median nerve (MN). The visual illustrates the surgical anatomy and morphometric distances required for neurolysis and tension-free coaptation. Key landmarks identified from the lateral epicondyle of the humerus include the SBRN bifurcation (217 ± 7 mm), the radial styloid process (252 ± 6 mm), and the thenar branch takeoff (299 ± 7 mm). The original course of the SBRN is indicated in gray, while the post-transposition path toward the median nerve is shown as a dashed yellow line, with the coaptation site marked by a red dot. A brown highlighted area represents the pronator quadratus muscle. The diagram also specifies an 82 ± 6 mm segment required for interfascicular neurolysis between the median nerve and its thenar branch to facilitate the transfer. This educational material is designed for advanced orthopedic or plastic surgery training in peripheral nerve reconstruction.
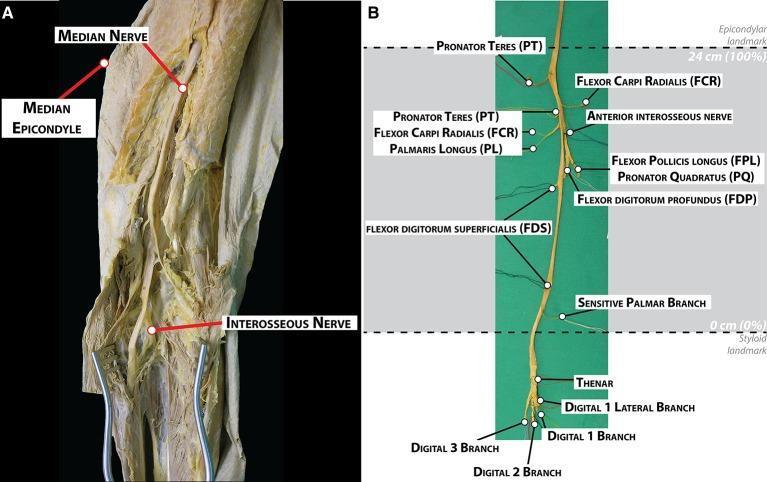
This educational image displays the gross anatomy and morphological branching pattern of the human median nerve through dissection. Image A is a clinical photograph showing the median nerve in situ within the medial aspect of the arm and elbow, with the median epicondyle and interosseous nerve labeled as landmarks. Image B presents the fully harvested median nerve against a green background, detailing its extensive branching hierarchy. Muscular branches are identified proximally to distally, including the pronator teres (PT), flexor carpi radialis (FCR), palmaris longus (PL), anterior interosseous nerve, flexor pollicis longus (FPL), pronator quadratus (PQ), flexor digitorum profundus (FDP), and flexor digitorum superficialis (FDS). Distal terminal branches are shown extending into the hand, including the sensitive palmar branch, thenar branches, and digital branches (1-3). The diagram includes a normalized distance scale, designating the epicondylar landmark at 24 cm (100%) and the styloid landmark at 0 cm (0%). This visual serves as a topographical guide for identifying nerve distribution during surgical procedures like electrode implantation or neurolysis.
Median Nerve Anatomy
Origin and Root Values
- Lateral root from the lateral cord of the brachial plexus - carries C6 and C7 fibers
- Medial root from the medial cord - carries C8 and T1 fibers
Course Through the Arm
- Proximally: lies lateral to the brachial artery
- Distally: crosses to the medial side of the brachial artery as it approaches the cubital fossa, lying anterior to the elbow joint
Forearm Course and Branches
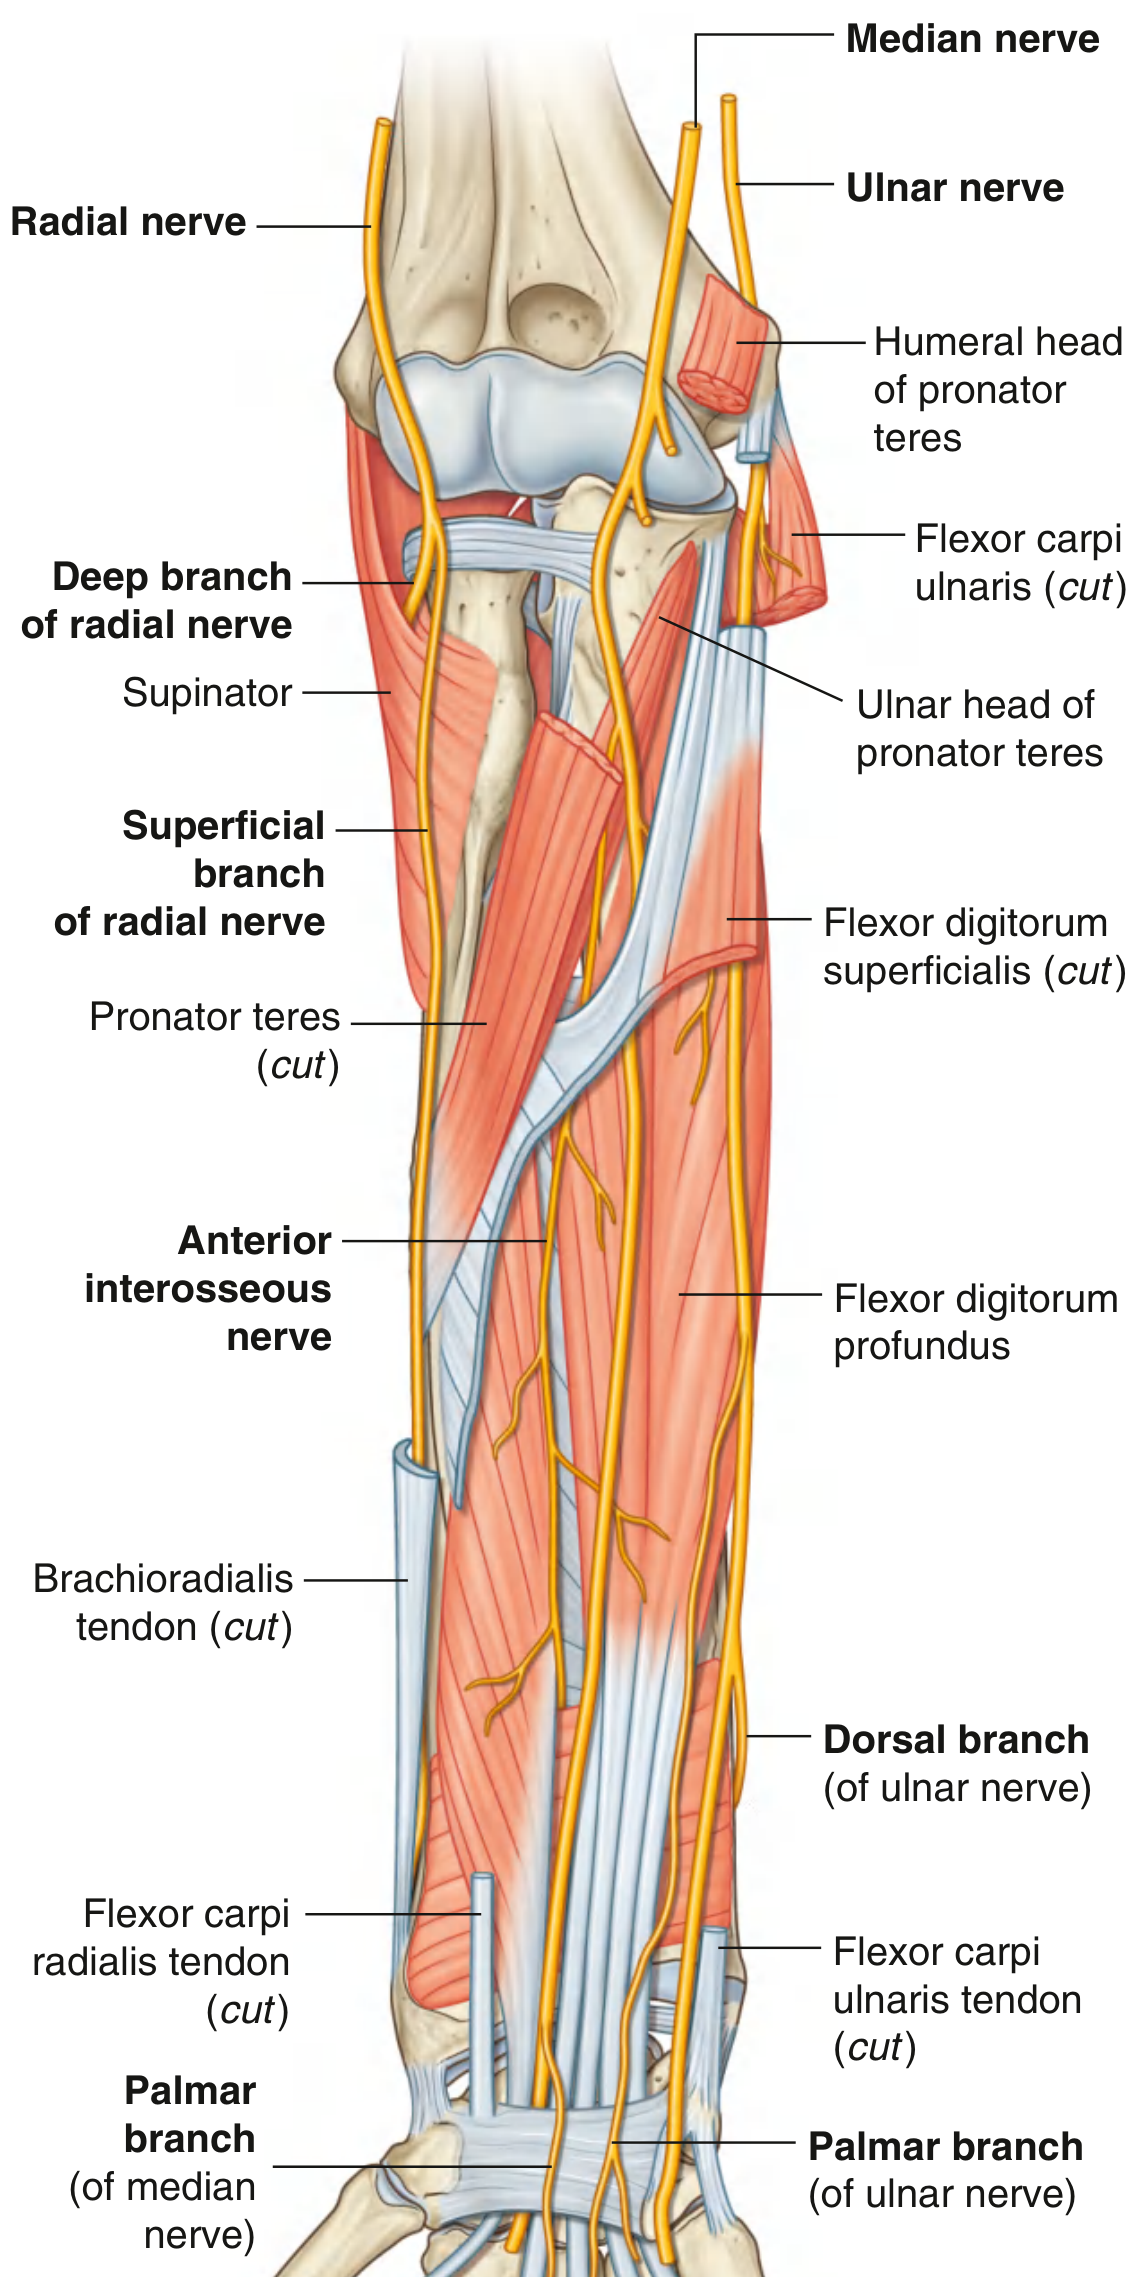
Motor branches in the forearm (arise just distal to the elbow):
| Muscle | Layer |
|---|---|
| Pronator teres | Superficial |
| Flexor carpi radialis | Superficial |
| Palmaris longus | Superficial |
| Flexor digitorum superficialis | Intermediate |
Anterior Interosseous Nerve (AIN)
- Flexor pollicis longus
- Lateral half of flexor digitorum profundus (index + middle fingers)
- Pronator quadratus
Palmar cutaneous branch
The Carpal Tunnel
Hand - Branches and Distribution
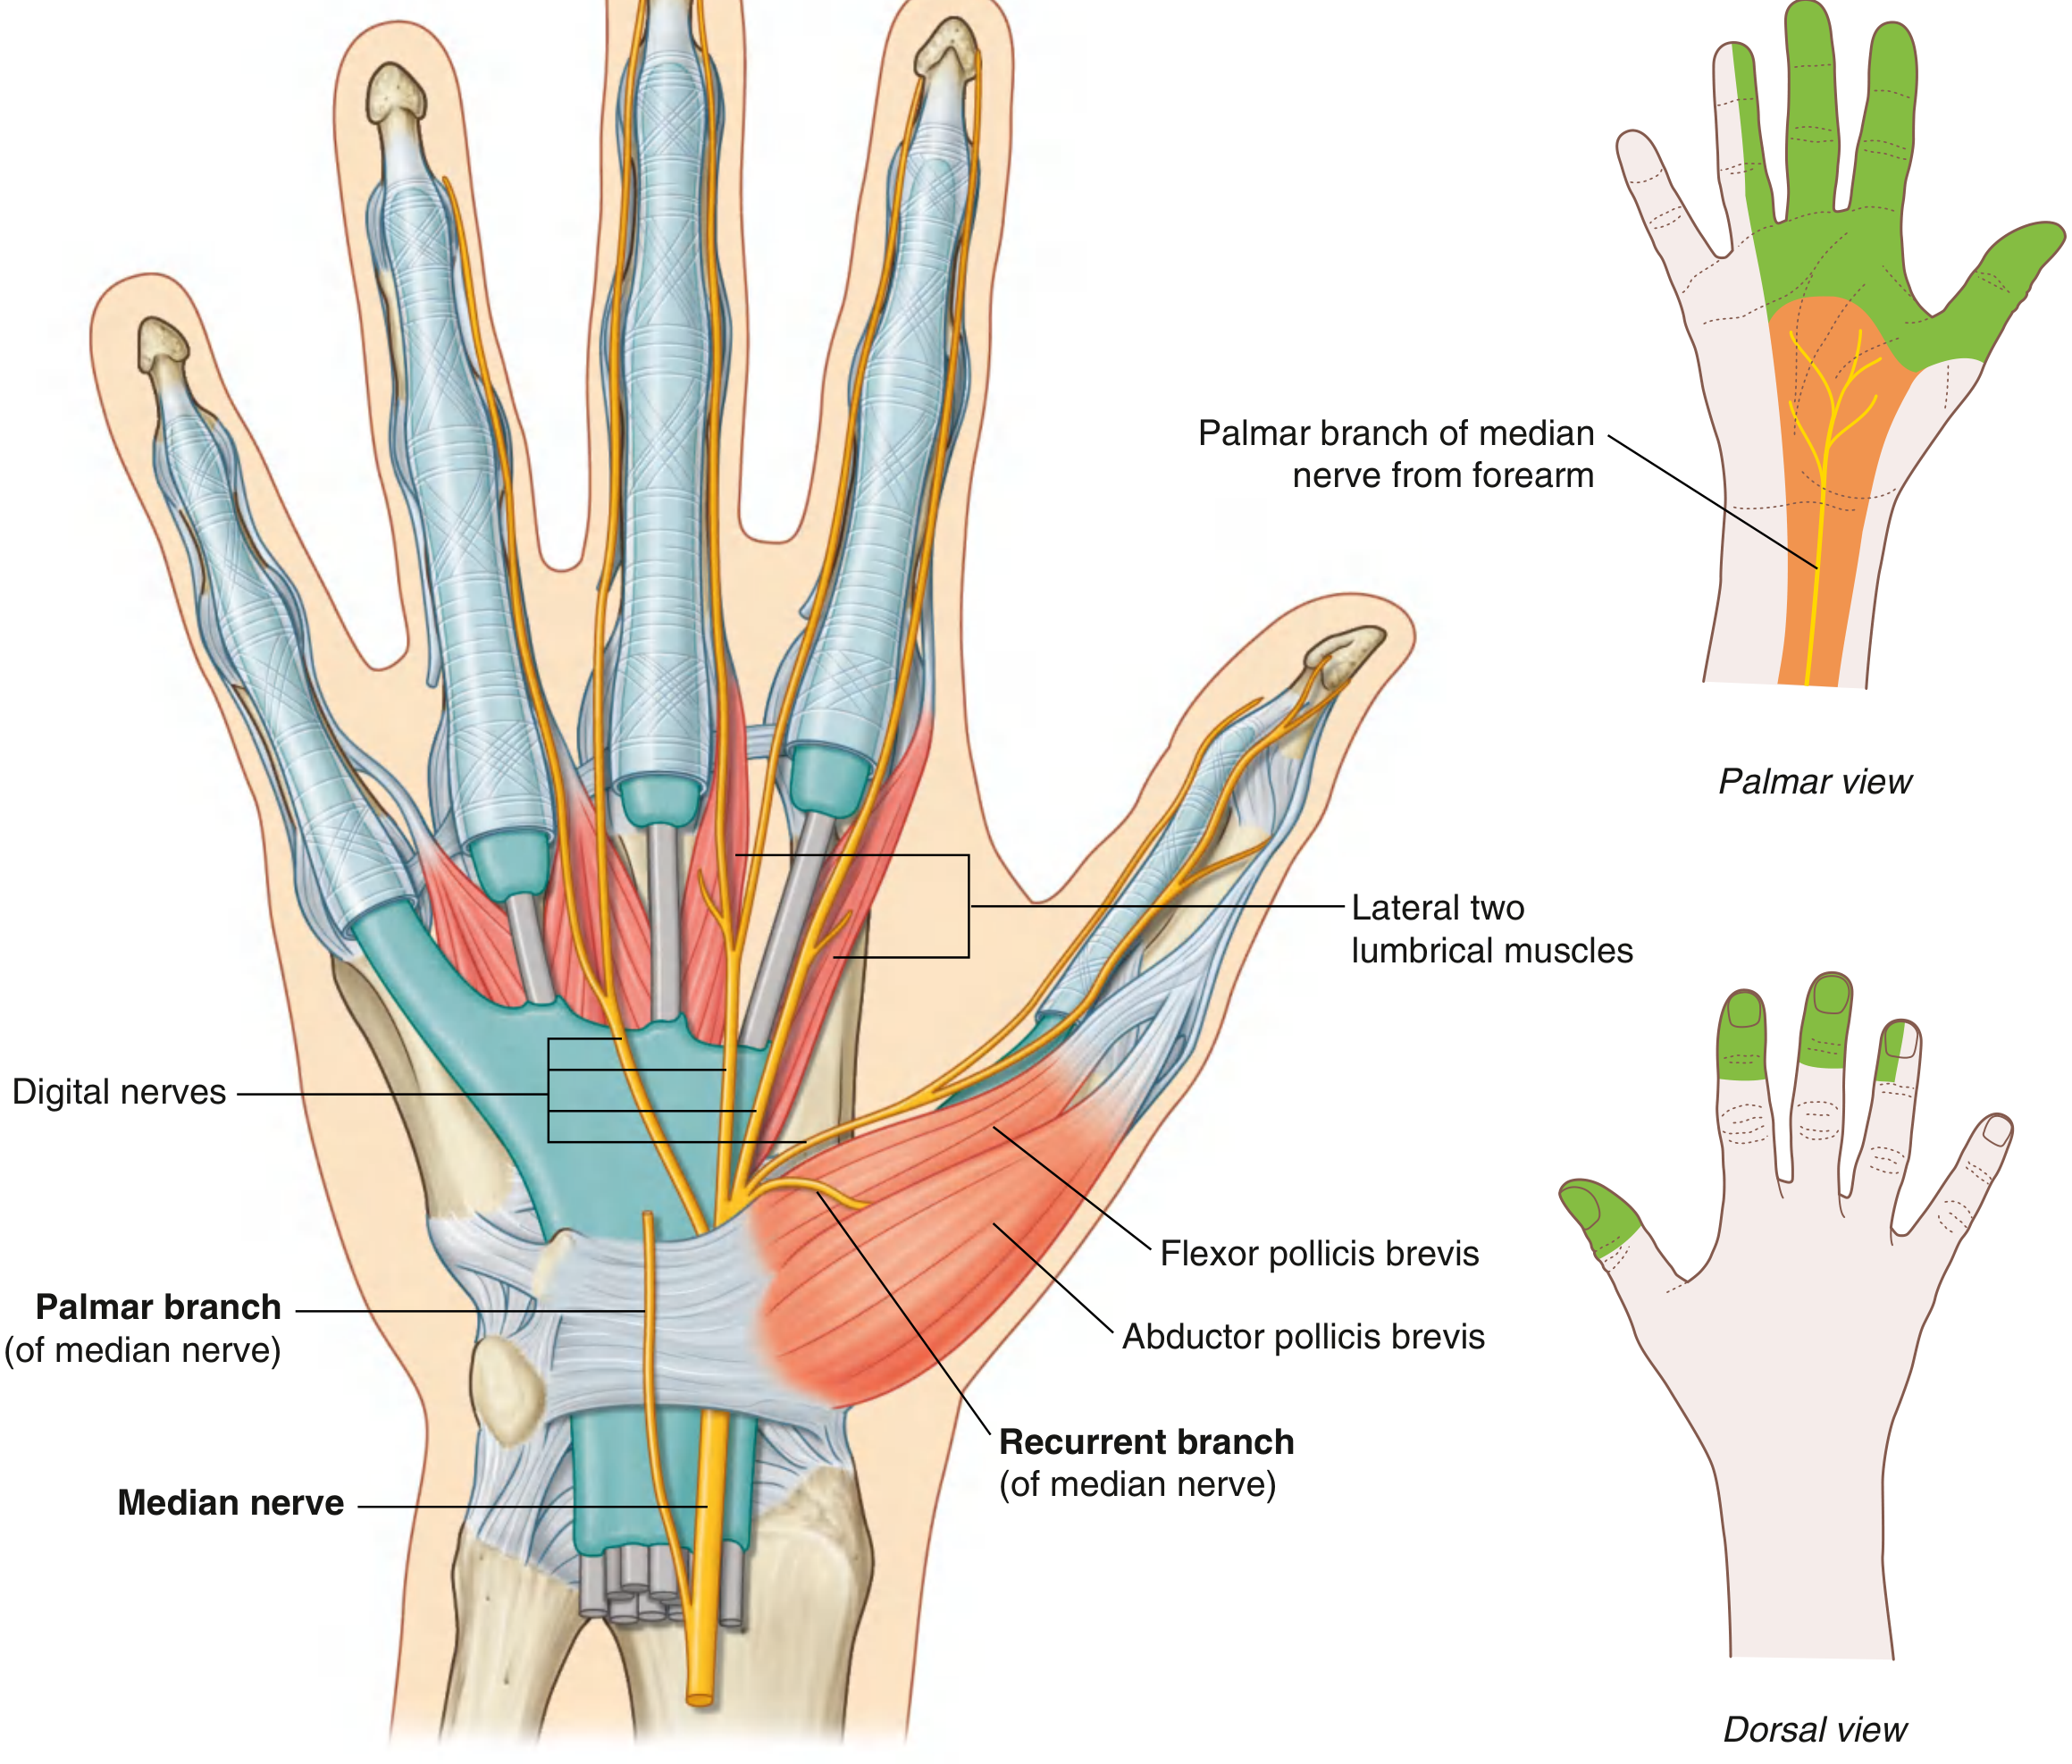
Recurrent (thenar) branch
- Curves back proximally from the lateral side of the median nerve just distal to the flexor retinaculum
- Innervates the three thenar muscles: abductor pollicis brevis, flexor pollicis brevis (superficial head), and opponens pollicis
- This is the nerve of opposition of the thumb
Palmar digital branches
Sensory Territory Summary
| Area | Supplied by |
|---|---|
| Thenar eminence skin | Palmar cutaneous branch (proximal to flexal retinaculum) |
| Palmar surface: thumb, index, middle, lateral ring | Palmar digital branches |
| Dorsal fingertips (nail beds) of lateral 3½ digits | Palmar digital branches |
What the Median Nerve Does NOT Innervate
- Flexor carpi ulnaris (ulnar nerve)
- Medial half of FDP (ring and little fingers) - ulnar nerve
- Intrinsic hand muscles except the thenar muscles and lateral two lumbricals (all others are ulnar nerve)
- No branches in the arm
Key Clinical Correlates
| Lesion Site | Finding |
|---|---|
| High (arm/elbow) | Loss of all forearm flexors (except FCU, medial FDP), loss of thenar muscles, loss of lateral 3½ finger sensation; classic "hand of benediction" on attempted fist (index and middle cannot flex at DIP) |
| AIN palsy | Cannot flex IP joint of thumb or DIP of index - loss of "OK sign"; no sensory deficit |
| Carpal tunnel (wrist) | Thenar wasting, nocturnal paresthesia in lateral 3½ digits; palmar skin and dorsal fingertips affected; palmar cutaneous branch spared so thenar eminence sensation preserved |
| Palmar branch sparing | Confirms compression is within the carpal tunnel, not more proximally |
Radial nerv
radial nerve anatomy course branches diagram
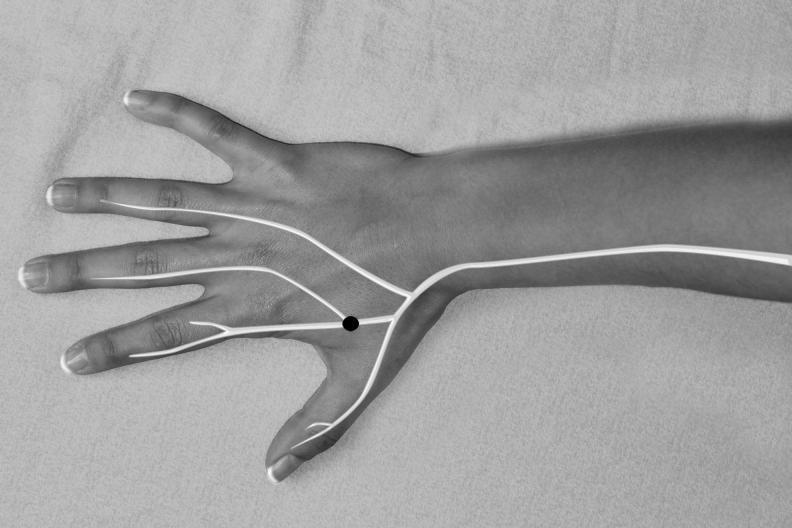
This clinical photograph/anatomical diagram hybrid depicts the dorsal aspect of a human hand and distal forearm in a grayscale format. Superimposed on the anatomy is a schematic representation of the superficial branch of the radial nerve. A thick white line originates from the radial side of the forearm, traveling distally across the wrist. Upon reaching the dorsum of the hand, the line branches into multiple digital nerves that extend toward the thumb, index, middle, and ring fingers. A prominent black circular marker is placed on the first dorsal interosseous space (the web space between the thumb and index finger), identifying the Superficial Radial Neuropuncture Point (SRNP). The image illustrates the neuroanatomical basis for specific acupuncture or electroacupuncture sites, emphasizing the relationship between traditional medicine points and peripheral nerve distribution. This visual is intended for healthcare professionals or students studying neuroanatomy, physical medicine, or integrative pain management protocols.
Anatomical diagram and clinical photograph overlaying a human forearm to demonstrate the nerve transfer of the superficial branch of the radial nerve (SBRN) to the median nerve (MN). The visual illustrates the surgical anatomy and morphometric distances required for neurolysis and tension-free coaptation. Key landmarks identified from the lateral epicondyle of the humerus include the SBRN bifurcation (217 ± 7 mm), the radial styloid process (252 ± 6 mm), and the thenar branch takeoff (299 ± 7 mm). The original course of the SBRN is indicated in gray, while the post-transposition path toward the median nerve is shown as a dashed yellow line, with the coaptation site marked by a red dot. A brown highlighted area represents the pronator quadratus muscle. The diagram also specifies an 82 ± 6 mm segment required for interfascicular neurolysis between the median nerve and its thenar branch to facilitate the transfer. This educational material is designed for advanced orthopedic or plastic surgery training in peripheral nerve reconstruction.
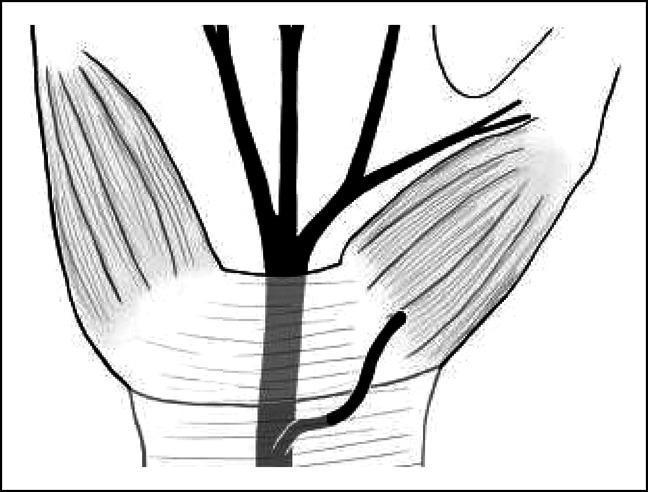
This medical anatomical diagram illustrates a rare variation of the hand's neurovasculature, specifically the preligamentous course of the thenar motor branch (TMB) of the median nerve. The black-and-white line drawing shows the median nerve trunk passing deep to the transverse carpal ligament (TCL). In this variation, the thenar motor branch originates from the median nerve proximal to the carpal tunnel and courses superficially over the transverse carpal ligament before diving into the striated thenar musculature on the radial side of the palm. The illustration highlights critical surgical anatomy for procedures such as carpal tunnel release, where identifying the TMB's relationship to the TCL is essential to avoid iatrogenic injury. The diagram provides educational context for understanding anatomical deviations that do not strictly adhere to standard classifications like the Lanz system, specifically demonstrating an 'over the ligament' pathway rather than the typical subligamentous or transligamentous routes.
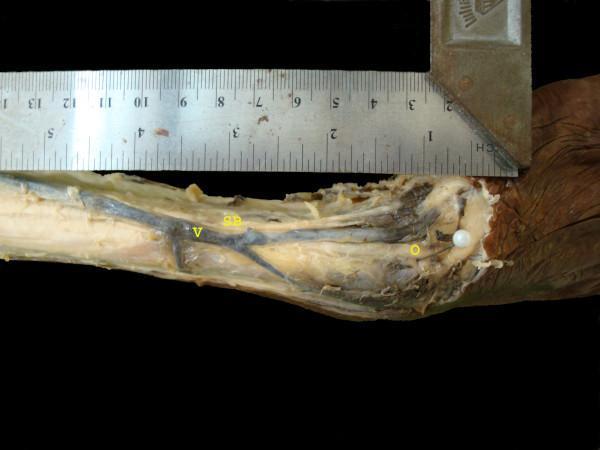
This clinical anatomical specimen photograph displays a superficial dissection of the distal forearm and wrist, focusing on the neurovascular relationships along the radial aspect. Key anatomical landmarks are identified with yellow labels: the radial styloid process is marked as 'O' (indicated by a white pin), the superficial branch of the radial nerve is labeled 'SB', and the cephalic vein is labeled 'V'. The image demonstrates the close proximity and crossover point of the cephalic vein and the sensory branches of the radial nerve as they course distally toward the dorsal hand. A metallic caliper and ruler are positioned alongside the specimen to provide a metric scale for morphometric measurements between the styloid process and nerve-vein intersections. This educational visual is designed to assist in understanding surgical anatomy for procedures such as cephalic vein cannulation or radial artery harvesting, where avoiding injury to the superficial branch of the radial nerve is critical.
Radial Nerve Anatomy
Origin and Root Values
- Arises from the posterior cord of the brachial plexus
- Root values: C5, C6, C7, C8, T1
- It is the largest nerve in the upper extremity
Course Through the Arm
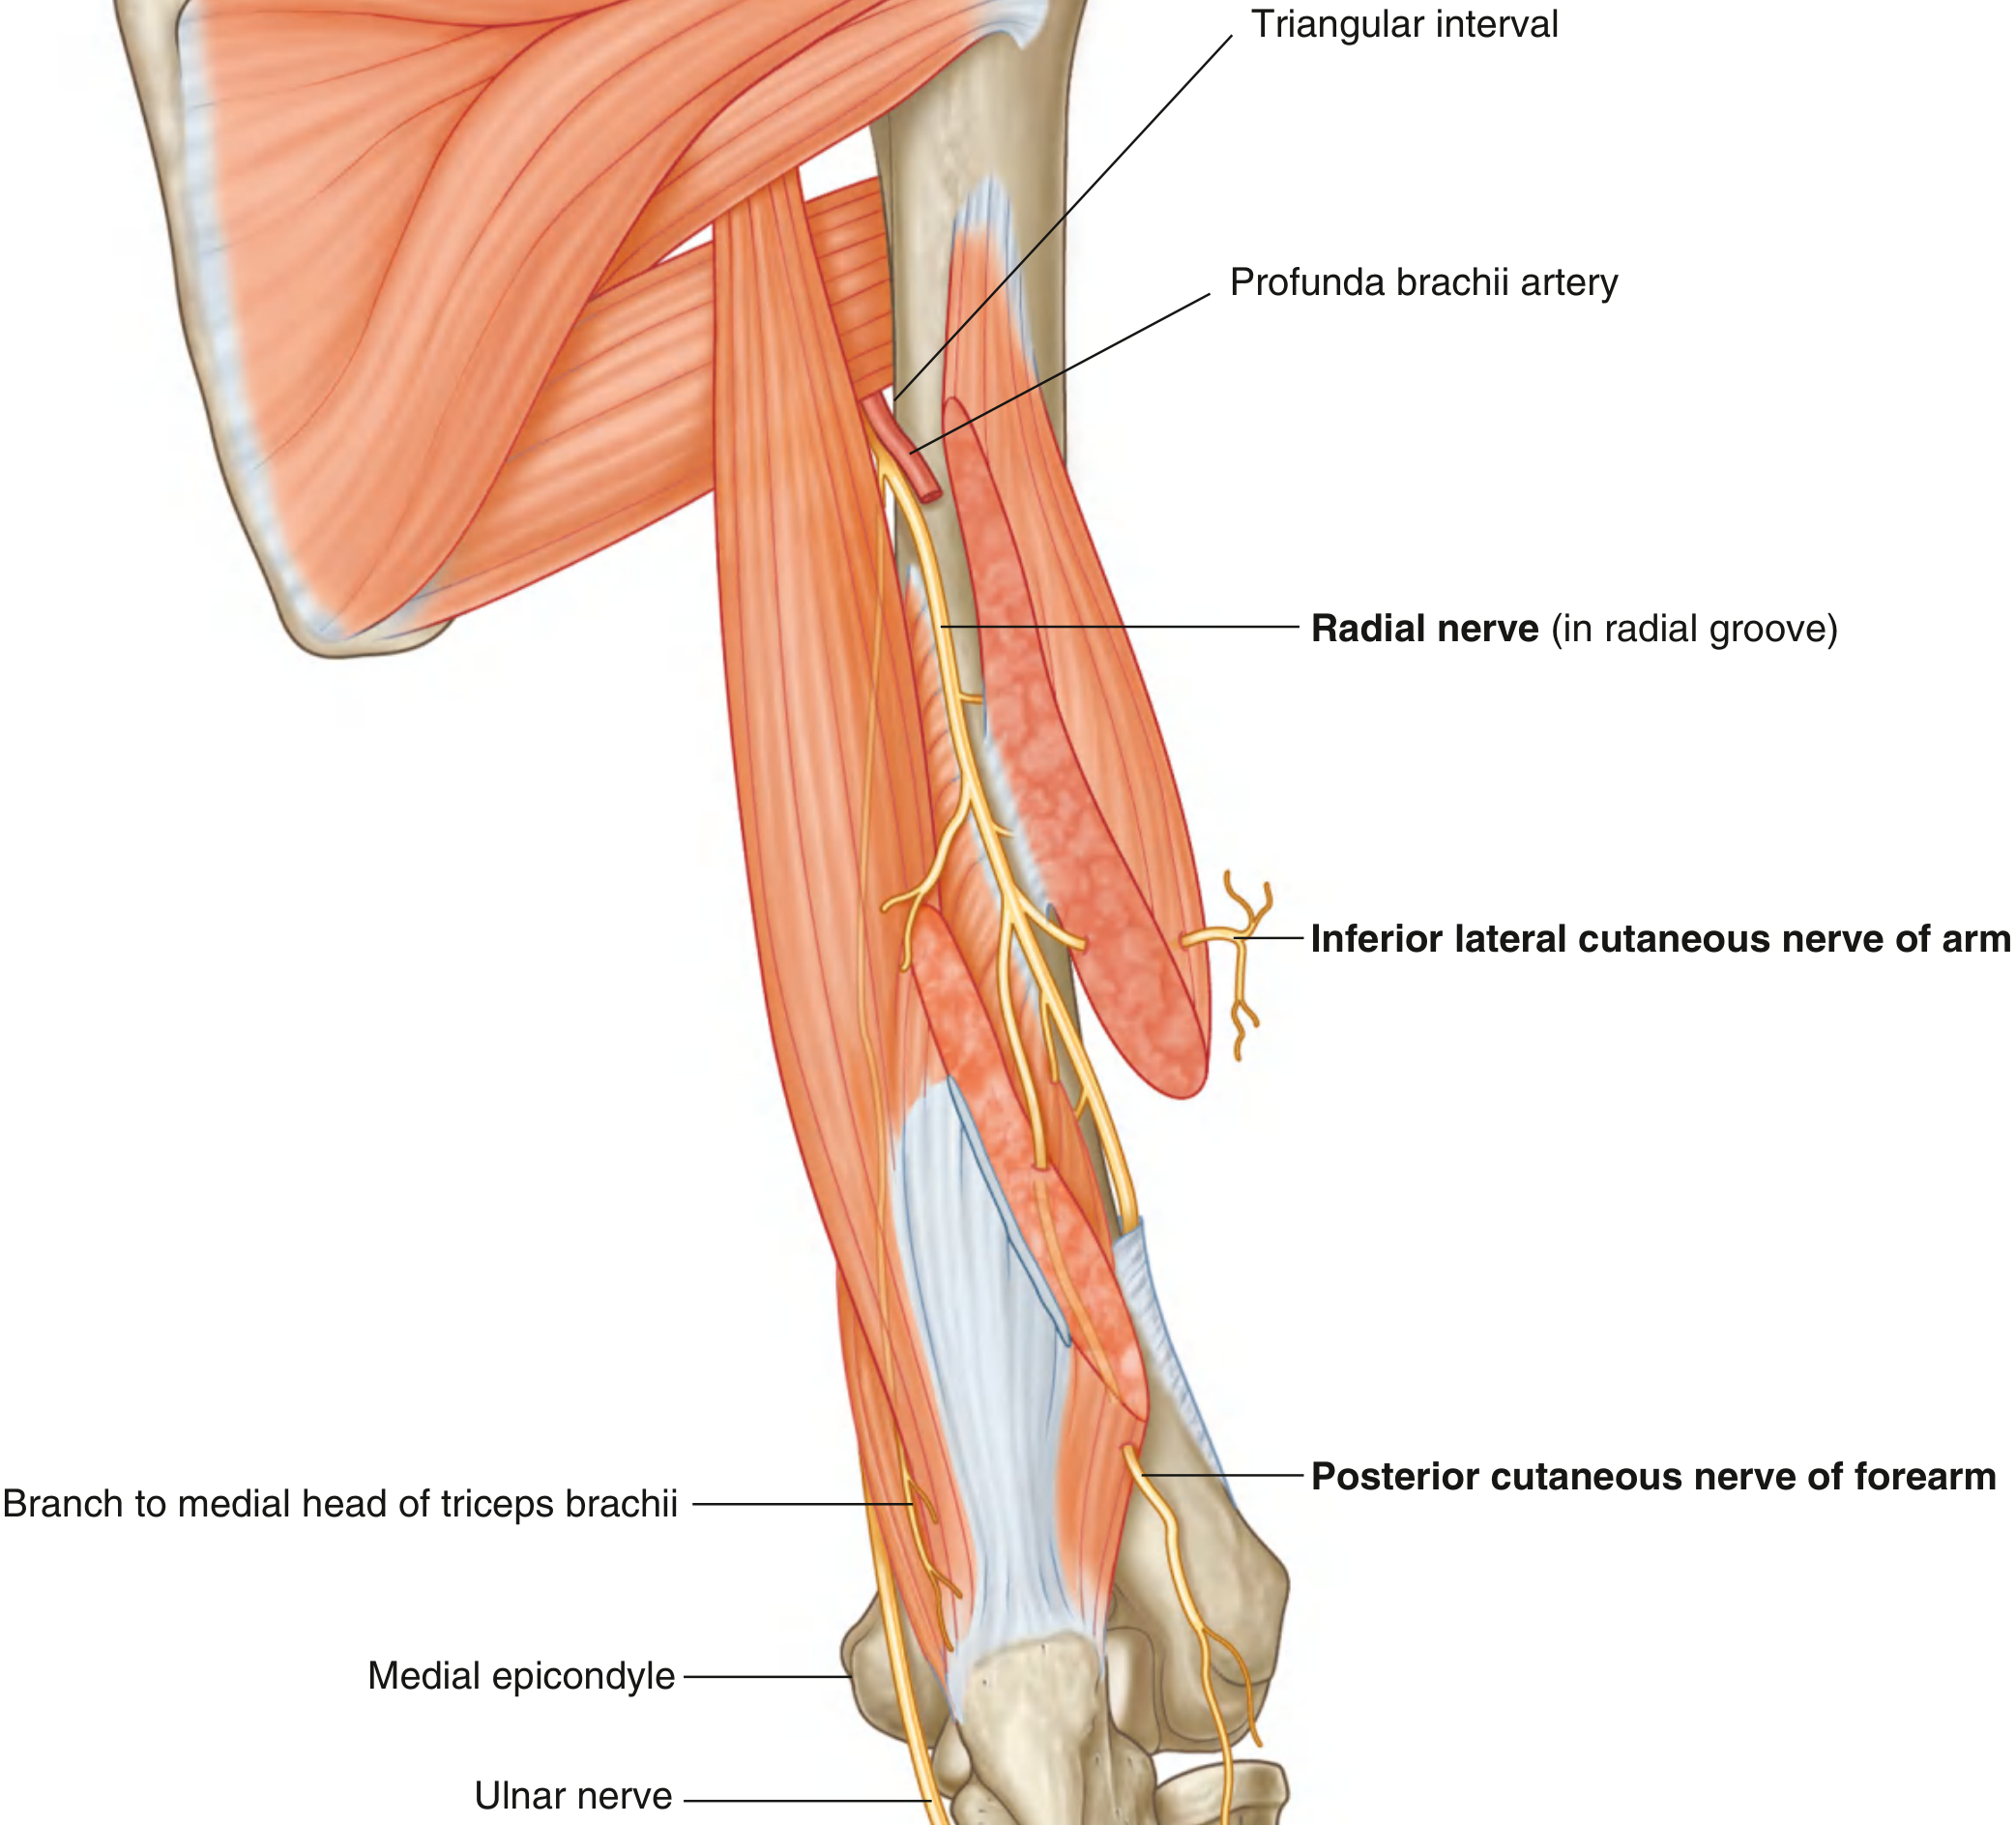
- Enters the posterior compartment through the triangular interval (accompanied by the profunda brachii artery)
- Winds diagonally around the humerus in the radial (spiral) groove, lying directly on bone between the medial and lateral heads of triceps
- Pierces the lateral intermuscular septum and enters the anterior compartment laterally
- Lies between brachialis (medially) and brachioradialis (laterally) as it descends to the elbow
- Enters the forearm anterior to the lateral epicondyle, just deep to brachioradialis
Branches in the Arm
Motor branches
| Muscle | Notes |
|---|---|
| Triceps brachii (all 3 heads) | Branch to medial head arises before entering posterior compartment |
| Anconeus | |
| Brachioradialis | Arises in the lateral wall of the cubital fossa |
| Extensor carpi radialis longus | Arises in the lateral wall of the cubital fossa |
| Brachialis (lateral part) | Shared innervation with musculocutaneous nerve |
Cutaneous branches (arising in the posterior compartment)
- Posterior cutaneous nerve of the arm - strip of skin over the triceps
- Inferior lateral cutaneous nerve of the arm - lateral half of the arm
- Posterior cutaneous nerve of the forearm - extensor surface of the forearm (arises before the spiral groove)
Division at the Cubital Fossa
1. Deep Branch (→ Posterior Interosseous Nerve)
- Predominantly motor
- Innervates extensor carpi radialis brevis and supinator before entering the supinator
- Passes between the superficial and deep layers of supinator through the arcade of Frohse (the proximal arch of supinator)
- Emerges as the posterior interosseous nerve (PIN) in the posterior compartment
- Lies between the superficial and deep muscle layers of the posterior forearm
- Supplies all remaining posterior compartment muscles:
| Superficial layer | Deep layer |
|---|---|
| Extensor digitorum | Extensor pollicis longus |
| Extensor digiti minimi | Extensor pollicis brevis |
| Extensor carpi ulnaris | Abductor pollicis longus |
| Extensor indicis |
- Terminates as articular branches to the wrist
2. Superficial Branch
- Purely sensory - no motor function
- Runs down the anterolateral forearm deep to brachioradialis, alongside the radial artery
- About two-thirds down the forearm, wraps posteriorly around the radial side of the wrist deep to the brachioradialis tendon
- Enters the hand over the anatomical snuffbox on the dorsolateral aspect
Sensory Distribution in the Hand
- Dorsolateral palm
- Dorsal aspects of the lateral 3½ digits (thumb, index, middle, radial half of ring finger) - but only up to approximately the proximal interphalangeal joints (the fingertips/nail beds are median nerve territory)
- Skin over the lateral metacarpal I and the first web space (the most reliable sensory test point)
Summary of Radial Nerve Innervation
| Region | Motor | Sensory |
|---|---|---|
| Arm | Triceps, anconeus, brachioradialis, ECRL, brachialis (part) | Posterior arm, lower lateral arm, posterior forearm |
| Forearm | Extensor carpi radialis brevis, supinator (deep branch); all posterior compartment muscles (PIN) | None (deep branch is motor only) |
| Hand | None | Dorsolateral palm, dorsum of lateral 3½ digits to PIP level (superficial branch) |
Key Clinical Correlates
| Lesion Level | Motor Loss | Sensory Loss | Classic Sign |
|---|---|---|---|
| Axilla (crutch/honeymoon palsy) | Triceps + all below | Posterior arm + forearm + dorsum of hand | Wrist drop + weak elbow extension |
| Spiral groove / midshaft humerus fracture (Saturday-night palsy) | Wrist + finger extensors; triceps spared | Dorsum of hand only | Wrist drop; triceps reflex intact |
| Posterior interosseous nerve (radial tunnel) | Finger extensors; wrist extension partially preserved (ECRL intact = radial deviation on extension) | None (purely motor nerve) | Finger drop; no wrist drop |
| Superficial radial nerve (cheiralgia paresthetica) | None | First web space/dorsal hand | Paresthesia over dorsal hand |
The key distinguishing feature between a spiral groove lesion and an axillary lesion is triceps strength - the triceps branch arises proximal to the spiral groove, so it is spared in spiral groove lesions. - Bradley & Daroff's Neurology
Cardiac cycle 15 marks questin
cardiac cycle pressure volume Wiggers diagram heart sounds ECG
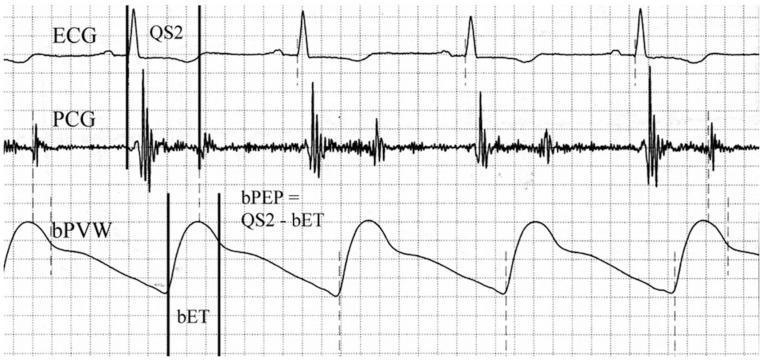
This physiological waveform diagram displays a simultaneous recording of three cardiac parameters used for assessing cardiovascular hemodynamics. The top trace is an Electrocardiogram (ECG) showing standard QRS complexes representing ventricular depolarization. The middle trace is a Phonocardiogram (PCG) capturing acoustic vibrations of heart sounds, specifically the S1 and S2 sounds. The bottom trace is a Brachial Pulse Volume Waveform (bPVW) illustrating the peripheral arterial pressure pulse. Vertical markers indicate temporal relationships between these signals to calculate systolic time intervals. The 'QS2' interval is marked from the onset of the QRS complex on the ECG to the aortic component of the second heart sound on the PCG, representing the total electromechanical systolic interval. The 'bET' (Brachial Ejection Time) is delineated on the bPVW from the waveform foot to the dicrotic notch. An annotated formula shows the calculation of the Brachial Pre-ejection Period (bPEP) as the difference between QS2 and bET (bPEP = QS2 - bET). This diagram is an educational tool for understanding the non-invasive assessment of cardiac systolic function and arterial stiffness.
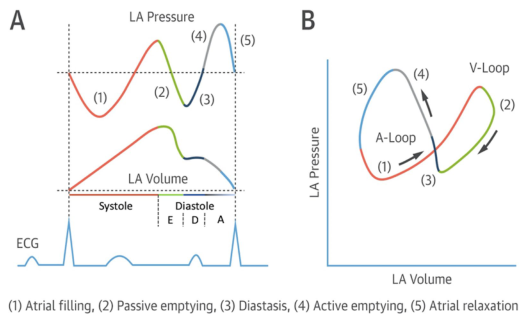
Summary : This figure illustrates the left atrial (LA) pressure-volume relationship during the cardiac cycle, showing both time-course traces and a pressure-volume loop, with key phases of atrial function annotated and correlated with the ECG. line plot and loop diagram: # Panel A: LA Pressure and Volume Traces • Top trace: LA Pressure (y-axis, arbitrary units) over time. • Middle trace: LA Volume (y-axis, arbitrary units) over time. • Bottom trace: ECG waveform for temporal reference. • X-axis: Cardiac cycle phases, with systole and diastole labeled; diastole further subdivided into E, D, and A phases. • Five phases are color-coded and numbered: – (1) Atrial filling (red) – (2) Passive emptying (green) – (3) Diastasis (black) – (4) Active emptying (blue) – (5) Atrial relaxation (gray) • Vertical dashed lines demarcate transitions between phases. # Panel B: LA Pressure-Volume Loop • X-axis: LA Volume (arbitrary units). • Y-axis: LA Pressure (arbitrary units). • The loop is traced in a counterclockwise direction, with arrows indicating the sequence. • The same five phases (1–5) are color-coded as in Panel A. • The loop is divided into two segments: A-Loop (phases 1, 3, 4, 5) and V-Loop (phase 2). # Design Encodings : • Distinct colors for each phase (red, green, black, blue, gray). • Arrows on the loop indicate the direction of the cardiac cycle. • ECG trace provides timing reference for the pressure and volume changes. # Analysis : • The LA pressure and volume traces show cyclical changes corresponding to atrial filling, emptying, and relaxation. • The pressure-volume loop visually summarizes the dynamic relationship between LA pressure and volume, with distinct segments for passive and active phases. • The figure highlights the temporal coordination between atrial events and the ECG, emphasizing the mechanical and electrical coupling in the cardiac cycle.
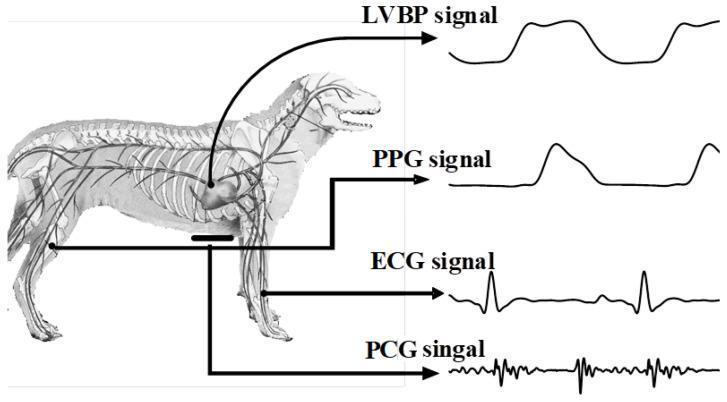
An educational anatomical and physiological diagram illustrating the synchronous collection of multiple cardiovascular biosignals in a canine model. The left side features a lateral-view anatomical illustration of a canine, highlighting the skeletal system, the heart, and major peripheral arteries. Four distinct biosignal waveforms are displayed on the right, with arrows tracing each to its anatomical point of acquisition: 1) LVBP (Left Ventricular Blood Pressure) signal, showing a rhythmic pressure waveform originating from the heart. 2) PPG (Photoplethysmogram) signal, a pulsatile volume waveform traced to the femoral artery. 3) ECG (Electrocardiogram) signal, showing characteristic P-QRS-T complexes with a prominent R-wave, traced to the forelimbs (Lead I configuration). 4) PCG (Phonocardiogram) signal, depicting high-frequency oscillations representing heart sounds, recorded from the cardiac apex. The diagram demonstrates the integration of invasive and non-invasive hemodynamic monitoring, useful for teaching comparative physiology and cardiovascular signal processing.
Wiggers diagram cardiac cycle left ventricular pressure aortic pressure atrial pressure volume ECG phases
Summary : This figure illustrates the left atrial (LA) pressure-volume relationship during the cardiac cycle, showing both time-course traces and a pressure-volume loop, with key phases of atrial function annotated and correlated with the ECG. line plot and loop diagram: # Panel A: LA Pressure and Volume Traces • Top trace: LA Pressure (y-axis, arbitrary units) over time. • Middle trace: LA Volume (y-axis, arbitrary units) over time. • Bottom trace: ECG waveform for temporal reference. • X-axis: Cardiac cycle phases, with systole and diastole labeled; diastole further subdivided into E, D, and A phases. • Five phases are color-coded and numbered: – (1) Atrial filling (red) – (2) Passive emptying (green) – (3) Diastasis (black) – (4) Active emptying (blue) – (5) Atrial relaxation (gray) • Vertical dashed lines demarcate transitions between phases. # Panel B: LA Pressure-Volume Loop • X-axis: LA Volume (arbitrary units). • Y-axis: LA Pressure (arbitrary units). • The loop is traced in a counterclockwise direction, with arrows indicating the sequence. • The same five phases (1–5) are color-coded as in Panel A. • The loop is divided into two segments: A-Loop (phases 1, 3, 4, 5) and V-Loop (phase 2). # Design Encodings : • Distinct colors for each phase (red, green, black, blue, gray). • Arrows on the loop indicate the direction of the cardiac cycle. • ECG trace provides timing reference for the pressure and volume changes. # Analysis : • The LA pressure and volume traces show cyclical changes corresponding to atrial filling, emptying, and relaxation. • The pressure-volume loop visually summarizes the dynamic relationship between LA pressure and volume, with distinct segments for passive and active phases. • The figure highlights the temporal coordination between atrial events and the ECG, emphasizing the mechanical and electrical coupling in the cardiac cycle.
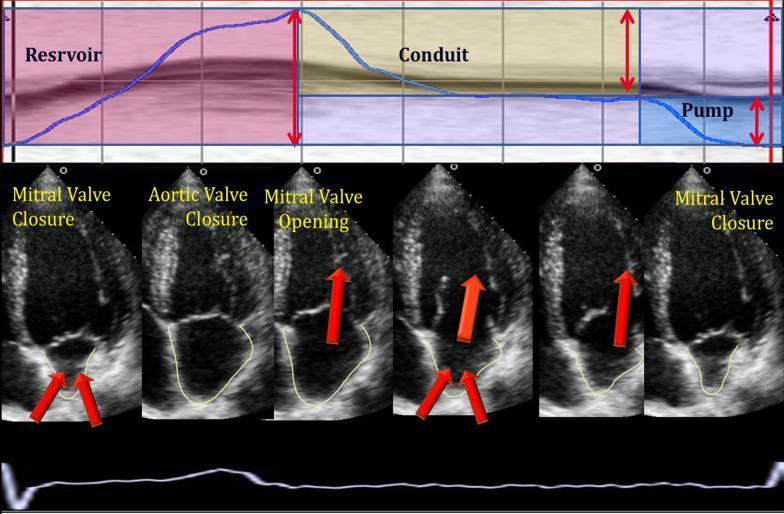
This medical illustration combines a physiological graph and echocardiographic frames to depict left atrial (LA) phasic function during the cardiac cycle. The top panel presents a color-coded volume-over-time curve divided into three functional phases: Reservoir (pink), representing LA filling during ventricular systole; Conduit (tan), showing early passive LA emptying after mitral valve opening; and Pump (blue), indicating active atrial contraction during late diastole. Vertical red arrows quantify volume changes for each phase. The middle panel features six apical four-chamber view echocardiograms with manual endocardial tracing (yellow outlines) of the LA. These frames are synchronized to clinical events: mitral valve closure (minimum LA volume), aortic valve closure (maximum LA volume), and mitral valve opening. Red arrows on the ultrasound images highlight the status of the mitral and aortic valves. The bottom panel displays a synchronized electrocardiogram (ECG) trace. This educational visual demonstrates how automated Vector Velocity Imaging (VVI) software tracks atrial mechanics and volumes to assess diastolic function in patients.
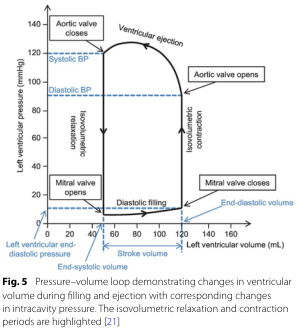
Summary : This figure shows a pressure–volume loop for the left ventricle, illustrating how ventricular volume and pressure change during the cardiac cycle, with key phases and valve events annotated. The isovolumetric relaxation and contraction periods are highlighted, and systolic/diastolic blood pressures are marked. pressure–volume loop diagram: # Title & Axes : • No explicit title on the figure, but the legend describes it as a "Pressure–volume loop demonstrating changes in ventricular volume during filling and ejection with corresponding changes in intracavity pressure." • X-axis: "Left ventricular volume (mL)" with tick marks at 0, 20, 40, 60, 80, 100, 120, 140, 160. • Y-axis: "Left ventricular pressure (mmHg)" with tick marks at 0, 20, 40, 60, 80, 100, 120, 140. • Additional axis labels: "Left ventricular end-diastolic pressure" (blue, left), "End-diastolic volume" (blue, bottom right), "Stroke volume" (black, bottom center). # Phases & Events : • Isovolumetric relaxation: vertical line at low volume, pressure drops, labeled. • Diastolic filling: horizontal line at low pressure, volume increases, labeled. • Isovolumetric contraction: vertical line at high volume, pressure rises, labeled. • Ventricular ejection: curved line, volume decreases as pressure peaks and falls, labeled. • Valve events: – Mitral valve opens (bottom left corner, low pressure/volume). – Mitral valve closes (bottom right corner, high volume/low pressure). – Aortic valve opens (top right corner, high volume/high pressure). – Aortic valve closes (top left corner, low volume/high pressure). # Blood Pressure Markers : • Systolic BP: horizontal dashed blue line at ~120 mmHg. • Diastolic BP: horizontal dashed blue line at ~80 mmHg. # Design Encodings : • Black solid lines for the loop. • Blue dashed lines for blood pressure markers. • Blue text for end-diastolic volume/pressure. • Labeled arrows for direction of phases and valve events. # Analysis : • The loop traces the cardiac cycle, starting at low pressure/volume (end-systolic), filling during diastole, rising sharply during isovolumetric contraction, ejecting blood during ventricular ejection, and dropping pressure during isovolumetric relaxation. • Systolic and diastolic blood pressures are marked, showing the pressure range during ejection. • The width of the loop (horizontal distance) represents stroke volume. • The figure clearly distinguishes the four main phases and the timing of valve openings/closings, providing a comprehensive view of ventricular mechanics during a heartbeat.
The Cardiac Cycle
Definition and Duration
- Systole (ventricular contraction) = ~0.3 s
- Diastole (ventricular relaxation + filling) = ~0.5 s
Initiation
Seven Phases of the Cardiac Cycle
Phase A - Atrial Systole
| Parameter | Event |
|---|---|
| ECG | P wave (atrial depolarization) |
| Valves | Mitral valve already open; all semilunar valves closed |
| Pressure | Left atrial pressure rises; creates "a wave" on venous pulse |
| Volume | Additional blood actively ejected into the LV - final 20-30% of ventricular filling |
| Heart sound | S4 (not audible normally; heard in ventricular hypertrophy) |
Phase B - Isovolumetric Ventricular Contraction
| Parameter | Event |
|---|---|
| ECG | QRS complex (ventricular depolarization) |
| Valves | Mitral valve closes (LV pressure exceeds LA pressure); aortic valve still closed |
| Pressure | LV pressure rises sharply from ~5-10 mmHg toward ~80 mmHg |
| Volume | Constant - all valves are closed; no blood enters or leaves the ventricle |
| Heart sound | S1 ("lub") - caused by vibration of tensed AV valves and ventricular walls on closure |
Phase C - Rapid Ventricular Ejection
| Parameter | Event |
|---|---|
| ECG | ST segment |
| Valves | Aortic valve opens when LV pressure exceeds aortic pressure (~80 mmHg diastolic) |
| Pressure | LV pressure rises to peak systolic (~120 mmHg); aortic pressure rises in parallel |
| Volume | Rapid decrease - ~70% of stroke volume ejected in this phase |
| Heart sound | None |
Phase D - Reduced Ventricular Ejection
| Parameter | Event |
|---|---|
| ECG | T wave (ventricular repolarization) |
| Valves | Aortic valve still open |
| Pressure | LV and aortic pressure begin to fall as blood runs off into peripheral arteries |
| Volume | Continues to fall; reaches end-systolic volume (ESV) ~50 mL |
| Heart sound | None |
Phase E - Isovolumetric Ventricular Relaxation
| Parameter | Event |
|---|---|
| ECG | After T wave (electrical diastole) |
| Valves | Aortic valve closes (aortic pressure exceeds LV pressure); mitral still closed |
| Pressure | LV pressure falls rapidly |
| Volume | Constant - all valves closed again |
| Heart sound | S2 ("dub") - caused by closure of aortic and pulmonary semilunar valves |
Phase F - Rapid Ventricular Filling
| Parameter | Event |
|---|---|
| ECG | Isoelectric |
| Valves | Mitral valve opens (LV pressure falls below LA pressure) |
| Pressure | LV and LA pressure fall together (mitral valve wide open); LV pressure is low and constant |
| Volume | Rapid increase - ~70% of filling occurs here (passive, driven by pressure gradient) |
| Heart sound | S3 - may occur in early rapid filling (normal in children and young adults; pathological over age 40, indicating poor ventricular compliance or volume overload) |
Phase G - Reduced Ventricular Filling (Diastasis)
| Parameter | Event |
|---|---|
| ECG | Isoelectric (before next P wave) |
| Valves | Mitral valve open |
| Pressure | LA and LV pressures equalize at low level |
| Volume | Slow continued filling; reaches end-diastolic volume (EDV) ~120 mL |
| Heart sound | None |
Pressure-Volume Loop (Wiggers Concept)
- Diastolic filling - horizontal line, rightward (volume increases, pressure constant)
- Isovolumetric contraction - vertical line, upward (pressure increases, volume constant)
- Ventricular ejection - leftward (volume decreases)
- Isovolumetric relaxation - vertical line, downward (pressure falls, volume constant)
Summary Table: Events of the Cardiac Cycle
| Phase | ECG | Valve Events | LV Pressure | LV Volume | Heart Sound |
|---|---|---|---|---|---|
| Atrial systole | P wave | MV open | Slight rise | Increases | S4 (if present) |
| Isovolumetric contraction | QRS | MV closes | Rises sharply | Constant | S1 |
| Rapid ejection | ST segment | AV opens | Peak ~120 mmHg | Falls rapidly | - |
| Reduced ejection | T wave | - | Starts falling | Falls to ESV | - |
| Isovolumetric relaxation | After T | AV closes | Falls rapidly | Constant | S2 |
| Rapid filling | Isoelectric | MV opens | Low, constant | Rises rapidly | S3 (if present) |
| Diastasis | Pre-P | MV open | Very low | Rises to EDV | - |
Key Numerical Values (at rest, HR 75 bpm)
| Parameter | Value |
|---|---|
| Duration of cardiac cycle | 0.8 s |
| Duration of systole | ~0.3 s |
| Duration of diastole | ~0.5 s |
| End-diastolic volume (EDV) | ~120-130 mL |
| End-systolic volume (ESV) | ~50-60 mL |
| Stroke volume (SV = EDV - ESV) | ~70 mL |
| Ejection fraction (SV/EDV) | ~60-65% |
| Peak LV systolic pressure | ~120 mmHg |
| LV diastolic pressure | ~5-10 mmHg |
| Peak aortic pressure | ~120 mmHg |
| Diastolic aortic pressure | ~80 mmHg |
Important Clinical Points
- Increased heart rate shortens diastole disproportionately - reduced filling time can lower SV
- S3 (ventricular gallop) in adults = pathological - suggests heart failure or dilated cardiomyopathy
- S4 (atrial gallop) = atrial contraction against a stiff ventricle - seen in hypertensive heart disease, aortic stenosis, hypertrophic cardiomyopathy
- The palmar cutaneous branch analogy: the palmar cutaneous branch is spared in CTS because it exits proximal to the retinaculum - similarly, the AV node delay ensures sequential (not simultaneous) atrial and ventricular contraction
- Atrial kick contributes ~20-30% of ventricular filling at rest; up to 40% in diseased, stiff ventricles - hence loss of atrial kick (e.g., atrial fibrillation) may precipitate acute decompensation