
explain
cd /home/daytona/workspace/attachments/37076cbd-db80-4cef-98d8-c35834427ad8/ && python3 -c " from pypdf import PdfReader reader = PdfReader('MBBS emphysemaa.pdf') print(f'Pages: {len(reader.pages)}') text = '' for i, page in enumerate(reader.pages): t = page.extract_text() text += f'\n--- PAGE {i+1} ---\n' + (t or '') print(text[:8000]) "
cd /home/daytona/workspace/attachments/37076cbd-db80-4cef-98d8-c35834427ad8/ && python3 -c " from pypdf import PdfReader reader = PdfReader('MBBS emphysemaa.pdf') text = '' for i, page in enumerate(reader.pages): t = page.extract_text() text += f'\n--- PAGE {i+1} ---\n' + (t or '') print(text[8000:]) "
Emphysema - Complete Explanation
1. What is COPD?
- Currently the 4th leading cause of death worldwide
- Emphysema and chronic bronchitis are the two major forms of COPD - they often coexist in the same patient because they share the same main cause: cigarette smoking
- COPD is an obstructive lung disease, meaning there is increased resistance to airflow - the FEV1/FVC ratio drops below 0.7
2. Definition of Emphysema
Irreversible (permanent) enlargement of airspaces distal to the terminal bronchiole, accompanied by destruction of their walls, without obvious fibrosis.
- Damage is beyond the terminal bronchiole (in the acini/alveoli)
- The walls are destroyed (not just stretched)
- There is no fibrosis - this distinguishes it from other lung conditions
3. Types of Emphysema
| Type | Location Affected | Key Association |
|---|---|---|
| Centriacinar (Centrilobular) | Proximal/central acini (respiratory bronchioles) - distal alveoli spared | Heavy smokers, upper lobes; >95% of cases |
| Panacinar (Panlobular) | Entire acinus uniformly - from respiratory bronchiole to terminal alveoli | α1-antitrypsin (α1-AT) deficiency; lower lobes |
| Paraseptal (Distal Acinar) | Distal part of acinus - near pleura and septa | Spontaneous pneumothorax in young adults; forms bullae |
| Irregular | Irregularly distributed - always with scarring/fibrosis | Clinically insignificant in most cases |
4. Pathogenesis
Main Causes
- Tobacco smoking (accounts for ~80% of COPD)
- α1-antitrypsin (α1-AT) deficiency (genetic cause)
Four Mechanisms
A. Toxic Injury and Inflammation
- Cigarette smoke damages respiratory epithelium
- Resident macrophages and epithelial cells release inflammatory mediators: leukotriene B4, IL-8, TNF
- These attract neutrophils from the circulation
- Neutrophils amplify inflammation and cause structural damage via growth factors and pro-inflammatory cytokines
B. Protease-Antiprotease Imbalance (Most Important)
- Nicotine acts as a chemoattractant for neutrophils
- Neutrophils release elastase (a protease) and reactive oxygen species (ROS)
- Elastase breaks down elastin - the elastic tissue that normally holds small airways open via radial traction during expiration
- Normally, α1-antitrypsin (produced by the liver) inhibits elastase
- In smokers or those with α1-AT deficiency: elastase exceeds inhibitor → elastic tissue destruction → airways collapse on expiration → airflow obstruction
C. Oxidative Stress
- Tobacco smoke and inflammatory cells produce oxidants (ROS) causing further tissue damage
- NRF2 is a transcription factor that normally activates antioxidant defense genes (including glutathione)
- Genetic variation in NRF2 is linked to increased susceptibility to smoking-related lung disease
D. Infection
- Does NOT initiate tissue destruction
- Superimposed bacterial/viral infections worsen existing inflammation and chronic bronchitis
5. Why Does Airflow Get Obstructed?
- Loss of elastic tissue → loss of radial traction → small airways collapse during expiration
- Goblet cell hyperplasia → excess mucus plugging airways
- Inflammatory infiltrates in bronchial walls (neutrophils, macrophages, B cells, T cells)
- Smooth muscle hypertrophy + peribronchial fibrosis → thickening of bronchiolar walls
6. α1-Antitrypsin Deficiency (Genetic Emphysema)
- Autosomal recessive disorder
- Encoded at the Pi locus on chromosome 14q
- Pi ZZ genotype (homozygous Z allele): serum α1-AT drops to <15% of normal
- ~1% of all emphysema patients have this defect
-
80% of Pi ZZ individuals develop panacinar emphysema - earlier in life and more severe if they smoke
- α1-AT is produced by hepatocytes, bone marrow cells, and lymphoid cells
- Also causes liver disease (protein accumulates in hepatocytes)
7. Morphology (What You See)
Gross (Naked Eye)
- Voluminous, enlarged lungs - often overlap and hide the heart
- Upper two-thirds more severely affected
- Blebs (<1 cm) and bullae (>1 cm) - large air-filled cysts, especially at the apex
Microscopic (Under the Microscope)
- Abnormally large alveoli separated by thin, destroyed septa
- Loss of alveolar attachments to small airway walls
- Pores of Kohn (inter-alveolar openings) become so large that septa appear to be "floating" in airspace
- Inflammatory changes around small airways
8. Clinical Features (Signs & Symptoms)
| Feature | Explanation |
|---|---|
| Dyspnea | Insidious onset, progressive - usually first symptom |
| Barrel chest | Hyperinflated lungs push ribs outward |
| Prolonged expiration | Patient hunches forward, breathes through pursed lips |
| Wheezing | Narrowed, collapsing airways |
| Cough | Due to mucus and inflammation |
| "Pink Puffer" | Over-ventilates to maintain near-normal blood gases; pink (not cyanosed), breathless |
- Narrowed airways → can't fully exhale → residual air builds up → hyperinflation
9. Complications
- Pulmonary arterial hypertension - from chronic hypoxia causing prolonged vasoconstriction
- Cor pulmonale (right heart enlargement from pulmonary hypertension) → right-sided heart failure
- Pneumothorax - especially from rupture of bullae (particularly in paraseptal emphysema in young adults)
- Coronary artery disease
- Respiratory failure
- Right-sided heart failure
- Massive lung collapse (pneumothorax)
10. Diagnosis
| Test | Finding |
|---|---|
| Arterial blood gas | Low O₂, high CO₂ |
| Chest X-ray | Hyperinflation, flattened diaphragm, bullae |
| Spirometry (gold standard) | Reduced FEV1, FEV1/FVC <0.7 - confirms airflow obstruction |
11. Treatment
- Smoking cessation - most important intervention
- Oxygen therapy
- Long-acting bronchodilators + inhaled corticosteroids
- Chest physiotherapy
- Surgical options:
- Bullectomy (removal of bullae)
- Lung volume reduction surgery
- Lung transplantation
- α1-AT replacement therapy - under evaluation for genetic cases
12. Other Special Forms
| Form | Description |
|---|---|
| Compensatory hyperinflation | Remaining alveoli expand to fill space after surgical removal of lung/lobe (not true emphysema) |
| Obstructive overinflation | Air trapped by partial airway blockage (tumor, foreign body) - can be life-threatening |
| Bullous emphysema | Large bullae (>1 cm) near apex; can rupture → pneumothorax |
| Interstitial emphysema | Air enters connective tissue stroma, mediastinum, or subcutaneous tissue (surgical emphysema) |
Quick Summary
Emphysema = permanent destruction of alveolar walls distal to terminal bronchioles → air trapping → hyperinflation → obstructive airflow pattern. Main causes are smoking (centriacinar type) and α1-AT deficiency (panacinar type). The core mechanism is elastase-antiprotease imbalance destroying lung elastic tissue. Complications include cor pulmonale, respiratory failure, and pneumothorax.
Make a visual diagram showing the protease-antiprotease imbalance mechanism
Medical educational diagram showing the protease-antiprotease imbalance mechanism in emphysema. The diagram should be a clean flowchart/pathway diagram with two parallel columns or pathways: LEFT SIDE - Normal (Balanced) State: - Cigarette smoke / noxious particles - Arrow down to: Neutrophils recruited to lung - Neutrophils release: Elastase (protease) - Balanced scale icon showing: Elastase ←→ α1-Antitrypsin - Result: Elastin intact, small airways held open, normal expiration RIGHT SIDE - Imbalanced State (Emphysema): - Cigarette smoke (heavy) OR α1-Antitrypsin deficiency (genetic, chromosome 14q, Pi ZZ genotype) - Arrow down to: Excess neutrophil recruitment + ROS production - Excess Elastase released, insufficient α1-Antitrypsin - Tipped/broken scale showing Elastase >> α1-AT - Elastin destroyed in alveolar walls - Loss of radial traction on small airways - Airways collapse during expiration - Air trapping → Hyperinflation → Permanent alveolar wall destruction = EMPHYSEMA Color coding: Green for normal/protective elements, Red/orange for damaging elements, Blue for structural lung tissue. Clear arrows showing progression. Title at top: "Protease-Antiprotease Imbalance in Emphysema". Clean white background, medical textbook style.
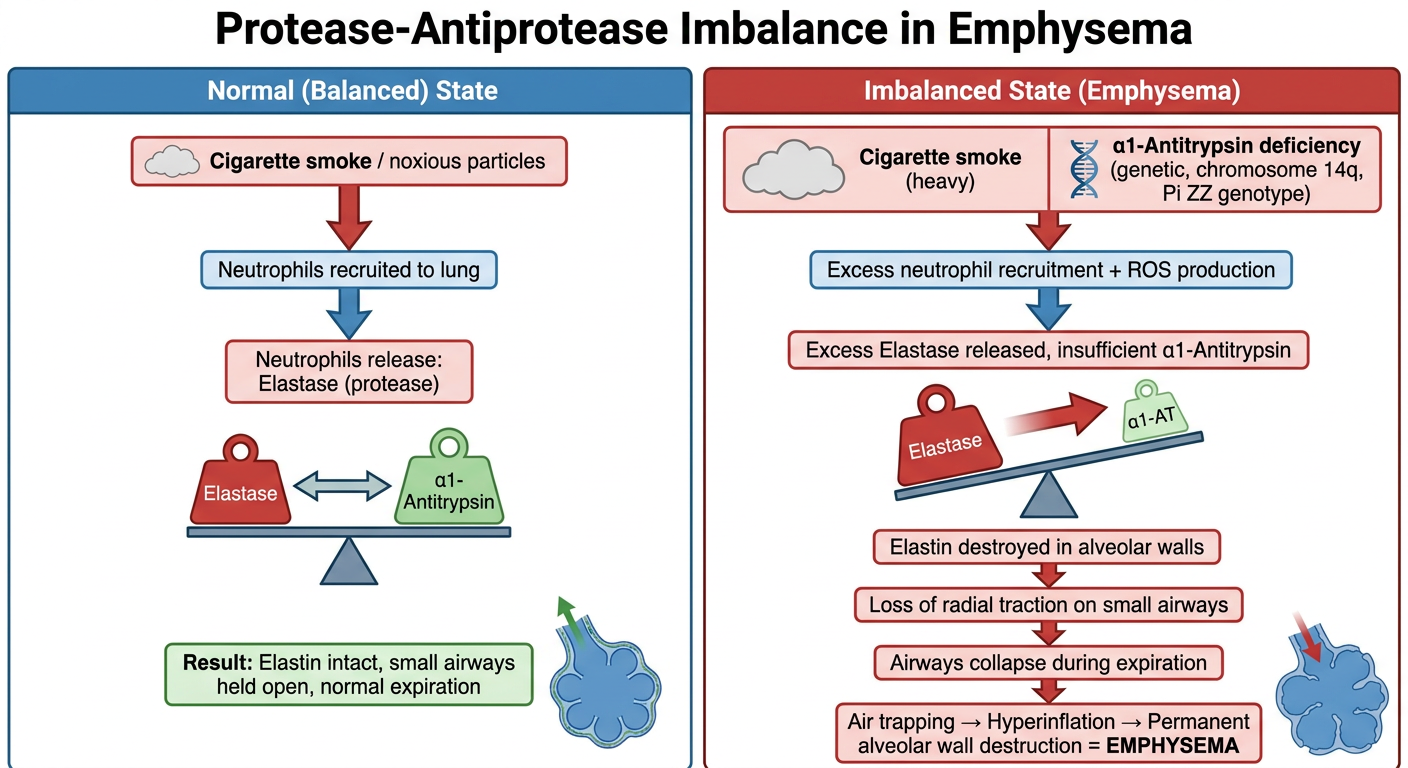
- Cigarette smoke recruits neutrophils, which release elastase
- α1-Antitrypsin (produced by the liver) keeps elastase in check
- Elastin is preserved, small airways stay open via radial traction, and expiration is normal
- Heavy smoking OR genetic α1-AT deficiency (Pi ZZ genotype, chromosome 14q) tips the balance
- Elastase overwhelms the available α1-AT
- Elastin in alveolar walls is digested and destroyed
- Without elastic support, small airways collapse during expiration
- Air traps in the lungs → hyperinflation → permanent alveolar wall destruction = Emphysema
what causes alveolar wall destruction
1. Protease-Antiprotease Imbalance (Primary Mechanism)
- Cigarette smoke and noxious particles recruit neutrophils and macrophages into the lung
- These cells release proteases - mainly elastase and matrix metalloproteinases (MMPs)
- Elastase directly digests elastin, the structural protein that makes up the alveolar wall framework
- Normally, α1-antitrypsin neutralizes elastase - but in smokers or Pi ZZ individuals, elastase activity overwhelms the inhibitor
- Result: the connective tissue scaffold of alveolar walls is broken down and cannot be repaired
2. Oxidative Stress
- Tobacco smoke and activated inflammatory cells (neutrophils, macrophages) flood the lung with reactive oxygen species (ROS)
- ROS directly damage alveolar epithelial cells and endothelial cells
- ROS also inactivate α1-antitrypsin, making the protease-antiprotease imbalance even worse
- The antioxidant defense (controlled by NRF2) is overwhelmed in heavy smokers
3. Alveolar Cell Apoptosis (Programmed Cell Death)
- Oxidative stress and inflammatory mediators trigger apoptosis (cell death) of:
- Type I pneumocytes (cover alveolar surface)
- Type II pneumocytes (repair and surfactant-producing cells)
- Capillary endothelial cells
- When these cells die faster than they can be replaced, the alveolar wall physically disintegrates
- This is a key reason why emphysematous damage is irreversible - the repair machinery is itself destroyed
4. Chronic Inflammation
- Persistent inflammatory cells in the alveolar walls release:
- TNF-α, IL-8, leukotriene B4 - sustain neutrophil/macrophage recruitment
- Growth factors that paradoxically cause structural remodeling rather than proper repair
- This chronic low-grade inflammation keeps the destructive cycle going even after smoking stops
The End Result
| What Gets Destroyed | Consequence |
|---|---|
| Elastin fibers | Loss of elastic recoil and radial traction |
| Alveolar septa | Smaller air sacs merge into large spaces |
| Capillary bed | Reduced gas exchange surface area |
| Airway support structures | Airways collapse on expiration |
gross and microscopy
Gross Morphology (Naked Eye)
Overall Appearance
- Lungs are voluminous and over-inflated - they are larger and heavier than normal
- They overlap and hide the heart when the chest is opened (a classic finding)
- Lungs feel spongy and may not collapse normally when the chest is opened
Distribution
- Upper two-thirds of the lungs are more severely affected (especially in centriacinar/smoking-related emphysema)
- Panacinar (α1-AT deficiency) preferentially affects the lower lobes and bases
Surface Features
- Blebs - air-filled spaces less than 1 cm, just under the pleura (subpleural)
- Bullae - larger air-filled cysts greater than 1 cm, often at the apex
- Bullae are especially characteristic of:
- Paraseptal (distal acinar) emphysema
- Irregular emphysema secondary to scarring
Cut Surface
- Large, abnormally wide alveoli visible to the naked eye
- Thin, wispy alveolar walls between the enlarged spaces
- Loss of the normal fine sponge-like texture
Microscopic Morphology (Histology)
Alveolar Changes
- Abnormally enlarged alveoli - the defining feature
- Thinned and destroyed alveolar septa - walls are sparse and fragile
- Loss of alveolar attachments to the outer wall of small airways - the airways lose their structural support
Pores of Kohn
- The inter-alveolar pores (Pores of Kohn) become so enlarged that adjacent alveoli merge
- Septa appear to be "floating" freely in airspace, or protrude blindly into the lumen with a club-shaped end - a hallmark microscopic sign
Vascular Changes
- Reduced capillary bed in alveolar walls
- Thickening of pulmonary arterial walls in advanced disease (due to pulmonary hypertension)
Airway / Inflammatory Changes
- Inflammatory infiltrates in bronchial and bronchiolar walls:
- Neutrophils, macrophages, B cells (sometimes forming follicles), T cells
- Goblet cell hyperplasia - excess mucus-secreting cells
- Smooth muscle hypertrophy in bronchiolar walls
- Peribronchial fibrosis - thickening of tissue around small airways
Side-by-Side Comparison
| Feature | Normal Lung | Emphysematous Lung |
|---|---|---|
| Alveolar size | Small, uniform | Large, irregular, merged |
| Alveolar wall | Intact, thin but continuous | Thinned, fragmented, destroyed |
| Septa | Connect alveoli firmly | Floating, club-ended remnants |
| Capillaries | Rich network in walls | Reduced, sparse |
| Airways | Open, supported | Collapsed, inflamed, thickened walls |
| Lung volume | Normal | Dramatically increased |
| Appearance | Fine sponge texture | Coarse, large holes visible |
Key Exam Points
- Gross: Voluminous lungs, hidden heart, subpleural bullae at apex
- Micro: Enlarged alveoli + thin destroyed septa + floating/club-ended septal remnants + inflammatory infiltrates in airways
- The absence of fibrosis microscopically is what separates emphysema from other destructive lung conditions
- Bullae >1 cm rupturing into the pleural space = spontaneous pneumothorax (classic in young adults with paraseptal emphysema)
why do blebs and bullae form
Step-by-Step Formation
Step 1 - Alveolar Wall Destruction
- Elastase and ROS destroy the walls between adjacent alveoli
- Multiple small alveoli lose their separating septa and merge into one larger space
- This is called confluence - the merged space holds more air than any single alveolus
Step 2 - Ball-Valve / Check-Valve Effect
- The small airways feeding these enlarged spaces become partially obstructed (inflamed walls, mucus, loss of elastic support)
- Air can flow in during inspiration (airways are pulled open by negative pressure)
- But during expiration, the already-collapsing airway closes before all the air escapes
- Result: more air enters than leaves with each breath cycle - progressive air trapping
Step 3 - Progressive Pressure Build-Up
- With each breath, a little more air accumulates in the trapped space
- The pressure inside the merged airspace gradually exceeds the surrounding lung pressure
- The thin, weakened walls of the space stretch outward
Step 4 - Bleb or Bulla Forms
- The expanding air pocket pushes outward toward the pleural surface (path of least resistance)
- It dissects through the loose connective tissue just under the visceral pleura
- A bleb forms when this air pocket is small (<1 cm) - essentially a subpleural air bubble
- With continued air trapping and expansion, the bleb grows into a bulla (>1 cm)
Why the Subpleural Location?
- Central lung parenchyma is surrounded and reinforced by adjacent alveoli on all sides
- Peripheral alveoli near the pleura have no support on one side
- Air preferentially dissects into the subpleural plane
- This is why bullae are almost always found at the apex and along pleural surfaces
Why the Apex Specifically?
- Pleural pressure is most negative (most sub-atmospheric) at the apex due to gravity
- This means apical alveoli are already subjected to greater distending pressure at baseline
- Any air trapping amplifies this further at the apex
- Blood flow is also lowest at the apex, so inflammatory repair is poorest there
Blebs vs Bullae - The Distinction
| Feature | Bleb | Bulla |
|---|---|---|
| Size | <1 cm | >1 cm |
| Wall | Visceral pleura only | Has remnants of lung tissue in wall |
| Contents | Air only | Air only |
| Origin | Subpleural dissection | Confluent destroyed alveoli |
| Main risk | Pneumothorax | Pneumothorax + compress surrounding lung |
Which Type of Emphysema Forms Bullae?
| Type | Bulla Formation |
|---|---|
| Paraseptal (distal acinar) | Most characteristic - multiple continuous enlarged spaces along septa and pleura; classic cause of spontaneous pneumothorax in young adults |
| Irregular emphysema | Bullae form adjacent to areas of fibrosis/scarring |
| Centriacinar (severe) | Can form large apical bullae in advanced disease |
| Panacinar | Less common, but can occur at lung bases |
The Danger - Pneumothorax
- Air escapes into the pleural space (which is normally a potential space under negative pressure)
- The negative pressure of the pleural space is lost
- The lung collapses on that side
- This is spontaneous pneumothorax - the classic complication of bullous/paraseptal emphysema, typically in tall, thin young men with apical bullae
anionic gap
Formula
Why Does a "Gap" Exist?
Measured cations:    Na⁺ (main), K⁺ (often omitted)
Measured anions:     Cl⁻ + HCO₃⁻
Unmeasured anions:   Albumin, phosphate, sulfate, organic acids
Unmeasured cations:  Ca²⁺, Mg²⁺, K⁺
Using AG to Classify Metabolic Acidosis
High AG Metabolic Acidosis (AG > 12)
| Mnemonic | Cause |
|---|---|
| M | Methanol poisoning |
| U | Uremia (renal failure) |
| D | Diabetic ketoacidosis (DKA) |
| P | Propylene glycol / Paracetamol |
| I | Isoniazid / Iron overdose |
| L | Lactic acidosis |
| E | Ethylene glycol |
| S | Salicylates |
Normal AG (Hyperchloremic) Metabolic Acidosis (AG 8-12)
| Cause | Example |
|---|---|
| H | Hyperalimentation (TPN) |
| A | Addison's disease / Acetazolamide |
| R | Renal tubular acidosis (RTA) |
| D | Diarrhea (loss of HCO₃⁻ in stool) |
Corrected AG for Albumin
Delta-Delta Ratio (Δ/Δ)
| Ratio | Interpretation |
|---|---|
| < 0.4 | Normal AG metabolic acidosis also present |
| 0.4 - 0.8 | Combined high AG + normal AG acidosis |
| 1 - 2 | Pure high AG metabolic acidosis |
| > 2 | Metabolic alkalosis also present |
Quick Clinical Example
- Na⁺ = 138, Cl⁻ = 100, HCO₃⁻ = 10
- AG = 138 - (100 + 10) = 28 → High AG
- Albumin = 4 g/dL (normal, no correction needed)
- Diagnosis: High AG metabolic acidosis → DKA most likely
Summary Table
| High AG | Normal AG | |
|---|---|---|
| Mechanism | Unmeasured acid accumulates | HCO₃⁻ lost, Cl⁻ rises |
| Cl⁻ | Normal | High |
| Key causes | DKA, lactic acidosis, uremia, toxins | Diarrhea, RTA, saline infusion |
| AG value | >12 | 8-12 |
Search for recent research on anion gap in clinical practice
"anion gap" AND "clinical practice"
"anion gap" AND "metabolic acidosis" AND "outcomes"
anion gap clinical practice recent research 2024 2025
PMID: 40728495
PMID: 40822945
PMID: 40796876
Recent Research on Anion Gap in Clinical Practice
1. AG as a Dynamic Prognostic Biomarker in Sepsis
| Trajectory Class | Pattern | ICU Mortality | Hospital Mortality |
|---|---|---|---|
| Class 1 | Normal, stable | 14.5% | 19.4% |
| Class 2 | High, declining | 21.9% | 31.9% |
| Class 3 | Progressive acidosis (rising high AG) | 30.6% | 35.9% |
2. Albumin-Corrected AG (ACAG) is Superior to Plain AG
- ACAG predicted 30-day mortality with AUC 0.643 vs. plain AG at 0.604
- ACAG had a linear relationship with mortality - higher ACAG = higher death risk
- ACAG was mediated through worsening renal function (BUN, creatinine) and disease severity scores
3. Mixed Acid-Base Disorders - Updated 2025 Curriculum
- Mixed acid-base disorders are frequently missed because opposing disturbances can bring pH back toward normal
- A systematic approach is mandatory: history + exam + AG + electrolytes + urine parameters together
- The delta-delta ratio and compensatory response evaluation remain the key tools
- Eight clinical cases are provided to illustrate real-world mixed disorder diagnosis
4. Negative Anion Gap - An Emerging Recognition
5. Fluid Choice in DKA Affects the AG
Summary of Key Clinical Takeaways from Recent Research
| Finding | Clinical Implication |
|---|---|
| Serial AG trajectories predict sepsis mortality better than a single value | Monitor AG daily in ICU sepsis patients, not just on admission |
| ACAG (albumin-corrected) is more accurate than plain AG | Always correct for albumin in critically ill or malnourished patients; ACAG >20 = high risk |
| Mixed disorders are underdiagnosed | Use delta-delta, compensatory response checks, and urine electrolytes systematically |
| Normal saline in DKA causes hyperchloremic acidosis | AG may normalize before true DKA resolution; prefer balanced crystalloids |
| Negative AG signals unmeasured cation excess | Consider in alkalosis, lithium toxicity, or severe hypercalcemia |
electron transport chian
Location
Overview
The Five Complexes
Complex I - NADH Dehydrogenase
- Accepts electrons from NADH (from matrix)
- Transfers electrons to ubiquinone (CoQ)
- Pumps 4 H⁺ from matrix → intermembrane space
- Contains FMN (flavin mononucleotide) and iron-sulfur clusters
- Inhibited by rotenone (insecticide), metformin, amytal
Complex II - Succinate Dehydrogenase
- Accepts electrons from FADH₂ (from Krebs cycle - succinate → fumarate)
- Transfers electrons to ubiquinone (CoQ)
- Does NOT pump H⁺ - this is why FADH₂ generates less ATP than NADH
- Also part of Krebs cycle (dual function)
- Inhibited by malonate (competitive inhibitor of succinate)
Ubiquinone (Coenzyme Q / CoQ₁₀)
- Mobile electron carrier - freely diffuses within the inner membrane
- Collects electrons from Complexes I and II
- Carries them to Complex III
- Exists in three forms: ubiquinone (oxidized), semiquinone (radical), ubiquinol (reduced)
Complex III - Cytochrome bc₁ Complex
- Accepts electrons from ubiquinol (CoQH₂)
- Transfers electrons to cytochrome c via the Q cycle
- Pumps 4 H⁺ into intermembrane space per 2 electrons
- Contains cytochrome b, cytochrome c₁, and Rieske iron-sulfur protein
- Inhibited by antimycin A
Cytochrome c
- Mobile electron carrier - small protein in intermembrane space
- Carries electrons one at a time from Complex III → Complex IV
- Also a key trigger of apoptosis when released into cytoplasm
Complex IV - Cytochrome c Oxidase
- Accepts electrons from cytochrome c
- Transfers them to O₂ (the final electron acceptor) → forms H₂O
- Pumps 2 H⁺ into intermembrane space
- Contains cytochrome a, cytochrome a₃, and copper centers (CuA, CuB)
- Inhibited by cyanide, carbon monoxide, azide (bind to cytochrome a₃ and block O₂ binding)
Complex V - ATP Synthase (F₀F₁-ATPase)
- Not part of electron transport - but couples to it
- H⁺ ions flow back into matrix through the F₀ subunit (proton channel)
- This rotation drives the F₁ subunit to synthesize ATP from ADP + Pᵢ
- Called chemiosmosis (Mitchell's chemiosmotic hypothesis)
- Inhibited by oligomycin (blocks F₀ proton channel)
The Full Sequence
NADH → Complex I → CoQ ←── Complex II ← FADH₂
                    ↓
               Complex III
                    ↓
              Cytochrome c
                    ↓
               Complex IV → O₂ → H₂O

H⁺ gradient → Complex V → ATP
H⁺ Pumping Summary
| Complex | H⁺ Pumped per 2e⁻ |
|---|---|
| Complex I | 4 H⁺ |
| Complex II | 0 H⁺ |
| Complex III | 4 H⁺ |
| Complex IV | 2 H⁺ |
| Total (NADH route) | 10 H⁺ |
| Total (FADH₂ route) | 6 H⁺ |
ATP Yield
- ~2.5 H⁺ needed to make 1 ATP by Complex V
- NADH → 10 H⁺ → ~2.5 ATP
- FADH₂ → 6 H⁺ → ~1.5 ATP
- Glycolysis: 2 ATP
- Pyruvate decarboxylation + Krebs: 2 ATP
- ETC: ~28 ATP
- Grand total: ~30-32 ATP
Chemiosmosis - The Driving Force
- Chemical gradient - high H⁺ concentration in intermembrane space vs. matrix
- Electrical gradient - intermembrane space is more positive than matrix
Uncouplers
| Uncoupler | Mechanism | Clinical relevance |
|---|---|---|
| 2,4-Dinitrophenol (DNP) | Carries H⁺ across membrane directly | Historical weight-loss drug; toxic |
| Thermogenin (UCP1) | Natural uncoupler in brown fat | Cold adaptation, fever generation |
| Aspirin (high dose) | Uncouples oxidative phosphorylation | Contributes to fever reduction |
| Thyroid hormone | Increases UCP expression | Explains heat intolerance in hyperthyroidism |
Clinically Important Inhibitors
| Drug/Toxin | Target | Effect |
|---|---|---|
| Rotenone | Complex I | Blocks NADH oxidation |
| Antimycin A | Complex III | Blocks CoQ-cytochrome c electron transfer |
| Cyanide (CN⁻) | Complex IV | Binds Fe³⁺ in cytochrome a₃, blocks O₂ binding → histotoxic hypoxia |
| Carbon monoxide | Complex IV | Similar to cyanide + binds hemoglobin |
| Metformin | Complex I | Mild inhibition → reduces hepatic ATP → activates AMPK → lowers blood glucose |
| Oligomycin | Complex V (F₀) | Blocks proton channel, inhibits ATP synthesis |
Reactive Oxygen Species (ROS)
- Electrons occasionally "leak" from Complexes I and III and react with O₂ to form superoxide (O₂•⁻)
- This is converted to H₂O₂ by superoxide dismutase (SOD), then to H₂O by catalase/glutathione peroxidase
- Excess ROS causes oxidative stress → DNA damage, lipid peroxidation, protein damage
- Relevant to aging, neurodegeneration, and ischemia-reperfusion injury
where is oxygens role
Oxygen is the Final Electron Acceptor
4 e⁻ + 4 H⁺ + O₂ → 2 H₂O
- 4 electrons arrive via cytochrome c (one at a time)
- 4 H⁺ are pulled from the matrix
- 1 O₂ molecule accepts all 4 electrons simultaneously
- Product: 2 molecules of water
Why Oxygen Must Accept the Electrons
| Carrier | Reduction Potential (E°') |
|---|---|
| NADH | -0.32 V |
| CoQ | +0.04 V |
| Cytochrome c | +0.23 V |
| O₂ → H₂O | +0.82 V |
What Happens if Oxygen is Absent
- Complex IV has nowhere to send electrons
- Cytochrome c backs up - cannot donate electrons to Complex IV
- Complex III backs up - cannot pass electrons to cytochrome c
- CoQ backs up - reduced CoQH₂ accumulates
- Complexes I and II stop - cannot pass electrons to CoQ
- NADH and FADH₂ accumulate - cannot be reoxidized
- Krebs cycle halts - needs NAD⁺ and FAD to keep running
- H⁺ pumping stops entirely - proton gradient collapses
- Complex V stops - no gradient = no ATP synthesis
- Cell switches to anaerobic glycolysis → lactic acid builds up
- Hypoxia (low O₂ delivery)
- Cyanide/CO poisoning (O₂ present but Complex IV is blocked - same result)
- Ischemia (no blood flow → no O₂)
The Partial Reduction Problem - ROS
| Partial Reduction | Product |
|---|---|
| O₂ + 1 e⁻ | Superoxide (O₂•⁻) |
| O₂ + 2 e⁻ | Hydrogen peroxide (H₂O₂) |
| O₂ + 3 e⁻ | Hydroxyl radical (•OH) - most damaging |
| O₂ + 4 e⁻ | Water (H₂O) - safe, normal product |
Summary of Oxygen's Exact Role
| Role | Detail |
|---|---|
| Final electron acceptor | Accepts 4 e⁻ at Complex IV |
| Thermodynamic driver | Its high electron affinity creates the "pull" through the whole chain |
| Water producer | Combines with e⁻ and H⁺ to form H₂O |
| Chain gatekeeper | Without O₂, the entire ETC and Krebs cycle stop |
| ROS source | Partial reduction produces damaging free radicals |
how does proton is formed from the elctron give
Start Here - What NADH Actually Carries
Hydrogen atom = 1 proton (H⁺) + 1 electron (e⁻)
NAD⁺ + 2H → NADH + H⁺
What Happens When NADH Donates to Complex I
NADH → NAD⁺ + H⁺ + 2e⁻
What Happens at Ubiquinone (CoQ) - Key Step
CoQ + 2e⁻ (from Complex I/II) + 2H⁺ (from matrix) → CoQH₂
CoQH₂ → CoQ + 2H⁺ (into intermembrane space) + 2e⁻ (to cytochrome c)
The Q Cycle (Complex III) - Amplifies Proton Pumping
- One CoQH₂ donates electrons and releases 2 H⁺ into intermembrane space
- One CoQ picks up 2 H⁺ from the matrix to become CoQH₂ again
- Net result: 4 H⁺ pumped per 2 electrons passing through
Complex I and IV - Direct Pumping
- Complex I: electron flow through iron-sulfur clusters causes shape changes that pump 4 H⁺
- Complex IV: as electrons reduce O₂ to H₂O, the reaction also pumps 2 H⁺ and consumes 4 H⁺ from the matrix (vectorial chemistry)
Full Picture - Where Each H⁺ Comes From
| Source | What Happens |
|---|---|
| NADH/FADH₂ | Already contain H atoms (e⁻ + H⁺ bonded together) |
| Complex I donation | H⁻ splits into 2e⁻ (into chain) + H⁺ (released to matrix) |
| CoQ | Picks up H⁺ from matrix + e⁻ from complexes → carries them as CoQH₂ → releases H⁺ on intermembrane space side |
| Complexes I, III, IV | Use electron energy to physically pump H⁺ across the membrane |
| Complex IV | Pulls H⁺ from matrix to combine with O₂ → H₂O (removes H⁺ from matrix, builds gradient) |
Simple Analogy
- The oxygen part = the electron, goes into the electrical circuit (the chain)
- The hydrogen part = the proton, gets pumped across the membrane
One-Line Summary
erthopoesis
Sites of Erythropoiesis (Changes with Age)
| Stage | Site |
|---|---|
| Embryo (0-2 months) | Yolk sac (primitive erythropoiesis) |
| Fetus (2-7 months) | Liver (main site), spleen, lymph nodes |
| Fetus (5 months onward) | Bone marrow begins |
| Birth onwards | Bone marrow exclusively |
| Child | All bones have active red marrow |
| Adult | Axial skeleton only - vertebrae, sternum, ribs, pelvis, proximal femur/humerus |
The Developmental Sequence
Pluripotent Stem Cell (HSC)
        ↓
  Common Myeloid Progenitor (CMP)
        ↓
  BFU-E  (Burst Forming Unit - Erythroid)
        ↓         ← EPO starts acting here
  CFU-E  (Colony Forming Unit - Erythroid)
        ↓         ← EPO most sensitive here
  Pronormoblast (Proerythroblast)
        ↓
  Basophilic Normoblast (Early)
        ↓
  Polychromatophilic Normoblast (Intermediate)
        ↓
  Orthochromatic Normoblast (Late) ← nucleus ejected here
        ↓
  Reticulocyte  ← released into blood
        ↓ (1-2 days in blood)
  Mature Erythrocyte (RBC)
Each Stage Explained
1. Pronormoblast (Proerythroblast)
- Largest cell in the series (~20 µm)
- Large nucleus, prominent nucleoli
- Deeply basophilic cytoplasm (lots of ribosomes, making hemoglobin machinery)
- Hemoglobin synthesis begins here
2. Basophilic Normoblast
- Smaller than pronormoblast
- Intensely blue cytoplasm (heavy ribosome content)
- Nucleus condensing, nucleoli disappearing
- Active hemoglobin synthesis
3. Polychromatophilic Normoblast
- Cytoplasm is mixed blue and pink (basophilic ribosomes + eosinophilic hemoglobin)
- "Polychromatic" = multiple colors
- Nucleus is smaller and more condensed
- This is the last stage that can divide
4. Orthochromatic Normoblast (Late Normoblast)
- Cytoplasm is now predominantly pink - mostly hemoglobin
- Nucleus becomes pyknotic (dense, dark, small)
- Nucleus is then extruded (ejected) - this is unique to mammalian RBCs
- The cell is now anucleate
5. Reticulocyte
- Anucleate but still contains residual RNA and organelles (mitochondria, ribosomes)
- Appears slightly larger than mature RBC
- Stains with supravital stains (new methylene blue) showing a reticular network
- Spends 1-2 days in bone marrow, then released into blood
- Circulates for 1-2 days in peripheral blood, then loses remaining organelles
- Normal reticulocyte count: 0.5-2.5% of RBCs
- Elevated reticulocytes = sign of active erythropoiesis (good response to anemia)
6. Mature Erythrocyte
- Biconcave disc, 7-8 µm diameter
- No nucleus, no organelles
- Packed with hemoglobin (~33 g/dL intracellular)
- Lifespan: 120 days
Regulation of Erythropoiesis
Erythropoietin (EPO) - The Master Regulator
- Glycoprotein hormone, 90% produced by peritubular fibroblasts of the kidney (cortex), 10% by liver
- Triggered by: hypoxia → HIF-1α (Hypoxia Inducible Factor) → EPO gene transcription
- Acts on: CFU-E (most sensitive) and BFU-E
- Effects:
- Promotes survival of erythroid progenitors (inhibits apoptosis)
- Stimulates proliferation and differentiation
- Speeds up maturation
- Promotes early reticulocyte release from marrow
Feedback Loop
Hypoxia / Anemia
      ↓
Kidney senses low PaO₂
      ↓
HIF-1α activated → EPO released
      ↓
Bone marrow → increased RBC production
      ↓
O₂ delivery restored → EPO falls (negative feedback)
Other Regulators
| Factor | Effect |
|---|---|
| Iron | Required for heme synthesis; deficiency = microcytic anemia |
| Vitamin B12 | Required for DNA synthesis; deficiency = megaloblastic anemia |
| Folate | Required for DNA synthesis (thymidine); deficiency = megaloblastic anemia |
| Androgens | Stimulate EPO production (explains higher Hb in males) |
| Thyroid hormones | Stimulate erythropoiesis |
| Stem cell factor (SCF) | Acts on early progenitors (BFU-E) |
| IL-3, GM-CSF | Support early erythroid proliferation |
Hemoglobin Synthesis (Happens During Erythropoiesis)
Heme Synthesis
- Succinyl-CoA + Glycine → ALA (δ-aminolevulinic acid) - by ALA synthase (rate-limiting step, in mitochondria)
- ALA → Porphobilinogen → Uroporphyrinogen → Coproporphyrinogen → Protoporphyrin IX (in cytoplasm)
- Protoporphyrin IX + Fe²⁺ → Heme (in mitochondria, by ferrochelatase)
Globin Chains
- Alpha chains: encoded on chromosome 16
- Beta chains: encoded on chromosome 11
- Heme + Globin → Hemoglobin
Hemoglobin Types
| Type | Chains | When Present |
|---|---|---|
| HbF (Fetal) | α₂γ₂ | Fetus and newborn; higher O₂ affinity |
| HbA (Adult) | α₂β₂ | Main adult hemoglobin (~97%) |
| HbA₂ | α₂δ₂ | ~2.5% of adult Hb |
Iron Metabolism in Erythropoiesis
- Dietary iron absorbed in duodenum as Fe²⁺ (reduced by vitamin C)
- Transported in blood bound to transferrin
- Taken up by erythroid precursors via transferrin receptor (TfR1)
- Stored as ferritin (intracellular) or hemosiderin (excess)
- Regulated by hepcidin (liver) - master iron regulator:
- High iron → high hepcidin → blocks ferroportin → less iron absorption
- Anemia/hypoxia → low hepcidin → more iron available
Key Clinical Correlations
| Condition | Mechanism | RBC Appearance |
|---|---|---|
| Iron deficiency anemia | Low iron → less heme | Microcytic, hypochromic |
| B12/Folate deficiency | Impaired DNA synthesis → cells can't divide, keep growing | Macrocytic, megaloblastic (hypersegmented neutrophils) |
| Chronic kidney disease | Low EPO production | Normocytic, normochromic anemia |
| Polycythemia vera | JAK2 mutation → EPO-independent proliferation | Excess RBCs, low EPO |
| Aplastic anemia | Stem cell destruction | Pancytopenia |
| Thalassemia | Defective globin chain synthesis | Microcytic; ineffective erythropoiesis |
| Sideroblastic anemia | Defective heme synthesis (ALA synthase or ferrochelatase) | Ring sideroblasts on Prussian blue stain |
One-Line Summary
cardiac cycle
Overview of Phases
DIASTOLE (0.5 sec)          SYSTOLE (0.3 sec)
├─ Isovolumetric relaxation  ├─ Isovolumetric contraction
├─ Rapid filling             ├─ Rapid ejection
├─ Slow filling (diastasis)  └─ Slow ejection
└─ Atrial systole
Phase-by-Phase Breakdown
PHASE 1 - Isovolumetric Relaxation
- Duration: ~0.08 sec
- Trigger: Aortic valve closes (marks end of systole)
- Ventricle begins to relax, pressure drops rapidly
- All valves are CLOSED - mitral, tricuspid, aortic, pulmonary
- Ventricular volume stays constant (no blood entering or leaving)
- Pressure falls from ~80 mmHg → ~8 mmHg (left ventricle)
- Ends when ventricular pressure drops below atrial pressure → mitral valve opens
PHASE 2 - Rapid Ventricular Filling
- Duration: ~0.11 sec
- Mitral and tricuspid valves open
- Blood rushes from atria → ventricles passively (pressure gradient)
- ~70-80% of ventricular filling occurs in this phase
- Ventricular pressure is low (suction effect from elastic recoil)
- Produces the 3rd heart sound (S3) - heard in rapid filling, normal in children/young adults; pathological in heart failure in adults
PHASE 3 - Slow Filling (Diastasis)
- Duration: ~0.19 sec
- Blood flow from atria to ventricles slows down
- Pressures in atria and ventricles nearly equalize
- Shortest and most variable phase - disappears at high heart rates
PHASE 4 - Atrial Systole (Atrial Kick)
- Duration: ~0.11 sec
- SA node fires → atria contract
- Pushes final 20-30% of blood into the ventricles
- Raises ventricular end-diastolic pressure slightly
- Produces the 4th heart sound (S4) when ventricle is stiff (hypertrophied) - always pathological
- Ends when atrial contraction is complete
- End-diastolic volume (EDV) = ~120-130 mL
PHASE 5 - Isovolumetric Contraction
- Duration: ~0.05 sec
- Ventricles receive electrical signal → begin to contract
- Ventricular pressure rises sharply
- All valves are CLOSED - AV valves close (mitral, tricuspid) but aortic/pulmonary haven't opened yet
- Volume stays constant (isovolumetric)
- Closure of AV valves produces 1st heart sound (S1) - "LUB"
- Pressure rises from ~8 mmHg → 80 mmHg (left ventricle)
- Ends when ventricular pressure exceeds aortic pressure (~80 mmHg) → aortic valve opens
PHASE 6 - Rapid Ejection
- Duration: ~0.09 sec
- Aortic and pulmonary valves open
- Blood is forcefully ejected into aorta and pulmonary artery
- ~70% of stroke volume ejected in this phase
- Aortic pressure rises to peak systolic pressure (~120 mmHg)
- Ventricular pressure = Aortic pressure (valves open, no gradient)
PHASE 7 - Slow (Reduced) Ejection
- Duration: ~0.13 sec
- Ventricular contraction weakens
- Ejection slows - remaining ~30% of stroke volume ejected
- Ventricular pressure starts to fall slightly below aortic pressure
- Blood flow momentarily reverses → aortic valve closes
- Closure of semilunar valves produces 2nd heart sound (S2) - "DUB"
- End-systolic volume (ESV) = ~50-60 mL
Key Volume and Pressure Values
| Parameter | Value |
|---|---|
| End-Diastolic Volume (EDV) | ~120-130 mL |
| End-Systolic Volume (ESV) | ~50-60 mL |
| Stroke Volume (SV = EDV - ESV) | ~70 mL |
| Ejection Fraction (EF = SV/EDV) | ~55-65% |
| Peak systolic pressure (LV/Aorta) | ~120 mmHg |
| End-diastolic pressure (LV) | ~8-12 mmHg |
| Dicrotic notch | Brief pressure rise on aortic trace when aortic valve closes |
Valve Events Summary
| Event | Sound | Phase |
|---|---|---|
| Mitral + Tricuspid CLOSE | S1 (LUB) | Start of isovolumetric contraction |
| Aortic + Pulmonary OPEN | Silent | Start of ejection |
| Aortic + Pulmonary CLOSE | S2 (DUB) | Start of isovolumetric relaxation |
| Mitral + Tricuspid OPEN | Silent | Start of rapid filling |
The Four Heart Sounds
| Sound | Timing | Cause | Normal/Abnormal |
|---|---|---|---|
| S1 (LUB) | Start of systole | AV valve closure (mitral louder) | Normal |
| S2 (DUB) | End of systole | Semilunar valve closure (aortic louder) | Normal |
| S3 | Early diastole | Rapid ventricular filling - vibration of walls | Normal in <30 yrs; pathological in adults (heart failure) |
| S4 | Late diastole (pre-systole) | Atrial kick into stiff ventricle | Always pathological (LVH, hypertension, aortic stenosis) |
- S3 gallop = "Ken-tuck-Y" cadence = volume overload
- S4 gallop = "Ten-nes-see" cadence = pressure overload
Wiggers Diagram - What to Know
- Aortic pressure - rises during ejection, shows dicrotic notch at S2
- Left ventricular pressure - rises steeply in isovolumetric contraction, falls in isovolumetric relaxation
- Left atrial pressure - shows a, c, v waves
- Ventricular volume - flat during isovolumetric phases, falls during ejection, rises during filling
- ECG - P wave (atrial depol) → QRS (ventricular depol) → T wave (ventricular repol)
- Heart sounds - S1 after QRS, S2 after T wave
Atrial Pressure Waves (a, c, v)
| Wave | Cause |
|---|---|
| a wave | Atrial contraction (follows P wave) |
| c wave | Mitral valve bulging back into atrium during isovolumetric contraction |
| x descent | Atrial relaxation + downward displacement of AV valves during systole |
| v wave | Venous filling of atrium while mitral valve is closed |
| y descent | Mitral valve opens → atrium empties |
ECG Correlation
| ECG Event | Cardiac Event |
|---|---|
| P wave | Atrial depolarization → atrial systole |
| PR interval | AV node delay (allows ventricular filling) |
| QRS complex | Ventricular depolarization → isovolumetric contraction begins |
| ST segment | Ventricular plateau (all cells depolarized, slow ejection) |
| T wave | Ventricular repolarization → relaxation begins |
| S2 occurs | After T wave ends |
Effect of Heart Rate on the Cycle
- Diastole shortens more than systole - specifically the slow filling (diastasis) phase disappears first
- At very high heart rates, filling time is so short that EDV falls → stroke volume falls
- Compensated by increased contractility (sympathetic stimulation)
- This is why coronary artery disease worsens with exertion - most coronary filling happens in diastole
Clinical Correlations
| Condition | Cardiac Cycle Change |
|---|---|
| Aortic stenosis | Prolonged slow ejection, reduced stroke volume, loud ejection systolic murmur |
| Mitral regurgitation | Blood leaks back during systole → giant v waves, pansystolic murmur, S3 |
| Aortic regurgitation | Blood leaks back in diastole → wide pulse pressure, early diastolic murmur |
| Heart failure | Reduced EF, S3 gallop, elevated EDV and ESV |
| Cardiac tamponade | Pericardial fluid compresses heart → reduced filling → reduced stroke volume → pulsus paradoxus |
| Atrial fibrillation | No atrial systole → loss of atrial kick → reduced EDV by ~20% → absent a wave |