Explain me 10 heart diseases with ECG their ECG changes and explain those changes with ECG Images
Reading File
Finding Sources
Finding Sources
Finding Sources
Searching Images
ECG myocardial infarction ST elevation STEMI
Searching Images
ECG atrial fibrillation irregular rhythm
Searching Images
complete heart block third degree AV block ECG
Searching Images
ventricular tachycardia ECG wide QRS
Searching Images
Wolff-Parkinson-White syndrome ECG delta wave
Searching Images
left ventricular hypertrophy ECG voltage criteria
Searching Images
hypertrophic cardiomyopathy ECG ST changes
Searching Images
pericarditis ECG saddle shaped ST elevation PR depression
Searching Images
pulmonary embolism ECG S1Q3T3 right heart strain
Searching Images
ventricular fibrillation ECG chaotic irregular waveform
10 Heart Diseases — ECG Changes with Images
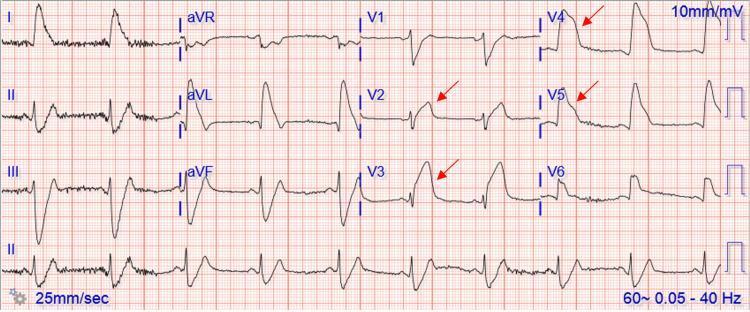
1. 🫀 ST-Elevation Myocardial Infarction (STEMI)
ECG Changes
| Feature | Finding |
|---|---|
| ST segments | Convex (tombstone) elevation ≥1 mm in ≥2 contiguous leads |
| Q waves | Pathological Q waves (>40 ms wide, >25% of R amplitude) develop within hours |
| Reciprocal changes | ST depression in leads opposite the infarct zone |
| T waves | Hyperacute tall peaked T waves in earliest phase; T-inversion later |
| R wave | R-wave loss (regression) in affected territory |
Lead Localization:
- Anterior (LAD): V1–V4 elevation
- Inferior (RCA): II, III, aVF elevation
- Lateral (LCx): I, aVL, V5–V6 elevation
Explanation
The coronary artery occlusion causes transmural ischemia. Injured epicardium has a more positive resting membrane potential, generating a current of injury that elevates the ST segment toward the exploring lead. As necrosis advances, depolarization forces are lost, producing pathological Q waves.

2. 🔥 Acute Pericarditis
ECG Changes
| Feature | Finding |
|---|---|
| ST segments | Diffuse concave/saddle-shaped elevation in nearly all leads EXCEPT aVR, V1 |
| PR segment | Depression in most leads (elevation in aVR) — pathognomonic |
| Spodick's sign | Downsloping TP segment |
| No reciprocal changes | Distinguishes from STEMI |
| No Q waves | Absent (pericardium not involved) |
Explanation
Pericardial inflammation generates a current of injury from the underlying superficial myocardium (epicarditis). Because inflammation is circumferential, ST elevation is diffuse (not in one coronary territory). The inflamed pericardium also causes PR depression because atrial repolarization (Ta wave) is distorted.

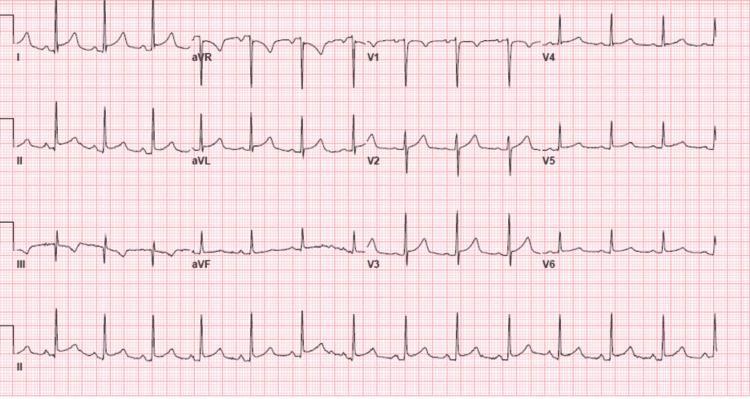
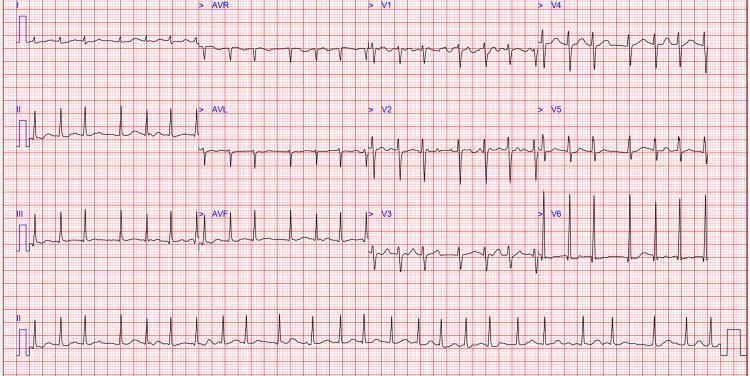
3. ⚡ Atrial Fibrillation (AF)
ECG Changes
| Feature | Finding |
|---|---|
| P waves | Absent — replaced by fibrillatory (f) waves |
| f-waves | Fine chaotic undulations at 350–600 bpm, best seen in V1 |
| Rhythm | Irregularly irregular R-R intervals |
| QRS complex | Narrow (unless aberrant conduction or bundle branch block) |
| Rate | Variable; can be slow, normal, or fast |
Explanation
Multiple re-entrant wavelets circulate randomly throughout the atria (chaotic micro-reentry), preventing a single organized P wave. The AV node receives continuous disorganized impulses; only some pass through (depending on the refractory period), causing the hallmark irregular ventricular response.
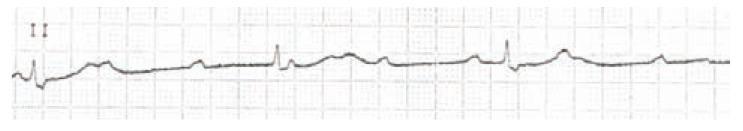
4. 🚫 Complete (Third-Degree) AV Block
ECG Changes
| Feature | Finding |
|---|---|
| AV relationship | Complete dissociation — P waves and QRS complexes are independent |
| P waves | Present, regular, at faster atrial rate (e.g., 70–80 bpm) |
| QRS rate | Slow escape rhythm (20–40 bpm if ventricular; 40–60 bpm if junctional) |
| QRS morphology | Wide (>120 ms) if ventricular escape; narrow if junctional escape |
| PR interval | No fixed PR interval — P waves "march through" QRS and T waves |
Explanation
The conduction system fails completely at the AV node or bundle of His-Purkinje system. Atria continue depolarizing normally from the SA node, but no impulses reach the ventricles. A subsidiary pacemaker (junctional or ventricular) takes over at a much slower rate, maintaining minimal cardiac output.
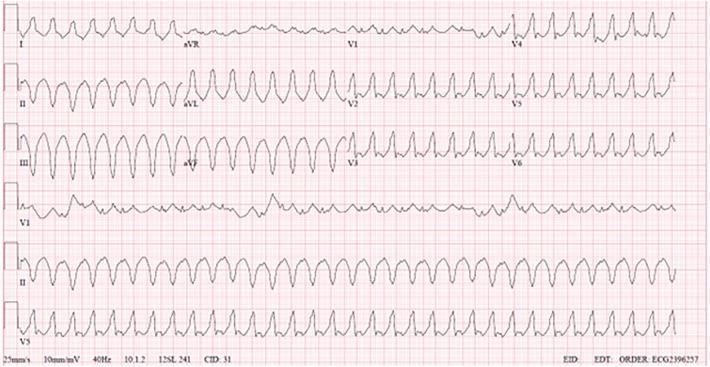
5. ⚡ Ventricular Tachycardia (VT)
ECG Changes
| Feature | Finding |
|---|---|
| Rate | 100–250 bpm |
| QRS | Wide (>120 ms), bizarre morphology |
| Rhythm | Regular (monomorphic VT) |
| P waves | Usually absent or dissociated from QRS |
| AV dissociation | Characteristic — "fusion beats" and "capture beats" pathognomonic |
| Axis | Often extreme left or right deviation |
| Concordance | Positive/negative concordance in V1–V6 favors VT over SVT with aberrancy |
Explanation
An ectopic focus in the ventricular myocardium (below the bundle of His) fires rapidly. Impulses spread cell-to-cell rather than via the fast His-Purkinje system, causing slow conduction and wide bizarre QRS complexes. The atria often continue beating independently under SA node control.
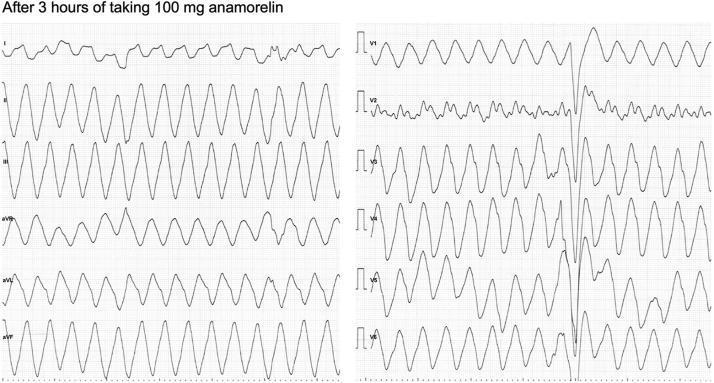
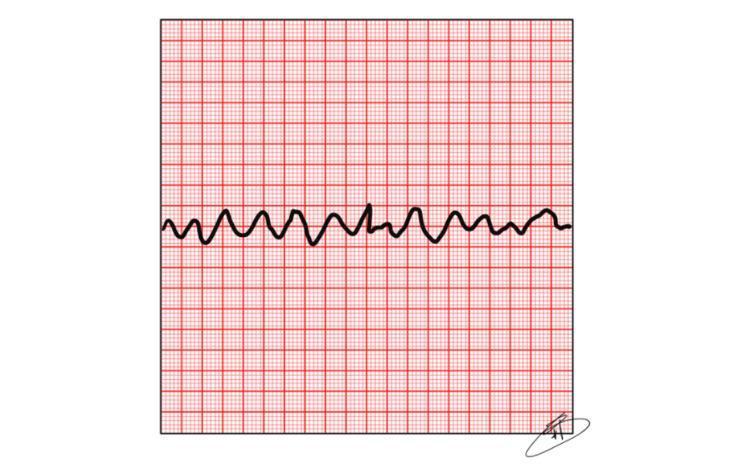
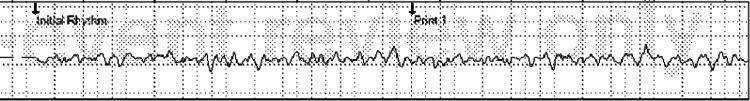
6. 💥 Ventricular Fibrillation (VF)
ECG Changes
| Feature | Finding |
|---|---|
| P waves | Absent |
| QRS complexes | Absent — no organized ventricular activity |
| Rhythm | Chaotic, irregular oscillations |
| Amplitude | Coarse VF: high amplitude waves; Fine VF: low amplitude (worse prognosis) |
| Rate | "Undefined" — oscillations at 150–500/min |
Explanation
Multiple re-entrant circuits fire simultaneously and chaotically throughout the ventricles. There is no coordinated depolarization, no effective contraction, and no cardiac output. This is a cardiac arrest requiring immediate defibrillation.
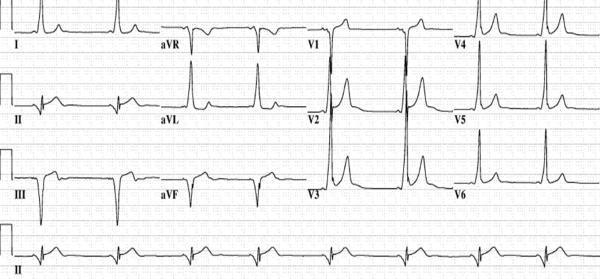
7. ⚡ Wolff-Parkinson-White (WPW) Syndrome
ECG Changes
| Feature | Finding |
|---|---|
| PR interval | Short (<120 ms) — pre-excitation bypasses AV node delay |
| Delta wave | Slurred upstroke at start of QRS (early ventricular activation via accessory pathway) |
| QRS | Wide (>120 ms) due to delta wave |
| ST-T waves | Secondary repolarization changes (discordant to QRS) |
| Location clues | Negative delta in inferior leads → posteroseptal pathway; positive V1 → left-sided pathway |
Explanation
An accessory pathway (Bundle of Kent) bypasses the AV node, allowing early ventricular depolarization before the normal His-Purkinje impulse arrives. This creates the delta wave (slow cell-to-cell conduction through the ventricle) and shortens the PR interval. The risk is that accessory pathways can conduct very rapidly during AF, causing extremely fast ventricular rates (potentially fatal).
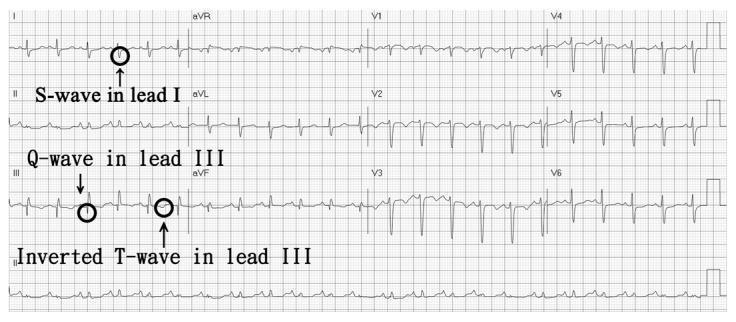
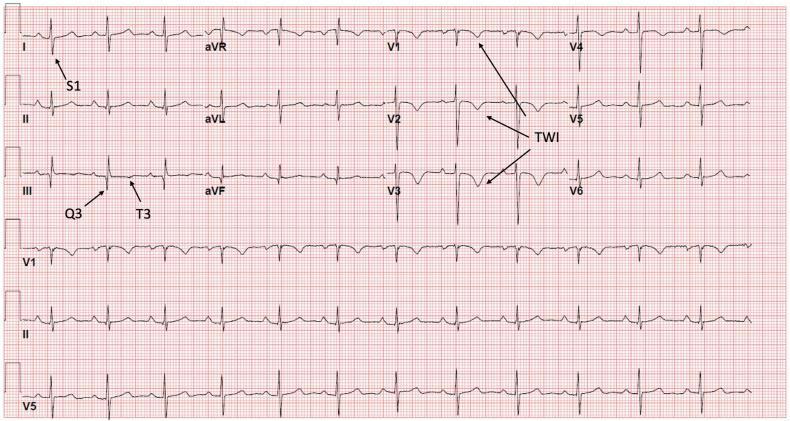
8. 💉 Pulmonary Embolism (PE)
ECG Changes
| Feature | Finding |
|---|---|
| Classic pattern | S1Q3T3 — deep S in I, Q wave in III, T-wave inversion in III |
| Heart rate | Sinus tachycardia (most common finding) |
| Right axis deviation | Acute right heart strain |
| RBBB | Incomplete or complete right bundle branch block |
| T-wave inversions | V1–V4 (right ventricular strain pattern) |
| P pulmonale | Tall peaked P waves in II (right atrial enlargement) |
| Atrial arrhythmias | AF or flutter can occur |
Explanation
Pulmonary artery obstruction causes acute right ventricular pressure overload. The dilated RV shifts the interventricular septum, causes RV strain, and impairs conduction in the right bundle branch. The S1Q3T3 pattern reflects right ventricular dilatation causing clockwise cardiac rotation and rightward axis shift.
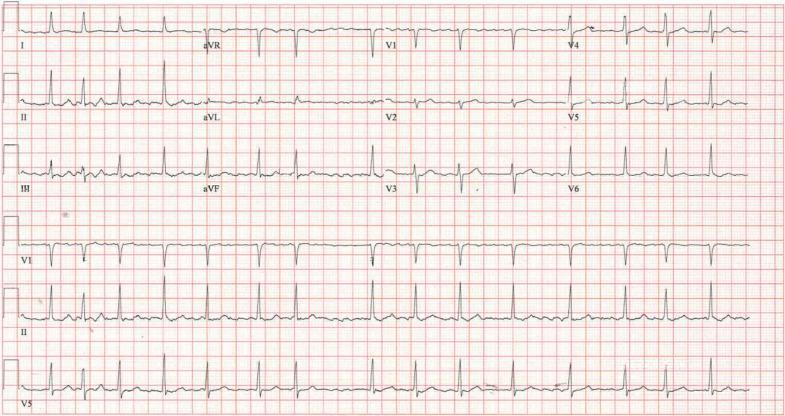
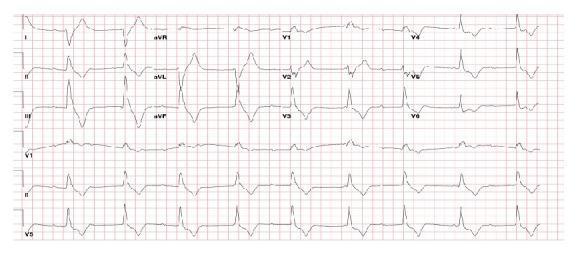
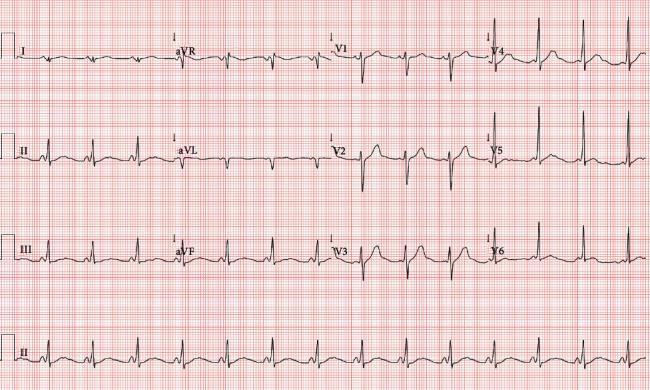
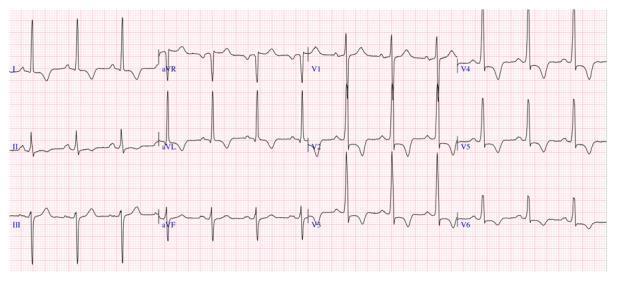
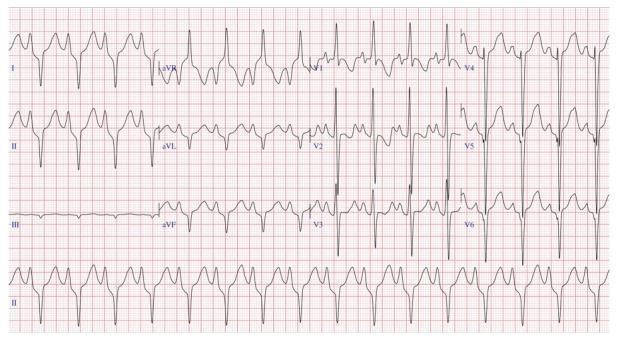
9. 🏋️ Left Ventricular Hypertrophy (LVH)
ECG Changes
| Feature | Finding |
|---|---|
| Sokolow-Lyon | SV1 + RV5 or RV6 ≥35 mm |
| Cornell voltage | RaVL + SV3 >20 mm (women) or >28 mm (men) |
| Strain pattern | ST depression + T-wave inversion in lateral leads (I, aVL, V4–V6) |
| Left axis deviation | Common |
| P-wave | Left atrial enlargement (bifid P in II, biphasic in V1) |
| QRS duration | Mildly prolonged |
Explanation
Increased left ventricular mass generates larger electrical forces during depolarization, producing high-voltage QRS complexes. The "strain pattern" (ST depression + T-wave inversion in lateral leads) results from repolarization abnormalities caused by subendocardial ischemia in the hypertrophied wall.
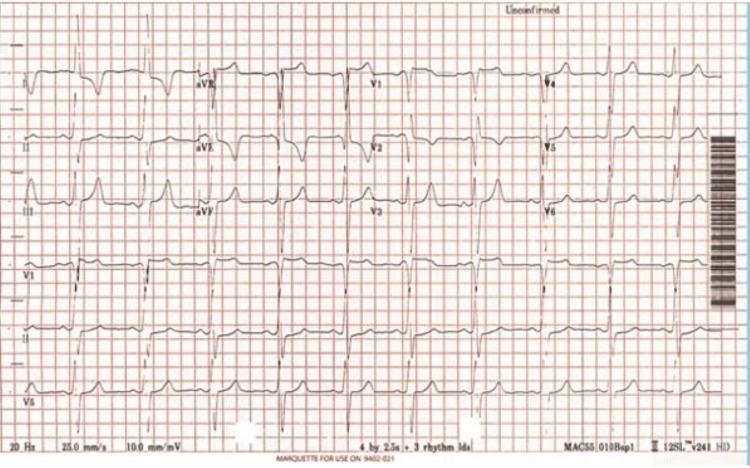
10. 🧬 Hypertrophic Cardiomyopathy (HCM)
ECG Changes
| Feature | Finding |
|---|---|
| Voltage | High-amplitude QRS (LVH criteria) in most patients |
| Pathological Q waves | Deep narrow Q waves in lateral (I, aVL, V5–V6) or inferior leads — due to septal hypertrophy |
| T-wave inversions | Deep "giant" T-wave inversions (>10 mm) — especially apical HCM (Yamaguchi variant) |
| ST changes | Widespread ST depression, strain pattern |
| Rhythm | AF, VT, PVCs common |
| Missing septal Q waves | Absence of normal septal Q waves in I, aVL, V5–V6 |
| QTc | May be prolonged |
Explanation
Massive septal hypertrophy reverses the normal septal depolarization vector, causing deep narrow Q waves in lateral leads (instead of normal small septal q waves). The hypertrophied myocardium also generates giant repolarization abnormalities. Myofiber disarray disrupts normal conduction, increasing arrhythmic risk. Apical HCM produces the dramatic "giant T-wave inversion" pattern across precordial leads.
Quick Reference Summary
| # | Condition | Key ECG Hallmark |
|---|---|---|
| 1 | STEMI | Convex ST elevation + Q waves in territory |
| 2 | Pericarditis | Diffuse concave ST elevation + PR depression |
| 3 | Atrial Fibrillation | No P waves, irregularly irregular RR |
| 4 | 3° AV Block | AV dissociation, slow escape rhythm |
| 5 | Ventricular Tachycardia | Wide complex tachycardia, AV dissociation |
| 6 | Ventricular Fibrillation | Chaotic oscillations, no QRS |
| 7 | WPW Syndrome | Short PR + delta wave |
| 8 | Pulmonary Embolism | S1Q3T3, sinus tachycardia, RBBB |
| 9 | LVH | High voltage + lateral strain pattern |
| 10 | HCM | Deep Q waves, giant T inversions, LVH |
Clinical Pearl: Always interpret the ECG in context — no single finding is diagnostic in isolation. The combination of rate, rhythm, morphology, and clinical presentation determines the diagnosis.
This is a shared conversation. Sign in to Orris to start your own chat.